 |
| |
| |
| |
| |
| |
| |
|

| TissGeneSummary for SIGLEC11 |
 Gene summary Gene summary |
| Basic gene information | Gene symbol | SIGLEC11 |
| Gene name | sialic acid binding Ig-like lectin 11 | |
| Synonyms | - | |
| Cytomap | UCSC genome browser: 19q13.33 | |
| Type of gene | protein-coding | |
| RefGenes | NM_001135163.1, NM_052884.2, | |
| Description | sialic acid-binding Ig-like lectin 11siglec-11 | |
| Modification date | 20141207 | |
| dbXrefs | MIM : 607157 | |
| HGNC : HGNC | ||
| Ensembl : ENSG00000161640 | ||
| HPRD : 06196 | ||
| Vega : OTTHUMG00000157077 | ||
| Protein | UniProt: go to UniProt's Cross Reference DB Table | |
| Expression | CleanEX: HS_SIGLEC11 | |
| BioGPS: 114132 | ||
| Pathway | NCI Pathway Interaction Database: SIGLEC11 | |
| KEGG: SIGLEC11 | ||
| REACTOME: SIGLEC11 | ||
| Pathway Commons: SIGLEC11 | ||
| Context | iHOP: SIGLEC11 | |
| ligand binding site mutation search in PubMed: SIGLEC11 | ||
| UCL Cancer Institute: SIGLEC11 | ||
| Assigned class in TissGDB* | C | |
| Included tissue-specific gene expression resources | TiGER,GTEx | |
| Specific-tissues in normal samples (assigned by TissGDB using HPA, TiGER, and GTEx) | Ovary | |
| Cancer types related to the specific-tissues in cancer samples (assigned by TissGDB using TCGA) | OV | |
| Reference showing the relevant tissue of SIGLEC11 | ||
| Description by TissGene annotations | ||
| * Class A consists of genes with literature evidence and is part of the cTissGenes. Class B consists of only cTissGenes without additional evidence. The remaining genes belong to Class C. |
| Gene ontology having evidence of Inferred from Direct Assay (IDA) from Entrez |
| GO ID | GO term | PubMed ID |
| Top |
| TissGeneExp for SIGLEC11 |
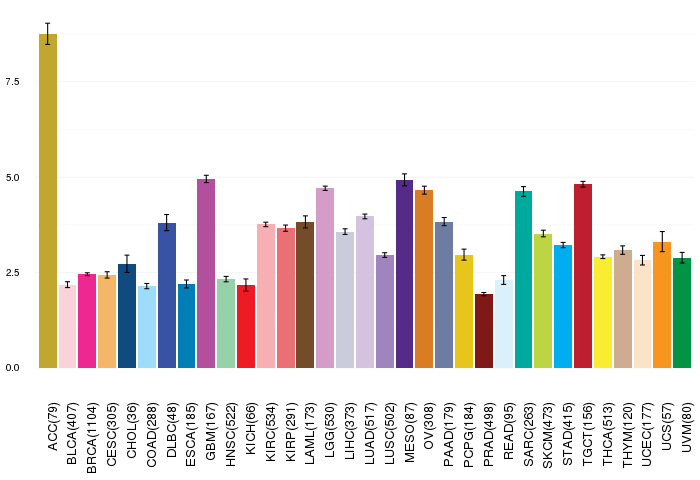
| Gene expressions across 28 cancer types (X-axis: cancer type and Y-axis: log2(norm_counts+1)) (TCGA IlluminaHiSeq_RNASeqV2, pan-cancer normalized log2(norm_counts+1) data, version 2016-08-16) |
 |
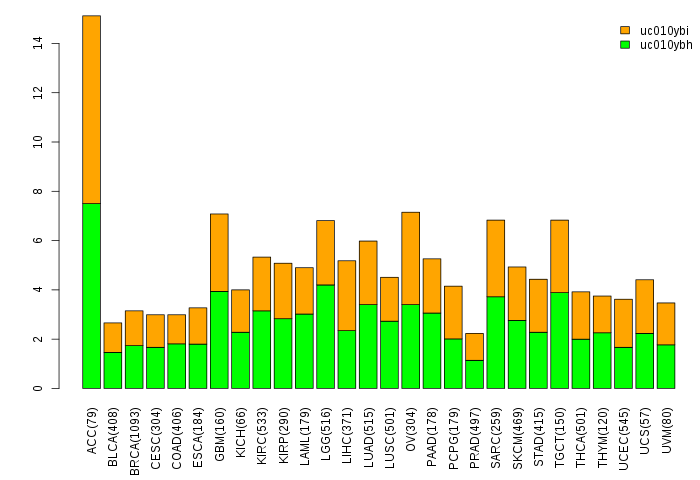
| Gene isoform expressions across 28 cancer types (X-axis: cancer type and Y-axis: log2(norm_counts+1)) (TCGA pan-cancer tcga_rsem_isoform_tpm, version 2016-09-01) |
 |
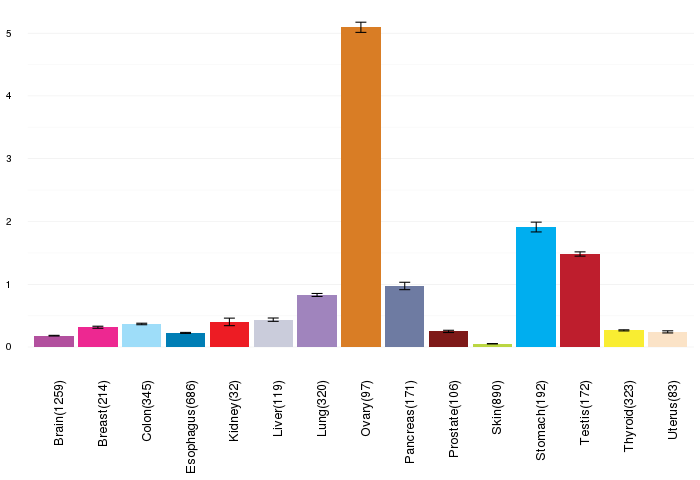
| Gene expressions across normal tissues of GTEx data (GTEx GTEx_Analysis_v6_RNA-seq_RNA-SeQCv1.1.8_gene_rpkm.gct) - Here, we shows the matched tissue types only among our 28 cancer types. |
 |
| Different expressions across 14 cancer types with more than 10 samples between matched tumors and normals (X-axis: cancer type and Y-axis: log2(norm_counts+1)) (TCGA IlluminaHiSeq_RNASeqV2, pan-cancer normalized log2(norm_counts+1) data, version 2016-08-16) |
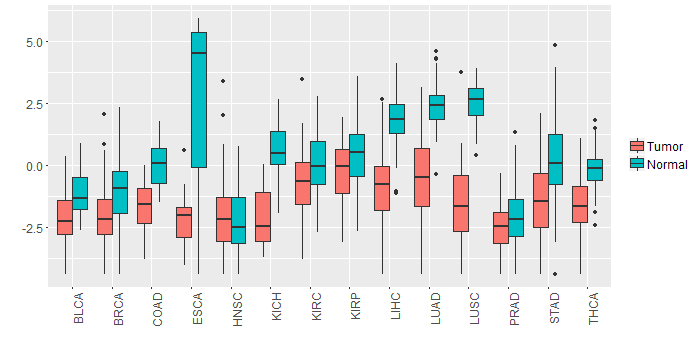 |
| - Significantly differentially expressed cancer types and information. (|Fold change|>1 and FDR<0.05) |
| Cancer type | Mean(exp) in tumor | Mean(exp) in matched normal | Log2FC | P-val. | FDR |
| BRCA | -2.034754656 | -0.965162551 | -1.069592105 | 2.25E-10 | 8.63E-10 |
| COAD | -1.679746289 | 0.009553711 | -1.6893 | 1.12E-07 | 7.79E-07 |
| LUAD | -0.588103053 | 2.372521085 | -2.960624138 | 2.15E-18 | 3.07E-17 |
| THCA | -1.590777776 | -0.121091335 | -1.469686441 | 2.03E-13 | 2.03E-12 |
| LIHC | -0.850957674 | 1.784796326 | -2.635754 | 3.61E-16 | 1.36E-14 |
| KICH | -2.101735674 | 0.583172326 | -2.684908 | 1.19E-11 | 1.12E-10 |
| LUSC | -1.492082262 | 2.48934911 | -3.981431373 | 3.80E-27 | 1.11E-25 |
| ESCA | -2.073511674 | 2.440706508 | -4.514218182 | 0.00201 | 0.02291736 |
| BLCA | -2.131648516 | -1.062748516 | -1.0689 | 0.00343 | 0.019917285 |
| STAD | -1.287449174 | 0.245857076 | -1.53330625 | 0.00191 | 0.008820513 |
| Top |
| TissGene-miRNA for SIGLEC11 |
| Significantly anti-correlated miRNAs of TissGene across 28 cancer types (Gene-miRNA relations from TargetScanHuman Relsease 7.1, Conserved_Site_Context_Scores.txt.zip, 06.01.2016) (TCGA IlluminaHiSeq_miRNASeq, log2(RPM+1) data, version 2016-11-21) (TCGA IlluminaHiSeq_RNASeqV2, log2(normalized_count+1) data, version 2016-08-16) (Spearman’s Rank Correlation (p-value<0.05 and coefficient<-0.25)) |
| Cancer type | miRNA id | miRNA accession | P-val. | Coeff. | # samples |
| Top |
| TissGeneMut for SIGLEC11 |
| TissGeneSNV for SIGLEC11 |
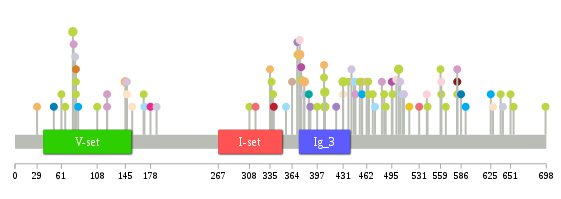
| nsSNV counts per each loci. Different colors of circles represent different cancer types. Circle size denotes number of samples. (TCGA somatic mutation (SNPs and small INDELs) data, version 2016-04-25) * Click on the image to enlarge it in a new window. |
 |
 |
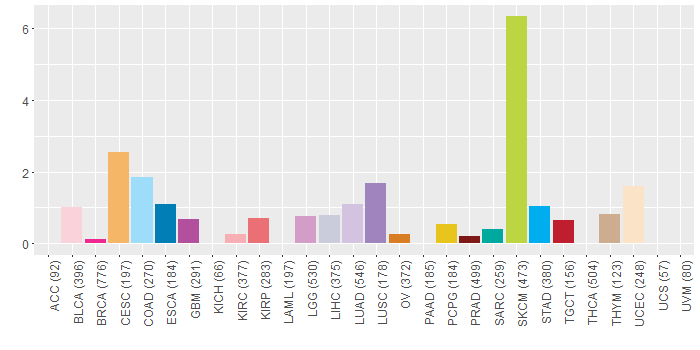
| Somatic nucleotide variants of TissGene across 28 cancer types (X-axis: cancer type and Y-axis: % of mutated samples) The numbers in parentheses are numbers of samples with mutation (nsSNVs). (TCGA somatic mutation (SNPs and small INDELs) data, version 2016-04-25) |
 |
| - nsSNVs sorted by frequency. |
| AAchange | Cancer type | # samples |
| p.G407E | SKCM | 2 |
| p.E504K | SKCM | 2 |
| p.P380R | CESC | 2 |
| p.G76R | SKCM | 2 |
| p.G374R | CESC | 2 |
| p.G407R | SKCM | 2 |
| p.E431K | SKCM | 2 |
| p.S145N | CESC | 2 |
| p.V453M | SKCM | 1 |
| p.P697S | SKCM | 1 |
| p.G501D | BLCA | 1 |
| p.P456L | SKCM | 1 |
| p.W655* | SKCM | 1 |
| p.Q364K | THYM | 1 |
| p.V178G | BRCA | 1 |
| p.G376S | SKCM | 1 |
| p.G628C | UCEC | 1 |
| p.E422D | LUSC | 1 |
| p.V581I | SKCM | 1 |
| p.W559X | SKCM | 1 |
| p.A154T | UCEC | 1 |
| p.W406G | SKCM | 1 |
| p.L442V | LUAD | 1 |
| p.E638K | SKCM | 1 |
| p.A147V | LUAD | 1 |
| p.Q445K | LUAD | 1 |
| p.S386I | SARC | 1 |
| p.C186X | LIHC | 1 |
| p.V485I | SKCM | 1 |
| p.G566R | SKCM | 1 |
| p.G560C | BLCA | 1 |
| p.W406G | HNSC | 1 |
| p.P397S | SKCM | 1 |
| p.S308L | SKCM | 1 |
| p.G496E | SKCM | 1 |
| p.V447A | LGG | 1 |
| p.R388S | LUSC | 1 |
| p.V447I | COAD | 1 |
| p.R339G | SKCM | 1 |
| p.E371D | READ | 1 |
| p.L518P | PCPG | 1 |
| p.G376C | GBM | 1 |
| p.P80L | SKCM | 1 |
| p.P380R | HNSC | 1 |
| p.D61N | SKCM | 1 |
| p.P462L | KIRC | 1 |
| p.L340P | TGCT | 1 |
| p.G560D | SKCM | 1 |
| p.A121V | LGG | 1 |
| p.G470R | SKCM | 1 |
| p.V581I | PRAD | 1 |
| p.N29D | CESC | 1 |
| p.E495D | GBM | 1 |
| p.S79N | LIHC | 1 |
| p.E371G | LUSC | 1 |
| p.R132W | READ | 1 |
| p.P80T | SKCM | 1 |
| p.D108N | SKCM | 1 |
| p.V581I | LGG | 1 |
| p.P456S | STAD | 1 |
| p.W406G | MESO | 1 |
| p.G464D | SKCM | 1 |
| p.R335G | CESC | 1 |
| p.G83V | STAD | 1 |
| p.P80R | OV | 1 |
| p.P625Q | STAD | 1 |
| p.R592C | STAD | 1 |
| p.Q541H | BLCA | 1 |
| p.S416L | HNSC | 1 |
| p.E641V | LIHC | 1 |
| p.V473I | COAD | 1 |
| p.S509L | COAD | 1 |
| p.W487* | SKCM | 1 |
| p.A147V | UCEC | 1 |
| p.G170R | COAD | 1 |
| p.A438S | SKCM | 1 |
| p.R531C | KIRP | 1 |
| p.I586M | ESCA | 1 |
| p.S66F | SKCM | 1 |
| p.T506N | LUAD | 1 |
| p.I51V | ESCA | 1 |
| p.P380R | LUAD | 1 |
| p.E371V | SKCM | 1 |
| p.E542K | SKCM | 1 |
| p.G511A | LUAD | 1 |
| p.E356D | COAD | 1 |
| p.R653K | HNSC | 1 |
| p.R77W | LGG | 1 |
| p.S481P | READ | 1 |
| p.E337K | SKCM | 1 |
| p.G651S | SKCM | 1 |
| p.E431* | UCEC | 1 |
| p.G374E | BLCA | 1 |
| p.W406G | CESC | 1 |
| p.A121T | LGG | 1 |
| p.S465F | SKCM | 1 |
| p.P169L | SKCM | 1 |
| p.T316P | KIRP | 1 |
| p.A482T | LGG | 1 |
| Top |
| TissGeneCNV for SIGLEC11 |
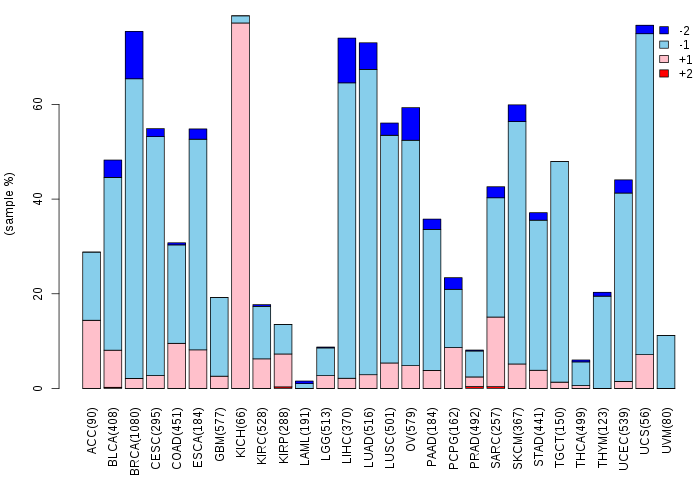
| Copy number variations of TissGene across 28 cancer types (X-axis: cancer type and Y-axis: % of CNV samples) (TCGA Gistic2_CopyNumber_Gistic2_all_data_by_genes, Gistic2 copy number data, version 2016-08-16) |
 |
| Top |
| TissGeneFusions for SIGLEC11 |
| Fusion genes including TissGene (ChimerDB 3.0, 2016-12-01 and TCGA fusion Portal 2015-12-01) |
| Database | Src | Cancer type | Sample | Fusion gene | ORF | 5'-gene BP | 3'-gene BP |
| Top |
| TissGeneNet for SIGLEC11 |
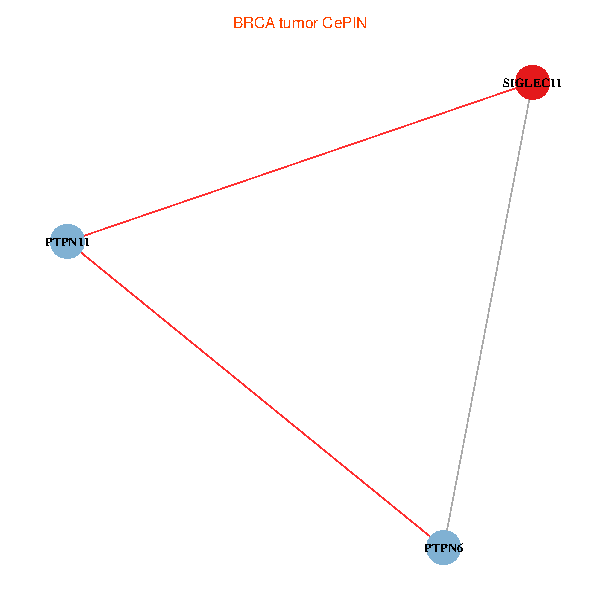
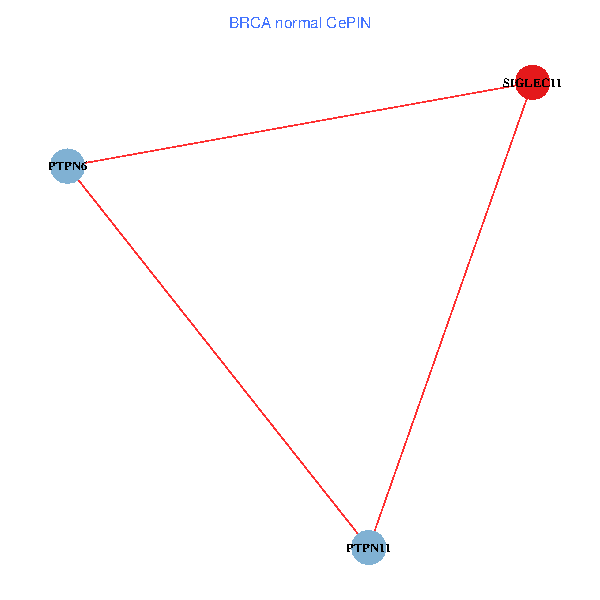
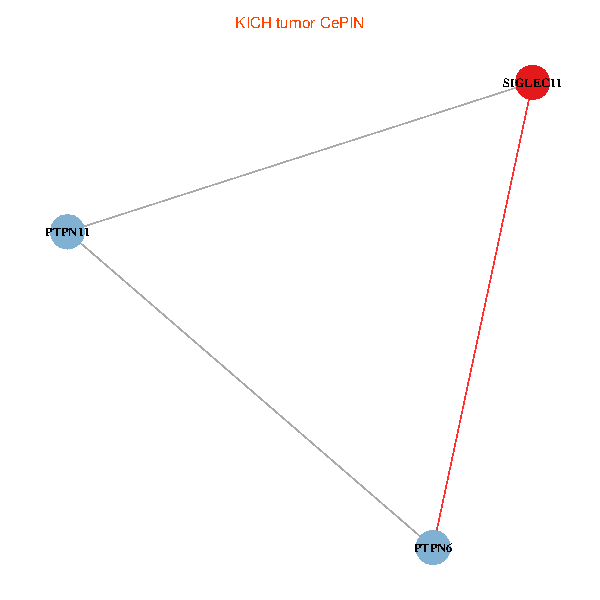
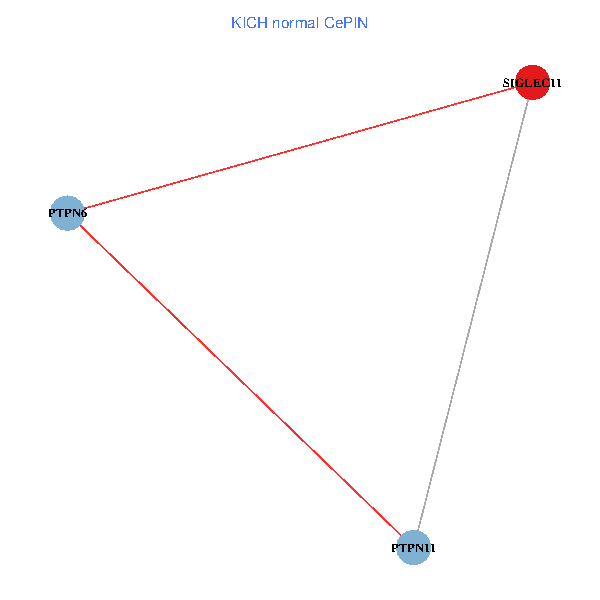
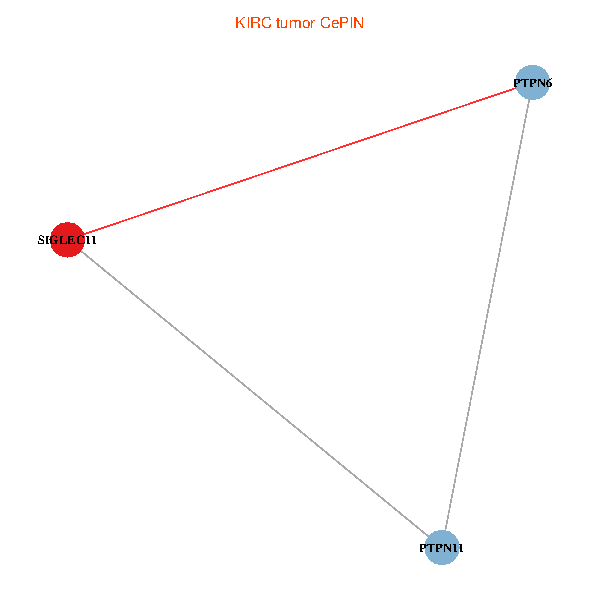
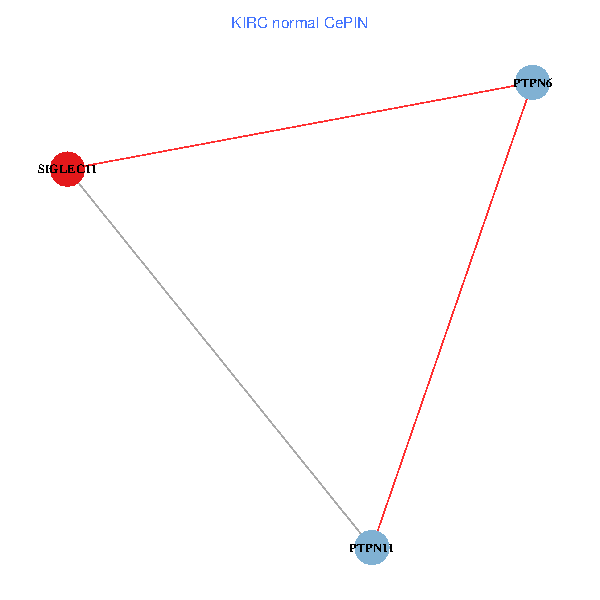
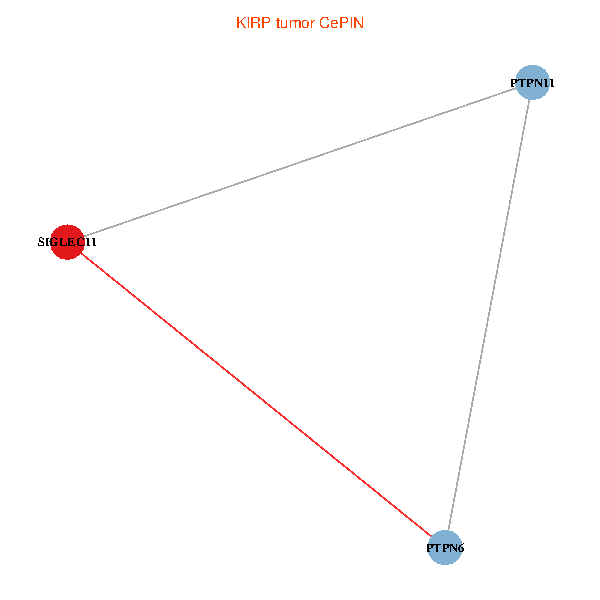
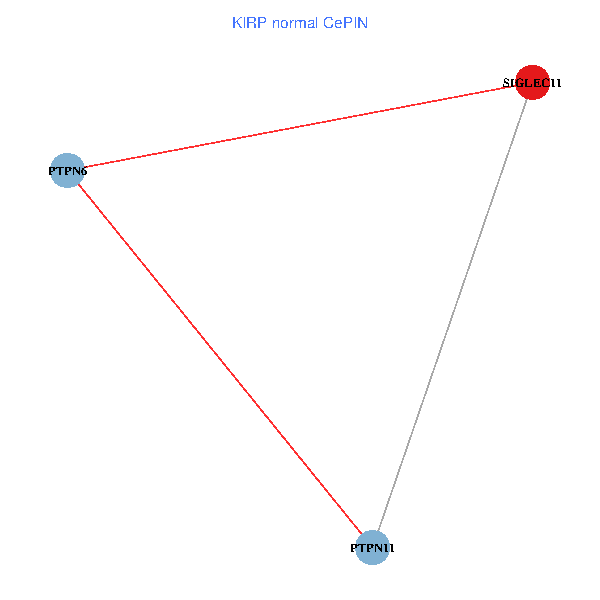
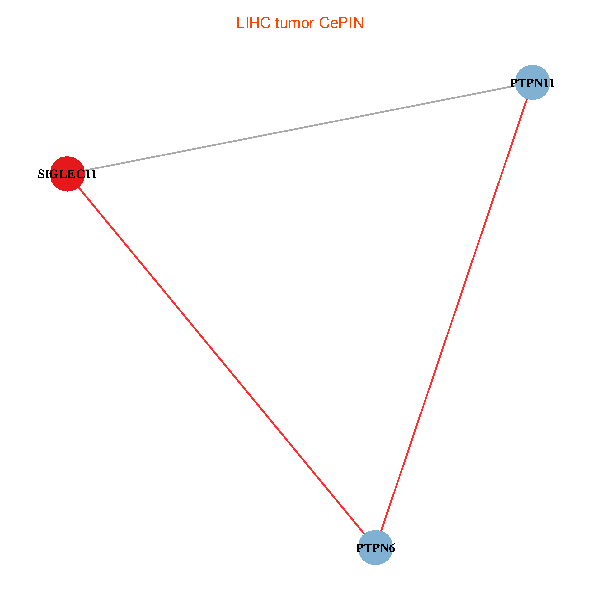
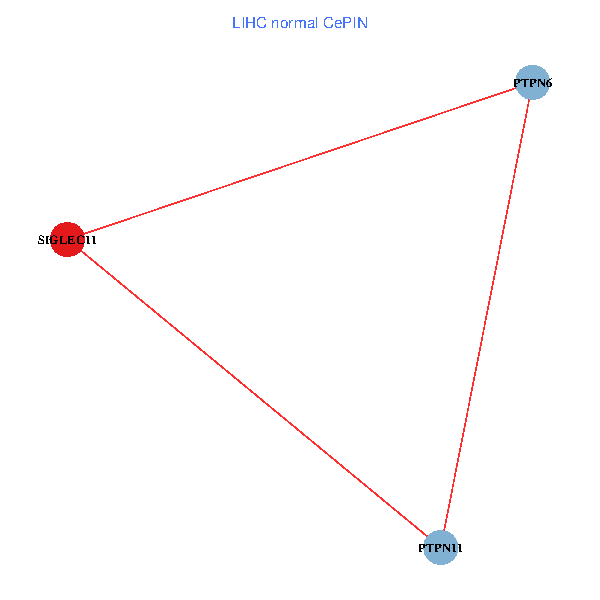
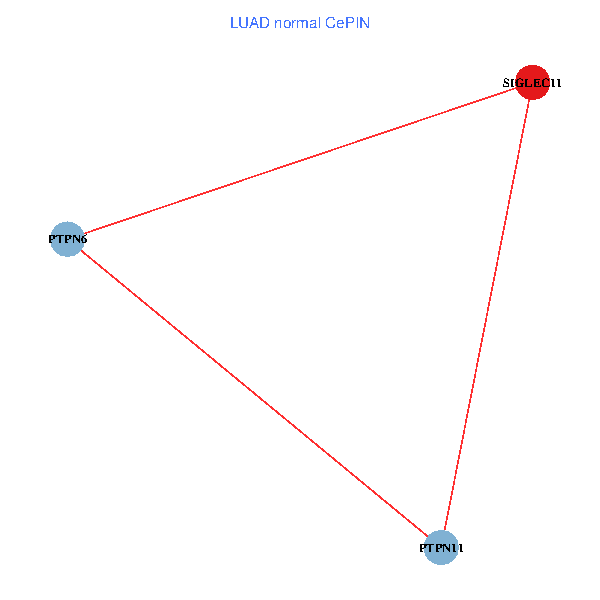
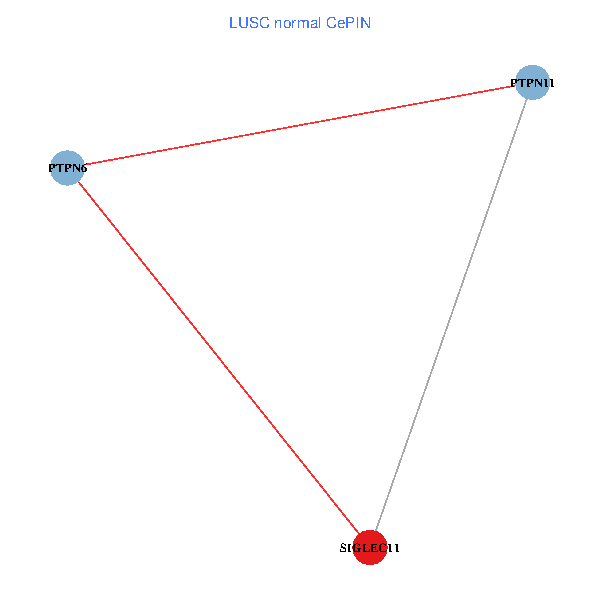
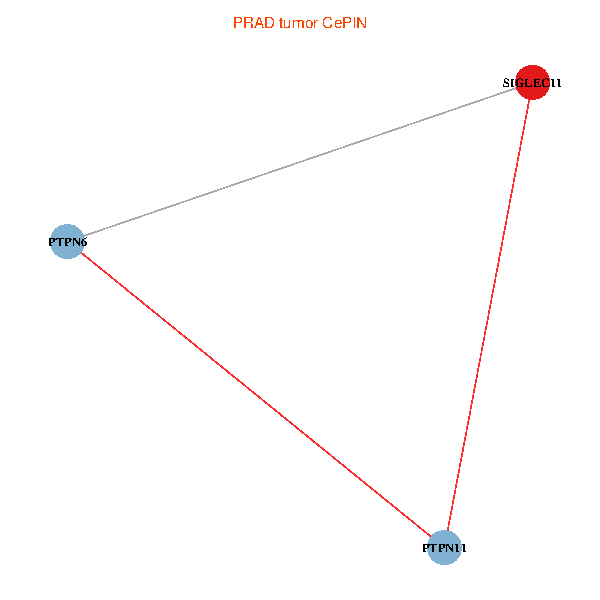
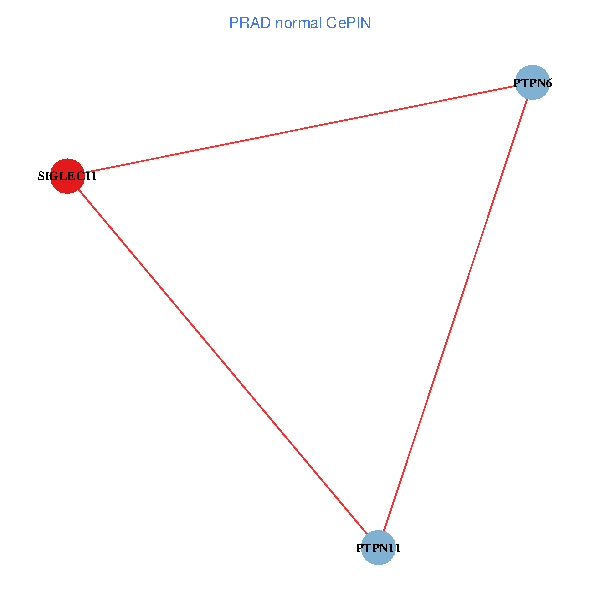
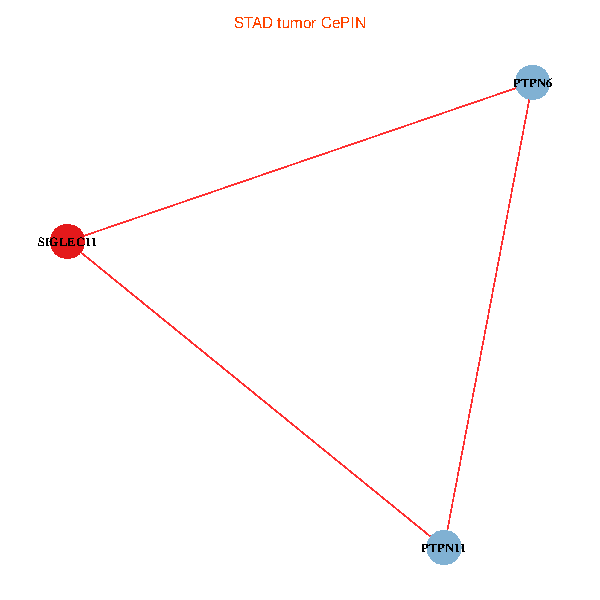
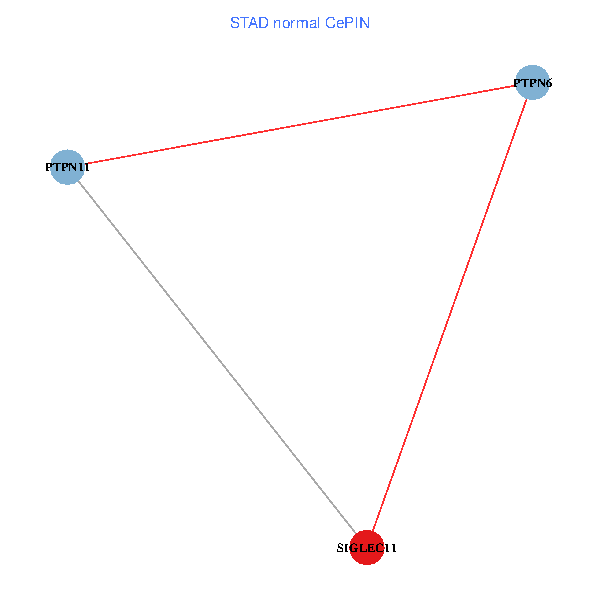
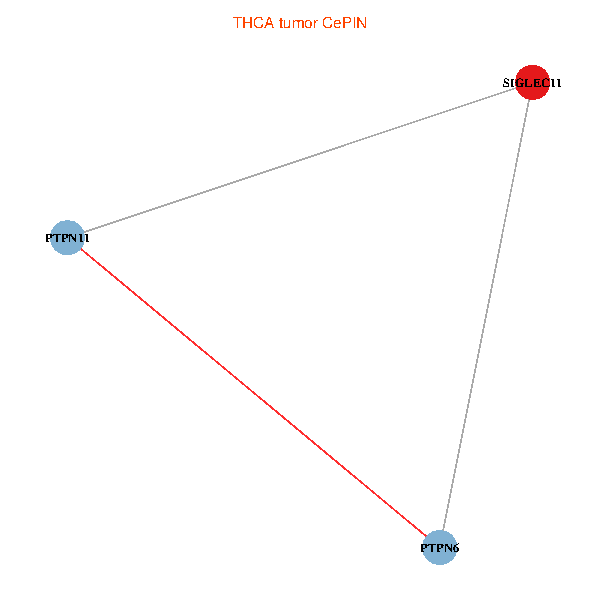
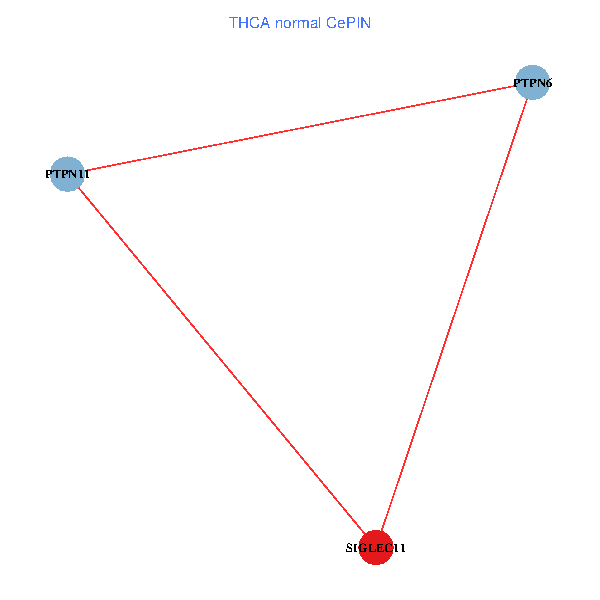
| Co-expressed gene networks based on protein-protein interaction data (CePIN) (TCGA IlluminaHiSeq_RNASeqV2, pan-cancer normalized log2(norm_counts+1) data, version 2016-08-16) (PINA2 ppi data) |
| BRCA (tumor) | BRCA (normal) |
| SIGLEC11, PTPN6, PTPN11 (tumor) | SIGLEC11, PTPN6, PTPN11 (normal) |
 |  |
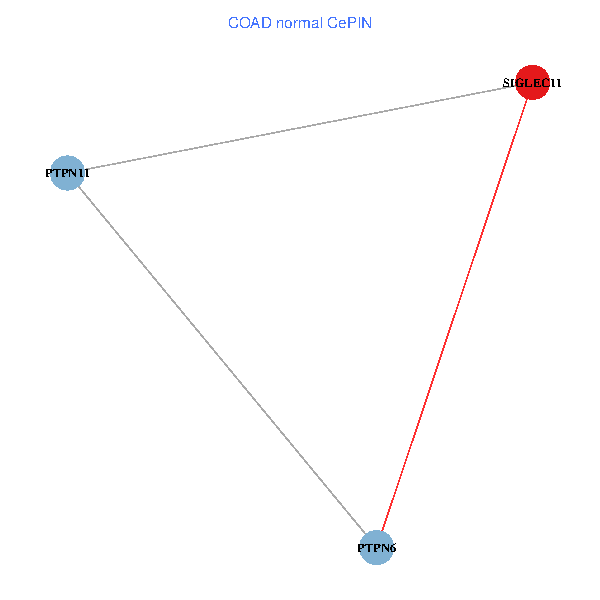
| COAD (tumor) | COAD (normal) |
| SIGLEC11, PTPN6, PTPN11 (tumor) | SIGLEC11, PTPN6, PTPN11 (normal) |
 |  |
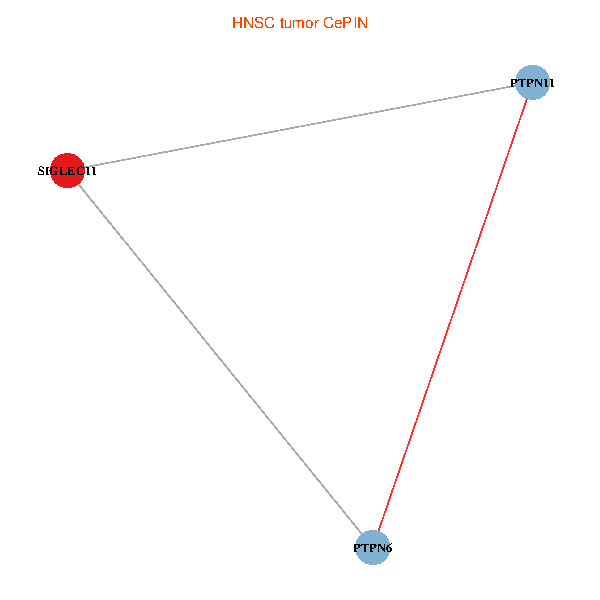
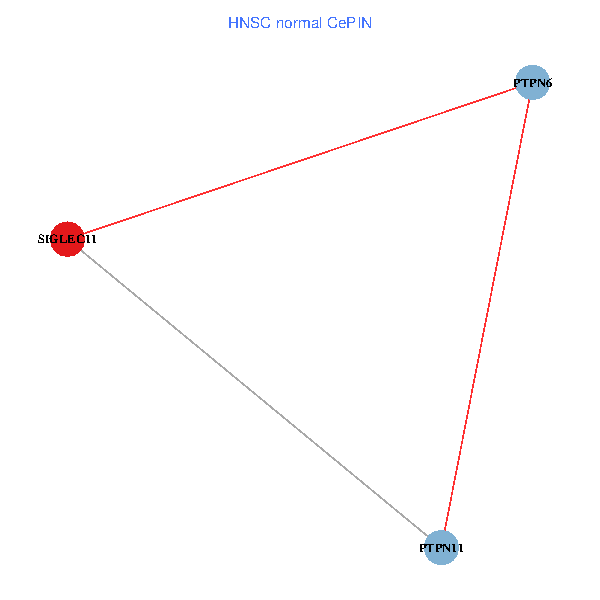
| HNSC (tumor) | HNSC (normal) |
| SIGLEC11, PTPN6, PTPN11 (tumor) | SIGLEC11, PTPN6, PTPN11 (normal) |
 |  |
| KICH (tumor) | KICH (normal) |
| SIGLEC11, PTPN6, PTPN11 (tumor) | SIGLEC11, PTPN6, PTPN11 (normal) |
 |  |
| KIRC (tumor) | KIRC (normal) |
| SIGLEC11, PTPN6, PTPN11 (tumor) | SIGLEC11, PTPN6, PTPN11 (normal) |
 |  |
| KIRP (tumor) | KIRP (normal) |
| SIGLEC11, PTPN6, PTPN11 (tumor) | SIGLEC11, PTPN6, PTPN11 (normal) |
 |  |
| LIHC (tumor) | LIHC (normal) |
| SIGLEC11, PTPN6, PTPN11 (tumor) | SIGLEC11, PTPN6, PTPN11 (normal) |
 |  |
| LUAD (tumor) | LUAD (normal) |
| SIGLEC11, PTPN6, PTPN11 (tumor) | SIGLEC11, PTPN6, PTPN11 (normal) |
 |  |
| LUSC (tumor) | LUSC (normal) |
| SIGLEC11, PTPN6, PTPN11 (tumor) | SIGLEC11, PTPN6, PTPN11 (normal) |
 |  |
| PRAD (tumor) | PRAD (normal) |
| SIGLEC11, PTPN6, PTPN11 (tumor) | SIGLEC11, PTPN6, PTPN11 (normal) |
 |  |
| STAD (tumor) | STAD (normal) |
| SIGLEC11, PTPN6, PTPN11 (tumor) | SIGLEC11, PTPN6, PTPN11 (normal) |
 |  |
| THCA (tumor) | THCA (normal) |
| SIGLEC11, PTPN6, PTPN11 (tumor) | SIGLEC11, PTPN6, PTPN11 (normal) |
 |  |
| Top |
| TissGeneProg for SIGLEC11 |
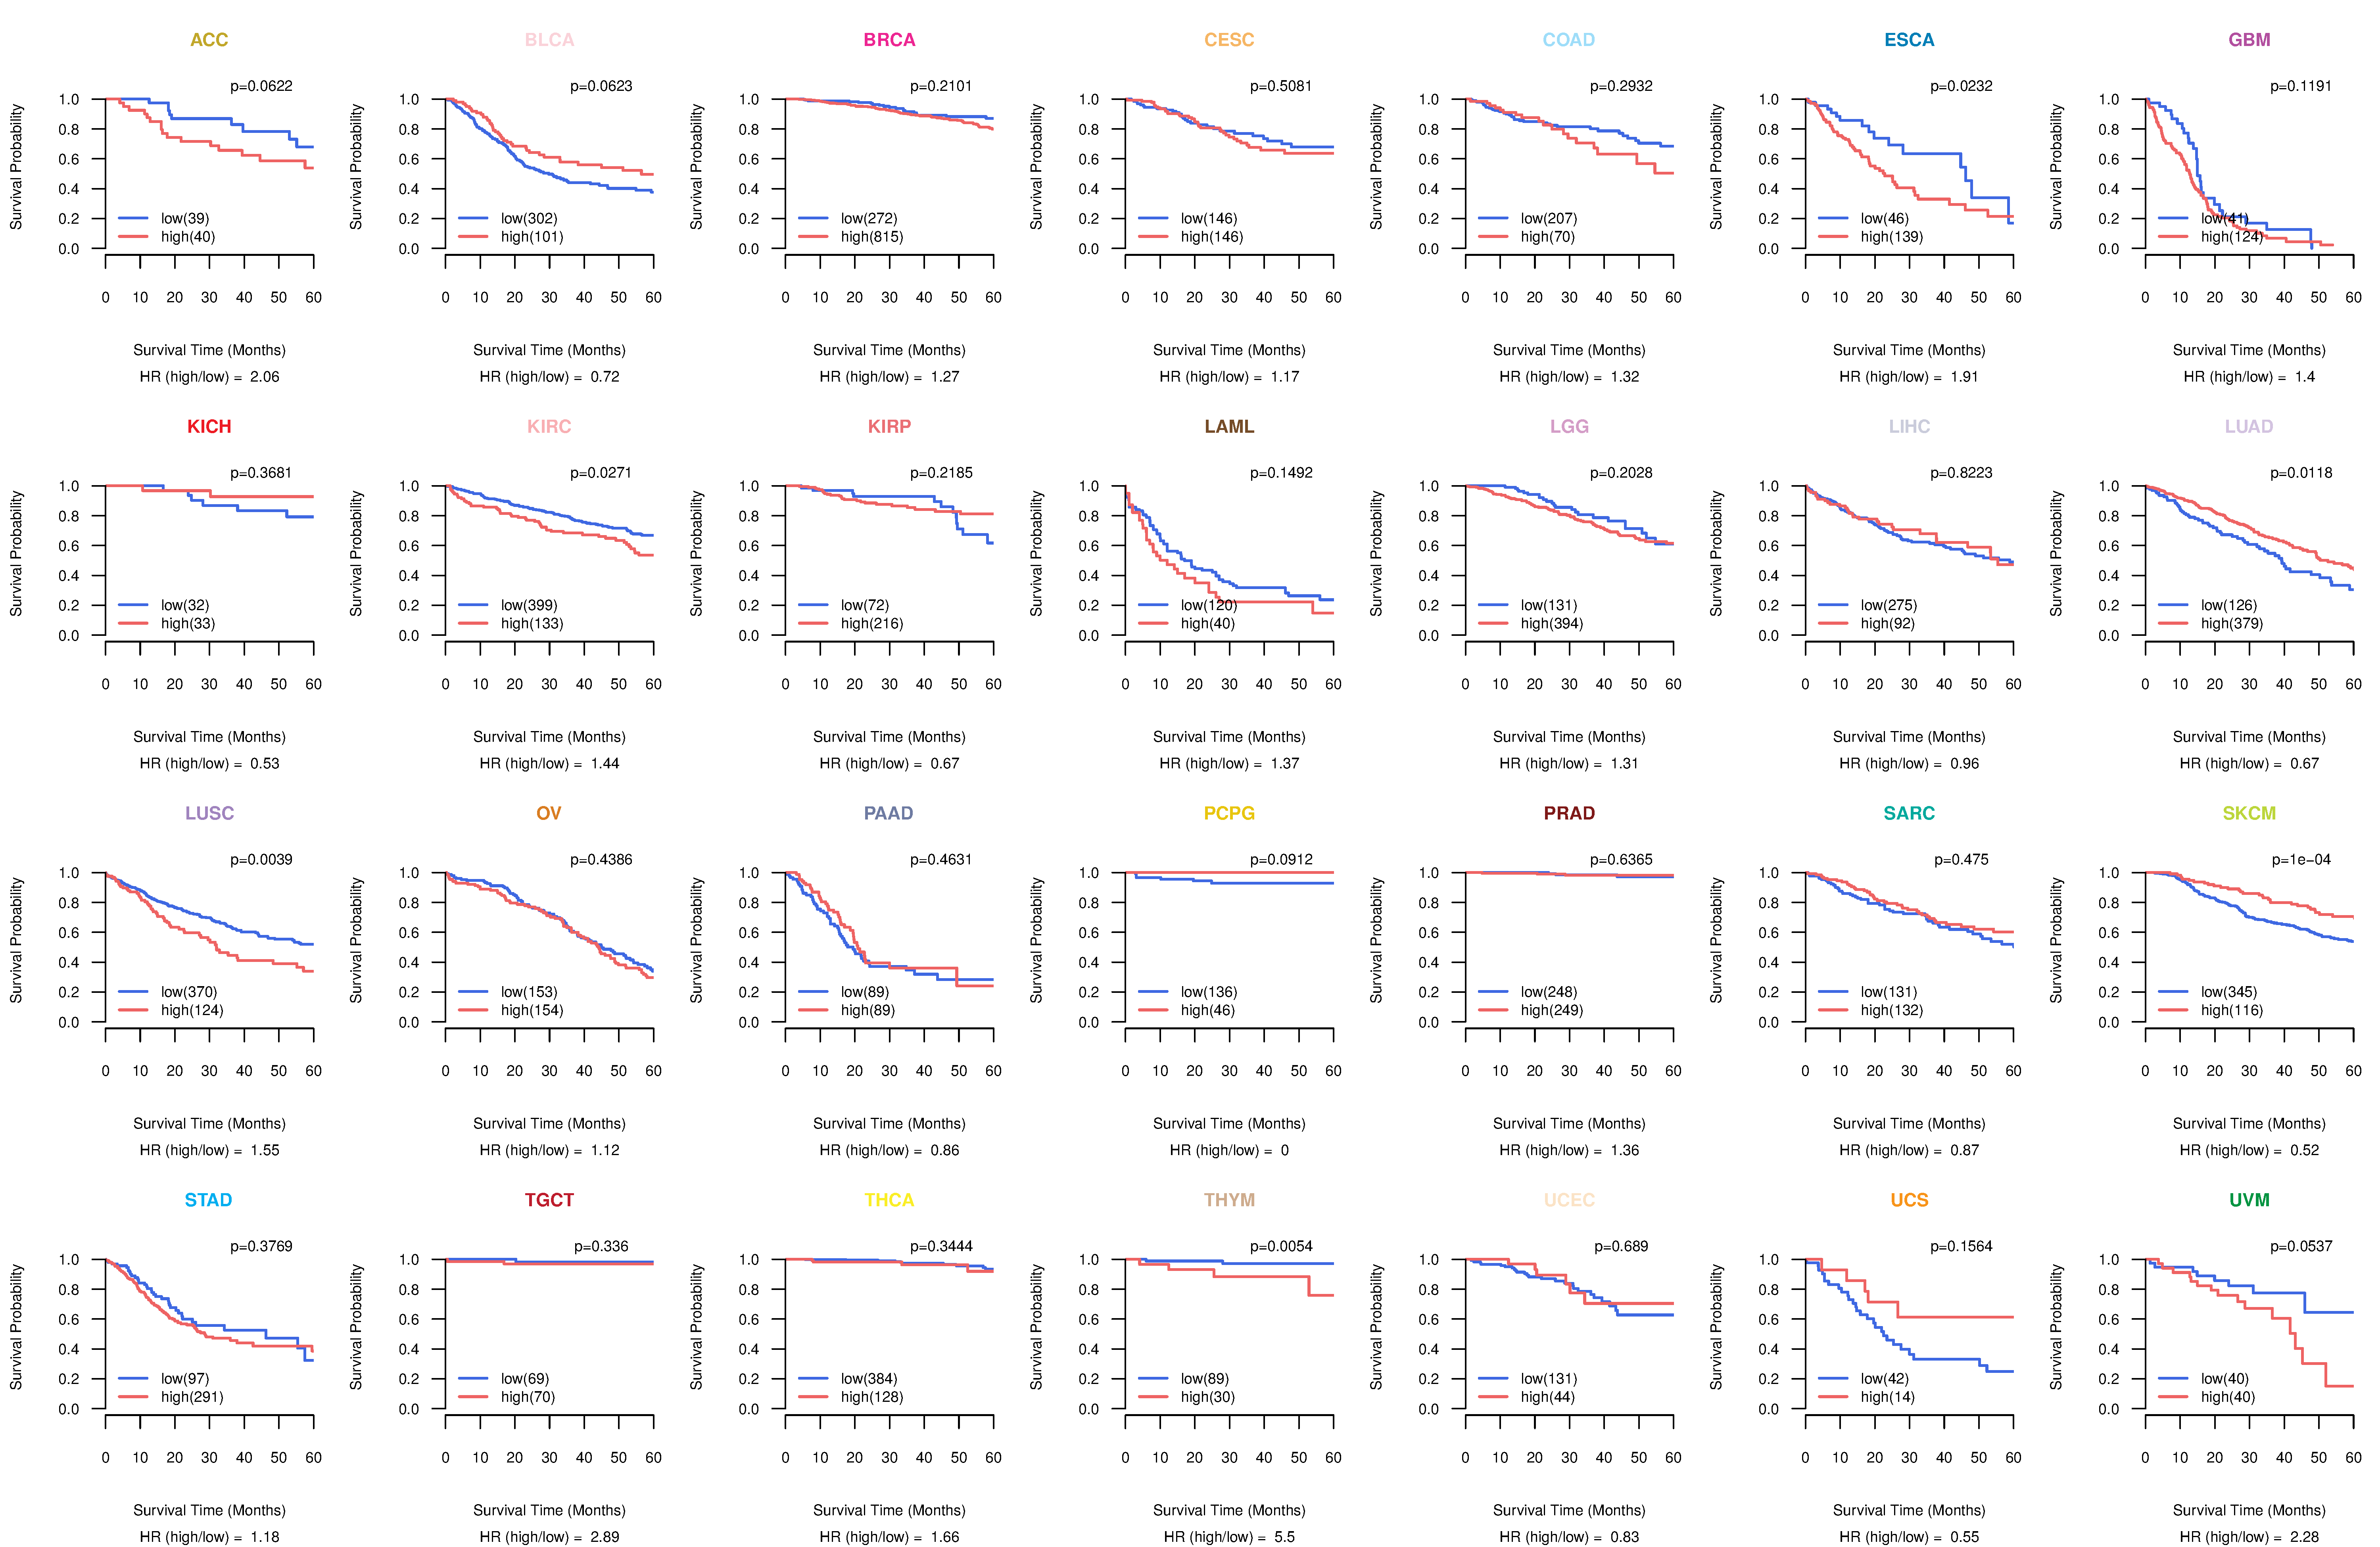
| Kaplan-Meier plots with logrank tests of overall survival (OS) using 28 cancer types (TCGA IlluminaHiSeq_RNASeqV2, pan-cancer normalized log2(norm_counts+1) data, version 2016-08-16) (TCGA clinicalMatrix, phenotype data, version 2016-04-27) * Click on the image to enlarge it in a new window. |
 |
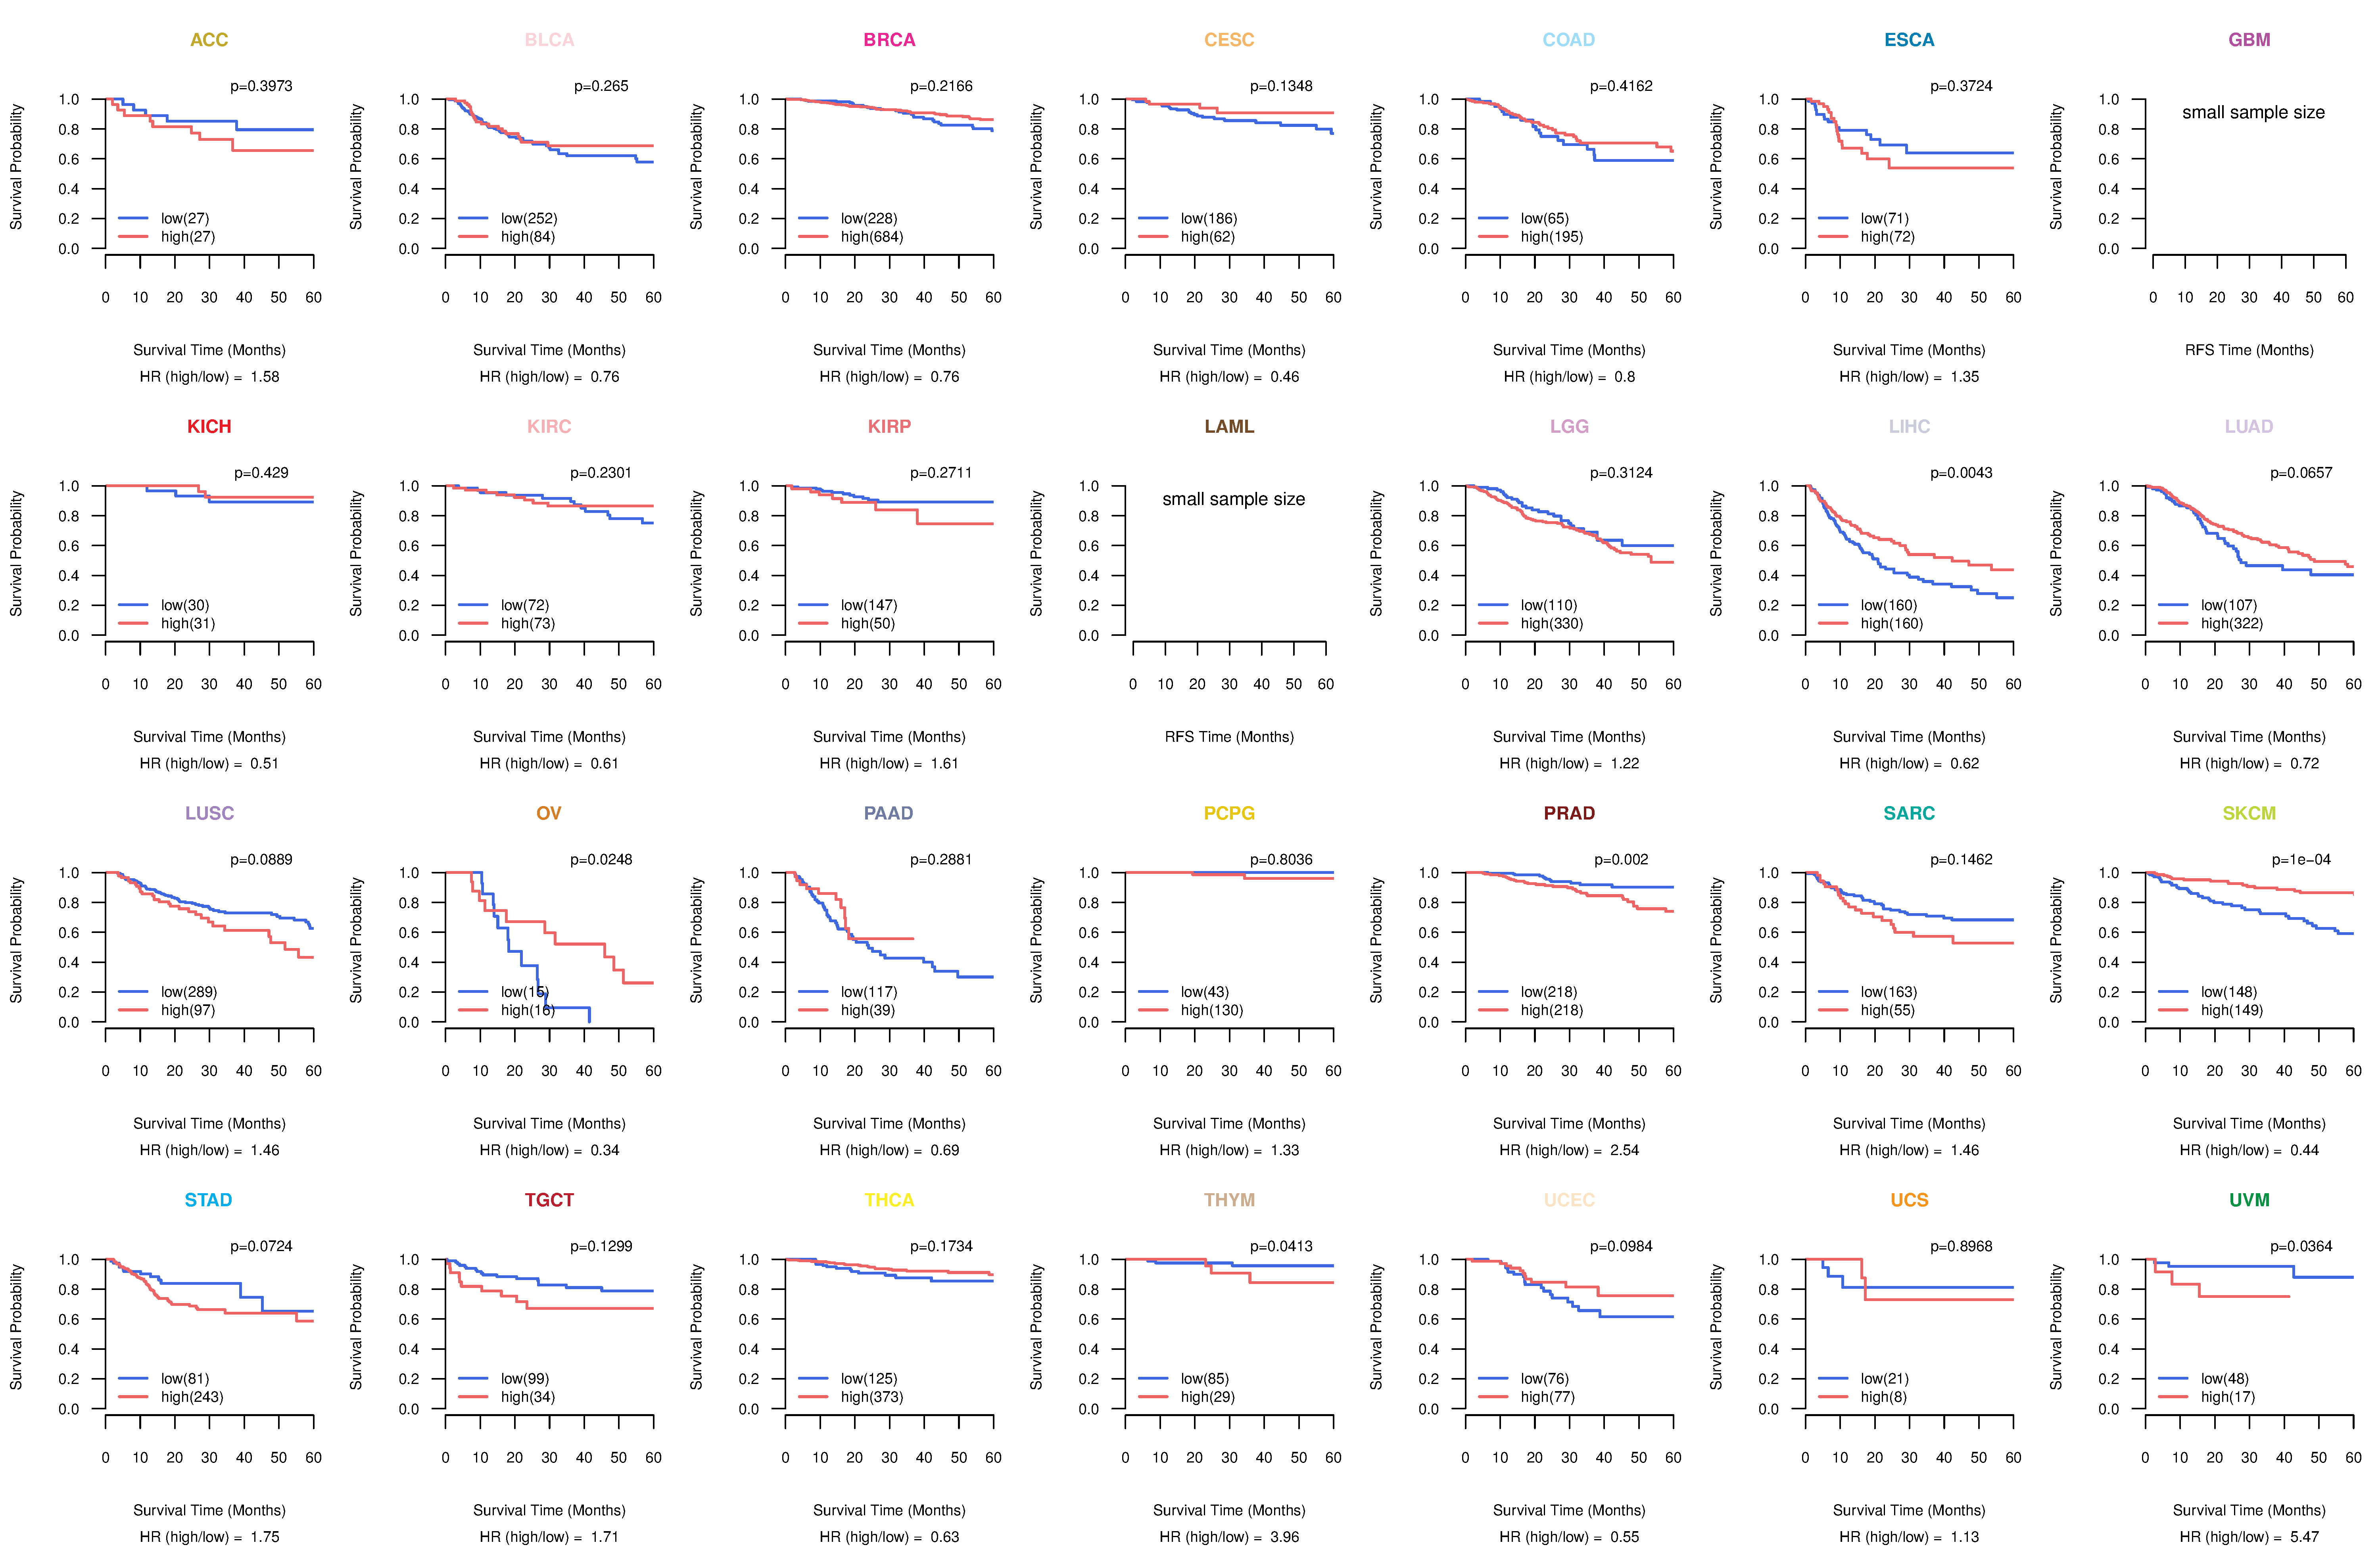
| Kaplan-Meier plots with logrank test of relapse free survival (RFS) using 28 cancer types (TCGA IlluminaHiSeq_RNASeqV2, pan-cancer normalized log2(norm_counts+1) data, version 2016-08-16) (TCGA clinicalMatrix, phenotype data, version 2016-04-27) * Click on the image enlarge it in a new window. |
 |
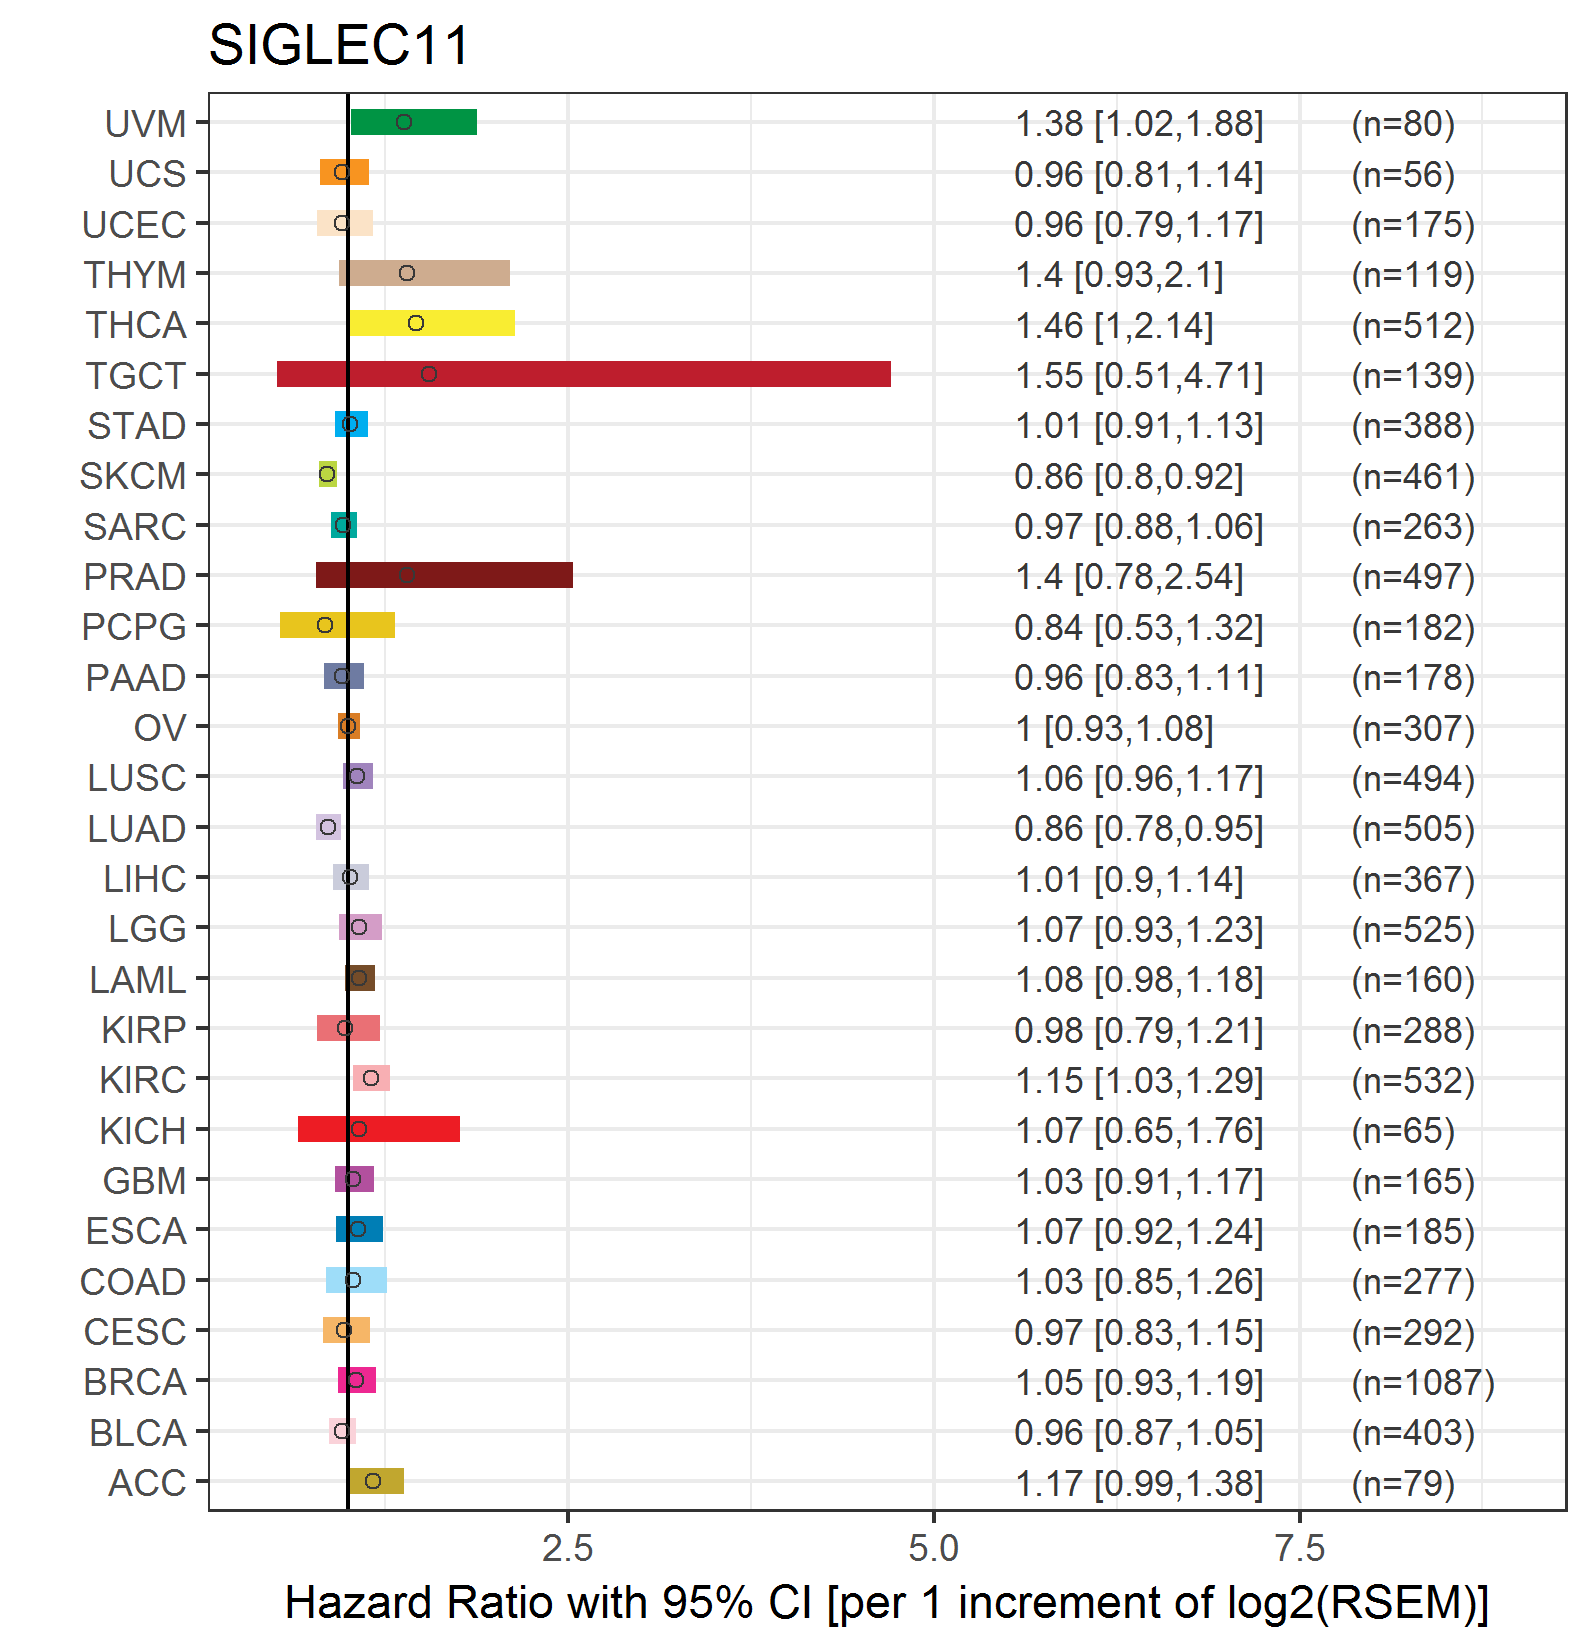
| Forest plot of Cox proportional hazard ratio (HR) and 95% CI of overall survival (OS) using 28 cancer types (TCGA IlluminaHiSeq_RNASeqV2, pan-cancer normalized log2(norm_counts+1) data, version 2016-08-16) (TCGA clinicalMatrix, phenotype data, version 2016-04-27) * Click on the image enlarge it in a new window. |
 |
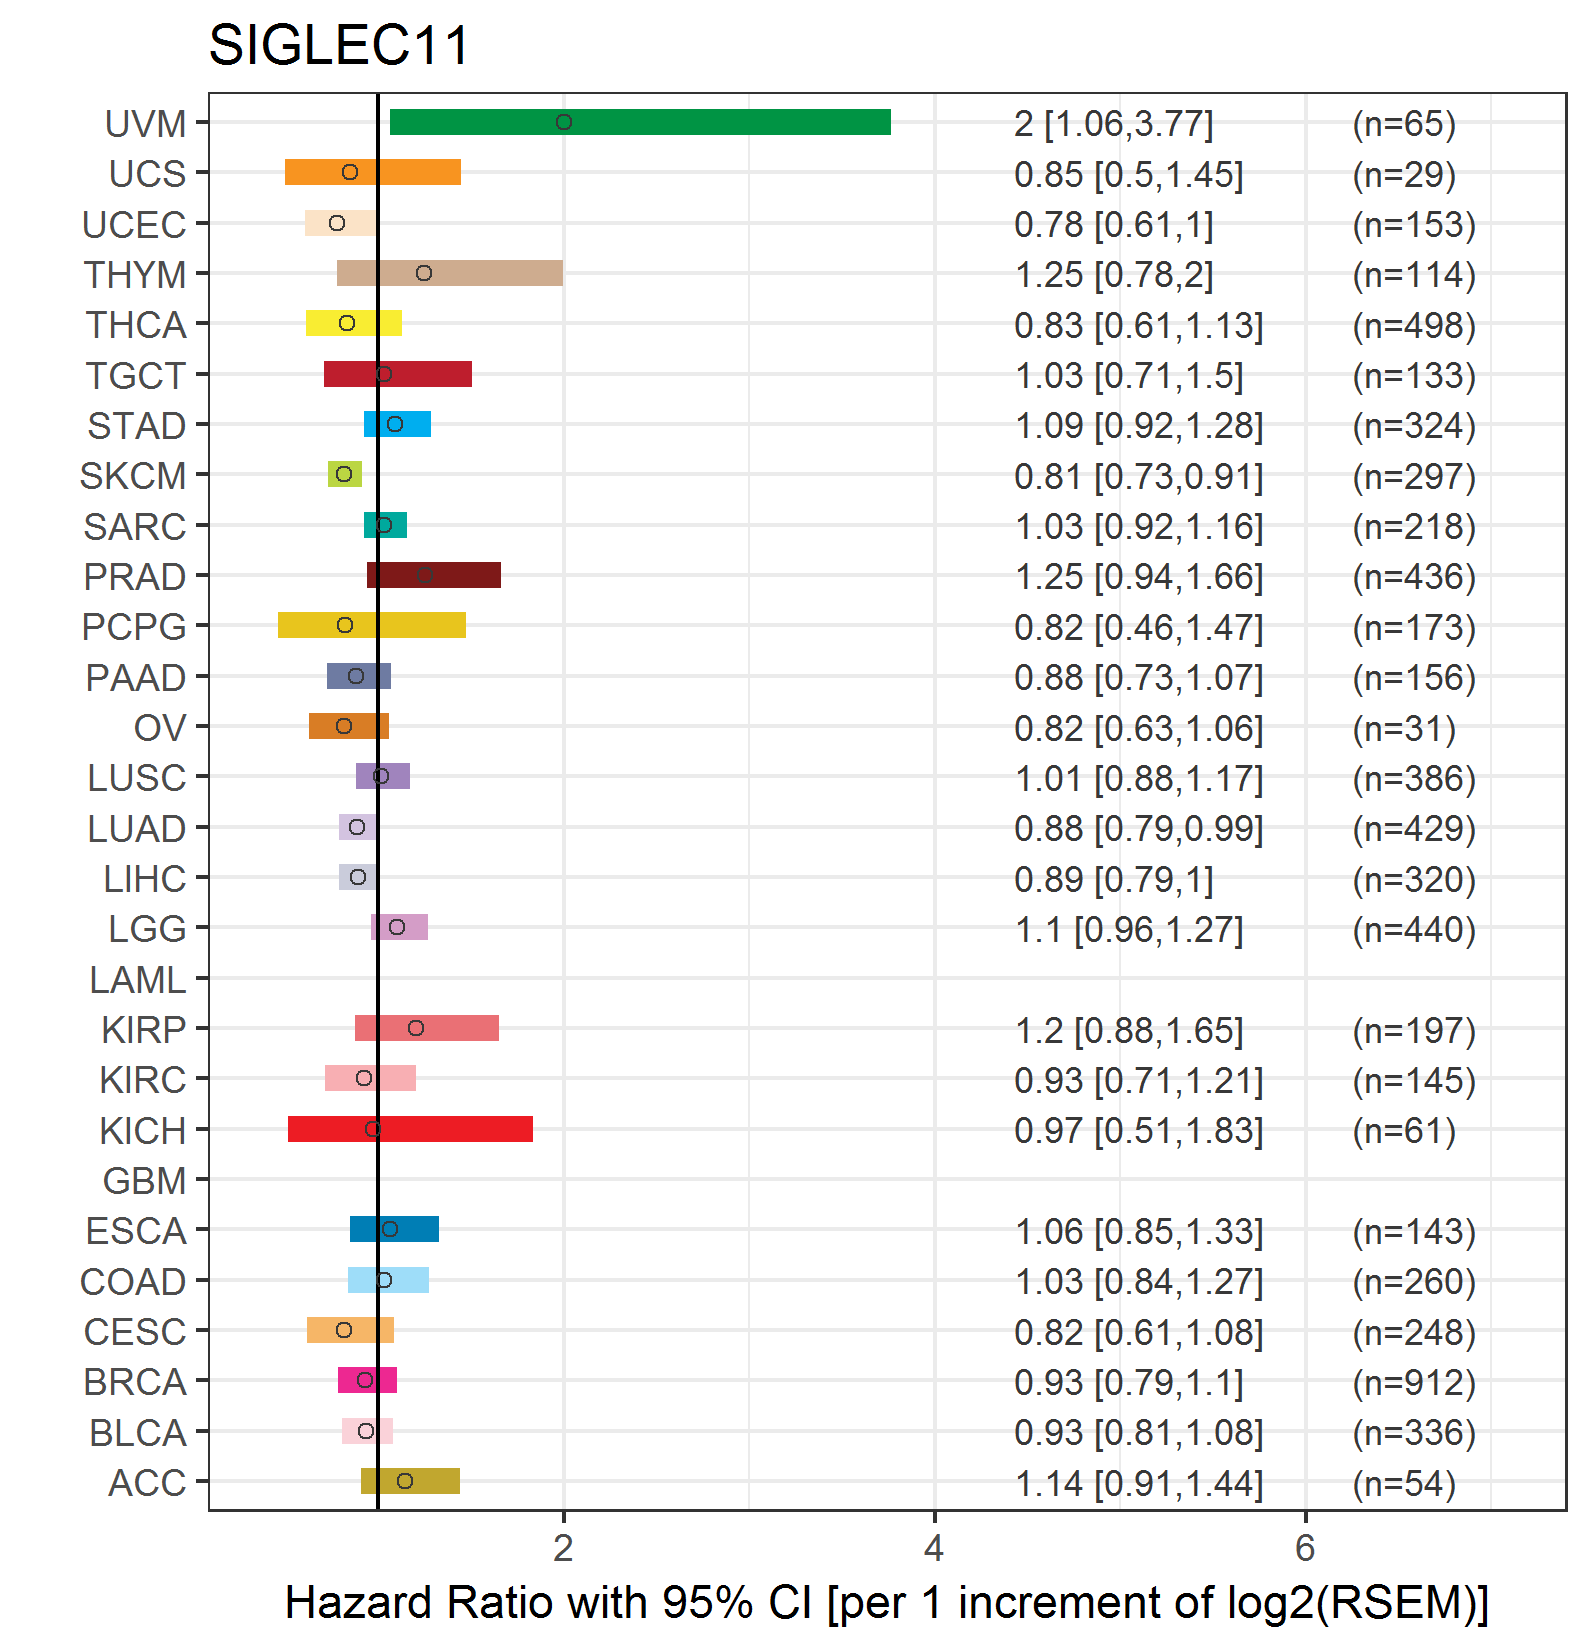
| Forest plot of Cox proportional hazard ratio (HR) and 95% CI of relapse free survival (RFS) using 28 cancer types (TCGA IlluminaHiSeq_RNASeqV2, pan-cancer normalized log2(norm_counts+1) data, version 2016-08-16) (TCGA clinicalMatrix, phenotype data, version 2016-04-27) * Click on the image enlarge it in a new window. |
 |
| Top |
| TissGeneClin for SIGLEC11 |
| TissGeneDrug for SIGLEC11 |
| Drug information targeting TissGene (DrugBank Version 5.0.6, 2017-04-01) |
| DrugBank ID | Drug name | Drug activity | Drug type | Drug status |
| Top |
| TissGeneDisease for SIGLEC11 |
| Disease information associated with TissGene (DisGeNet, 2016-06-01) |
| Disease ID | Disease name | # pubmeds | Source |
| umls:C0267112 | Acute gastric mucosal erosion | 1 | BeFree |
| umls:C2243088 | Idiopathic erosive/hemorrhagic gastritis | 1 | BeFree |
|
Copyright 2016-Present - The University of Texas Health Science Center at Houston (UTHealth) Web File Viewing | How to Report, Fraud, Waste and Abuse | State of Texas | Statewide Search | Texas Homeland Security | Site Policies |