 |
| |
| |
| |
| |
| |
| |
|

| TissGeneSummary for SLC22A9 |
 Gene summary Gene summary |
| Basic gene information | Gene symbol | SLC22A9 |
| Gene name | solute carrier family 22 (organic anion transporter), member 9 | |
| Synonyms | HOAT4|OAT4|OAT7|UST3H|ust3 | |
| Cytomap | UCSC genome browser: 11q13.1 | |
| Type of gene | protein-coding | |
| RefGenes | NM_080866.2, | |
| Description | organic anion transporter 4organic anion transporter 7solute carrier family 22 (organic anion/cation transporter), member 9solute carrier family 22 member 9 | |
| Modification date | 20141207 | |
| dbXrefs | MIM : 607579 | |
| HGNC : HGNC | ||
| Ensembl : ENSG00000149742 | ||
| HPRD : 06982 | ||
| Vega : OTTHUMG00000167805 | ||
| Protein | UniProt: go to UniProt's Cross Reference DB Table | |
| Expression | CleanEX: HS_SLC22A9 | |
| BioGPS: 114571 | ||
| Pathway | NCI Pathway Interaction Database: SLC22A9 | |
| KEGG: SLC22A9 | ||
| REACTOME: SLC22A9 | ||
| Pathway Commons: SLC22A9 | ||
| Context | iHOP: SLC22A9 | |
| ligand binding site mutation search in PubMed: SLC22A9 | ||
| UCL Cancer Institute: SLC22A9 | ||
| Assigned class in TissGDB* | C | |
| Included tissue-specific gene expression resources | HPA,GTEx | |
| Specific-tissues in normal samples (assigned by TissGDB using HPA, TiGER, and GTEx) | Liver | |
| Cancer types related to the specific-tissues in cancer samples (assigned by TissGDB using TCGA) | LIHC | |
| Reference showing the relevant tissue of SLC22A9 | ||
| Description by TissGene annotations | TissgsKTS CNV lost TissGeneKTS | |
| * Class A consists of genes with literature evidence and is part of the cTissGenes. Class B consists of only cTissGenes without additional evidence. The remaining genes belong to Class C. |
| Gene ontology having evidence of Inferred from Direct Assay (IDA) from Entrez |
| GO ID | GO term | PubMed ID | GO:0009914 | hormone transport | 17393504 | GO:0015913 | short-chain fatty acid import | 17393504 | GO:0043252 | sodium-independent organic anion transport | 17393504 | GO:0009914 | hormone transport | 17393504 | GO:0015913 | short-chain fatty acid import | 17393504 | GO:0043252 | sodium-independent organic anion transport | 17393504 |
| Top |
| TissGeneExp for SLC22A9 |
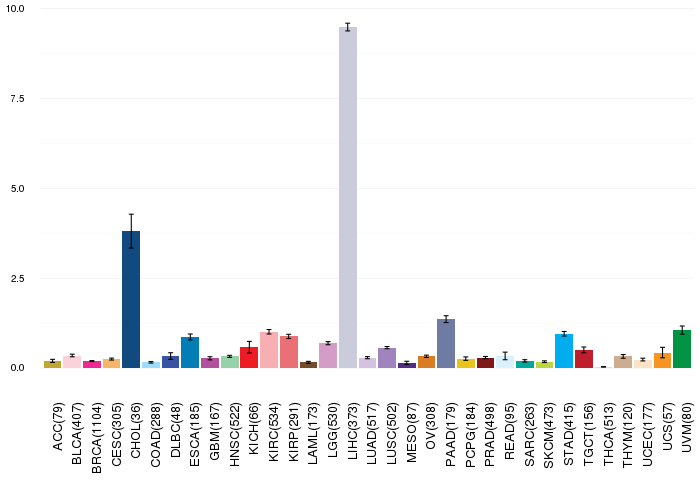
| Gene expressions across 28 cancer types (X-axis: cancer type and Y-axis: log2(norm_counts+1)) (TCGA IlluminaHiSeq_RNASeqV2, pan-cancer normalized log2(norm_counts+1) data, version 2016-08-16) |
 |
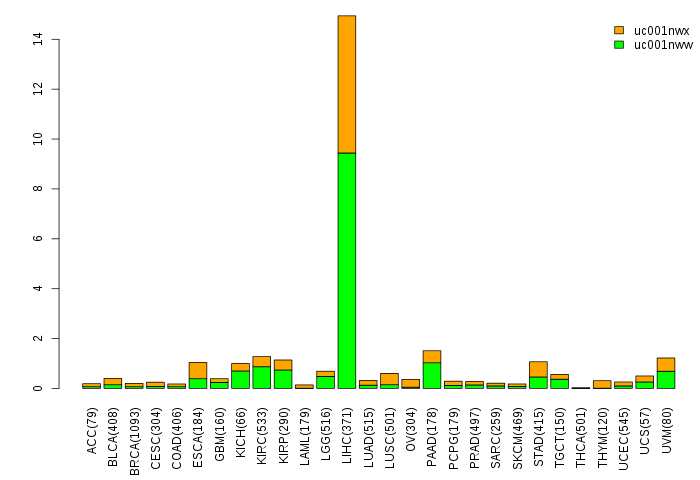
| Gene isoform expressions across 28 cancer types (X-axis: cancer type and Y-axis: log2(norm_counts+1)) (TCGA pan-cancer tcga_rsem_isoform_tpm, version 2016-09-01) |
 |
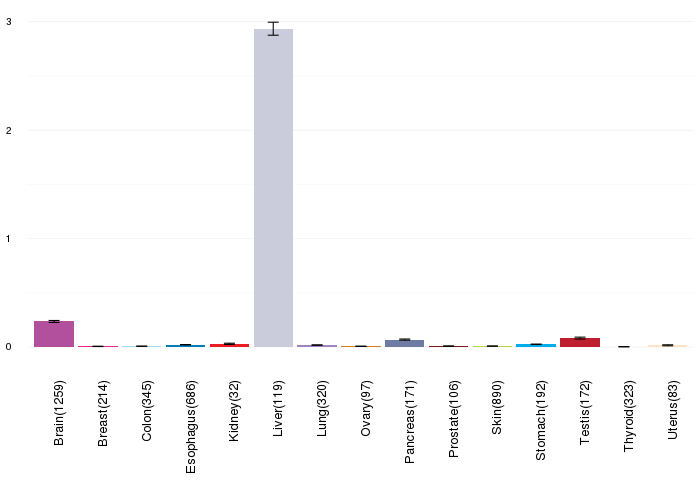
| Gene expressions across normal tissues of GTEx data (GTEx GTEx_Analysis_v6_RNA-seq_RNA-SeQCv1.1.8_gene_rpkm.gct) - Here, we shows the matched tissue types only among our 28 cancer types. |
 |
| Different expressions across 14 cancer types with more than 10 samples between matched tumors and normals (X-axis: cancer type and Y-axis: log2(norm_counts+1)) (TCGA IlluminaHiSeq_RNASeqV2, pan-cancer normalized log2(norm_counts+1) data, version 2016-08-16) |
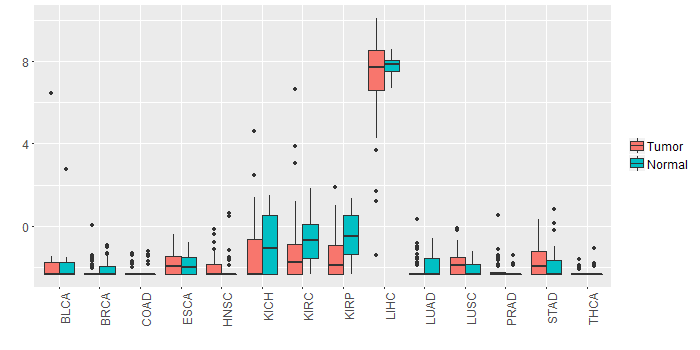 |
| - Significantly differentially expressed cancer types and information. (|Fold change|>1 and FDR<0.05) |
| Cancer type | Mean(exp) in tumor | Mean(exp) in matched normal | Log2FC | P-val. | FDR |
| KIRP | -1.409668748 | -0.401415623 | -1.008253125 | 0.00118 | 0.003198984 |
| Top |
| TissGene-miRNA for SLC22A9 |
| Significantly anti-correlated miRNAs of TissGene across 28 cancer types (Gene-miRNA relations from TargetScanHuman Relsease 7.1, Conserved_Site_Context_Scores.txt.zip, 06.01.2016) (TCGA IlluminaHiSeq_miRNASeq, log2(RPM+1) data, version 2016-11-21) (TCGA IlluminaHiSeq_RNASeqV2, log2(normalized_count+1) data, version 2016-08-16) (Spearman’s Rank Correlation (p-value<0.05 and coefficient<-0.25)) |
| Cancer type | miRNA id | miRNA accession | P-val. | Coeff. | # samples |
| Top |
| TissGeneMut for SLC22A9 |
| TissGeneSNV for SLC22A9 |
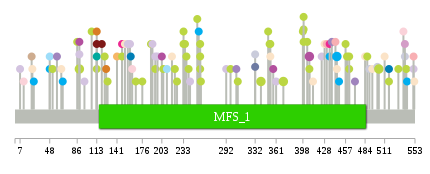
| nsSNV counts per each loci. Different colors of circles represent different cancer types. Circle size denotes number of samples. (TCGA somatic mutation (SNPs and small INDELs) data, version 2016-04-25) * Click on the image to enlarge it in a new window. |
 |
 |
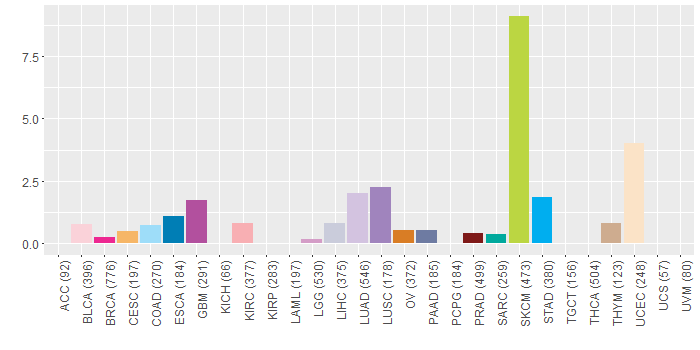
| Somatic nucleotide variants of TissGene across 28 cancer types (X-axis: cancer type and Y-axis: % of mutated samples) The numbers in parentheses are numbers of samples with mutation (nsSNVs). (TCGA somatic mutation (SNPs and small INDELs) data, version 2016-04-25) |
 |
| - nsSNVs sorted by frequency. |
| AAchange | Cancer type | # samples |
| p.H371Y | SKCM | 2 |
| p.G503R | SKCM | 2 |
| p.R407Q | GBM | 2 |
| p.A445V | STAD | 2 |
| p.E340K | SKCM | 2 |
| p.R89C | SKCM | 2 |
| p.P240S | SKCM | 1 |
| p.S128* | SKCM | 1 |
| p.G233R | SKCM | 1 |
| p.K542Q | STAD | 1 |
| p.H52Y | SKCM | 1 |
| p.F23S | THYM | 1 |
| p.R435H | STAD | 1 |
| p.M113I | SKCM | 1 |
| p.P428S | UCEC | 1 |
| p.R256* | SKCM | 1 |
| p.Q332P | LIHC | 1 |
| p.L448P | STAD | 1 |
| p.W190* | LUAD | 1 |
| p.M113I | OV | 1 |
| p.R256X | SKCM | 1 |
| p.I424T | LUAD | 1 |
| p.S306T | LUSC | 1 |
| p.L205S | SKCM | 1 |
| p.P292Q | LUAD | 1 |
| p.M113I | PRAD | 1 |
| p.N361K | LUAD | 1 |
| p.A445V | UCEC | 1 |
| p.R539S | LIHC | 1 |
| p.G457E | SKCM | 1 |
| p.W399X | SKCM | 1 |
| p.Q332K | PAAD | 1 |
| p.M404I | SKCM | 1 |
| p.P194H | LUAD | 1 |
| p.M470V | LUSC | 1 |
| p.T217N | UCEC | 1 |
| p.S494Y | UCEC | 1 |
| p.G242S | LUAD | 1 |
| p.P541S | SKCM | 1 |
| p.W224* | SKCM | 1 |
| p.M431I | KIRC | 1 |
| p.T357M | GBM | 1 |
| p.F152L | UCEC | 1 |
| p.G160V | ESCA | 1 |
| p.R407Q | SKCM | 1 |
| p.S167L | SKCM | 1 |
| p.L7V | LUAD | 1 |
| p.T58S | LUSC | 1 |
| p.I501V | LIHC | 1 |
| p.E459K | SKCM | 1 |
| p.R435H | BRCA | 1 |
| p.A484T | UCEC | 1 |
| p.A254P | STAD | 1 |
| p.P398L | SKCM | 1 |
| p.P517L | SKCM | 1 |
| p.L443X | KIRC | 1 |
| p.R203C | GBM | 1 |
| p.D537H | BLCA | 1 |
| p.L24I | UCEC | 1 |
| p.S141F | CESC | 1 |
| p.A210V | COAD | 1 |
| p.M113I | SARC | 1 |
| p.L162P | BLCA | 1 |
| p.F511V | UCEC | 1 |
| p.L412I | UCEC | 1 |
| p.L353F | UCEC | 1 |
| p.W399L | SKCM | 1 |
| p.T64A | UCEC | 1 |
| p.G197S | LUAD | 1 |
| p.R48C | COAD | 1 |
| p.E298K | SKCM | 1 |
| p.I26S | STAD | 1 |
| p.W499C | READ | 1 |
| p.W399* | SKCM | 1 |
| p.R539K | LGG | 1 |
| p.T551A | KIRC | 1 |
| p.L490P | LIHC | 1 |
| p.L176F | SKCM | 1 |
| p.L353F | SKCM | 1 |
| p.L221F | SKCM | 1 |
| p.W120C | PRAD | 1 |
| p.P188S | SKCM | 1 |
| p.I125V | HNSC | 1 |
| p.P517L | ESCA | 1 |
| p.S126T | OV | 1 |
| p.R89C | LUAD | 1 |
| p.R350K | SKCM | 1 |
| p.R124K | SKCM | 1 |
| p.R48H | STAD | 1 |
| p.E86K | SKCM | 1 |
| p.G233E | SKCM | 1 |
| p.P462L | SKCM | 1 |
| p.D257N | SKCM | 1 |
| p.P462S | SKCM | 1 |
| p.Q69H | HNSC | 1 |
| p.S352F | SKCM | 1 |
| p.Q552* | UCEC | 1 |
| p.D530N | SKCM | 1 |
| p.L24I | DLBC | 1 |
| p.P106L | SKCM | 1 |
| p.R89C | GBM | 1 |
| p.M487I | SKCM | 1 |
| p.M308I | SKCM | 1 |
| p.G159R | LUAD | 1 |
| p.A66V | STAD | 1 |
| p.L438M | LUSC | 1 |
| p.A148T | BRCA | 1 |
| p.A252V | SKCM | 1 |
| p.M156L | LUAD | 1 |
| p.P194S | SKCM | 1 |
| p.W96C | LUAD | 1 |
| p.A148T | SKCM | 1 |
| p.G237E | SKCM | 1 |
| p.D12N | BLCA | 1 |
| p.T551M | LUAD | 1 |
| p.R256Q | SKCM | 1 |
| p.H235Y | SKCM | 1 |
| Top |
| TissGeneCNV for SLC22A9 |
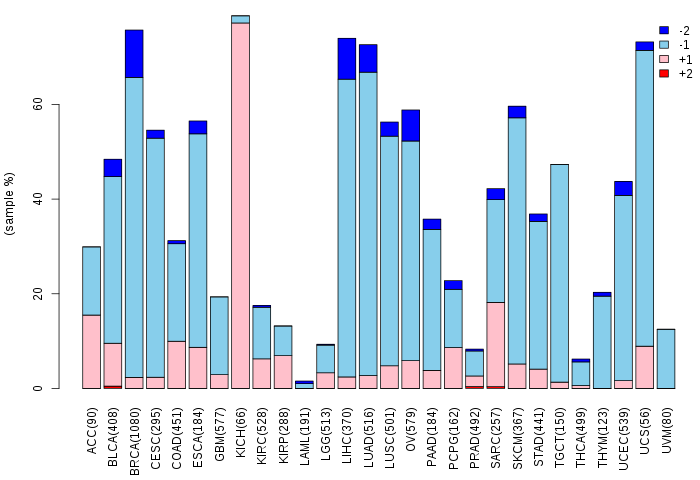
| Copy number variations of TissGene across 28 cancer types (X-axis: cancer type and Y-axis: % of CNV samples) (TCGA Gistic2_CopyNumber_Gistic2_all_data_by_genes, Gistic2 copy number data, version 2016-08-16) |
 |
| Top |
| TissGeneFusions for SLC22A9 |
| Fusion genes including TissGene (ChimerDB 3.0, 2016-12-01 and TCGA fusion Portal 2015-12-01) |
| Database | Src | Cancer type | Sample | Fusion gene | ORF | 5'-gene BP | 3'-gene BP |
| Top |
| TissGeneNet for SLC22A9 |
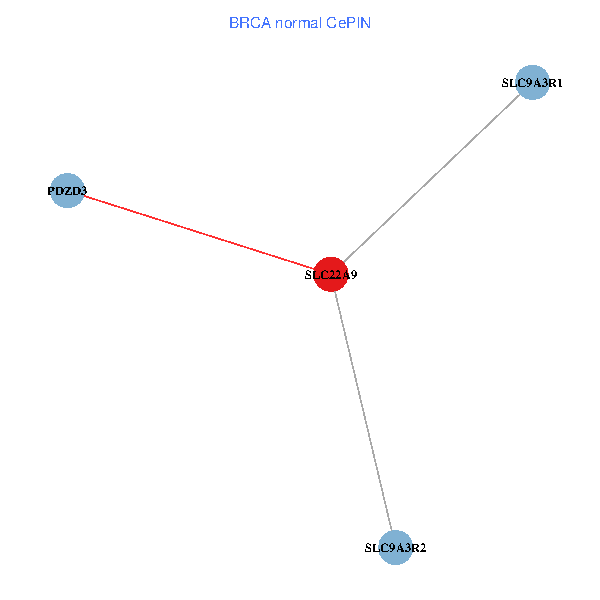
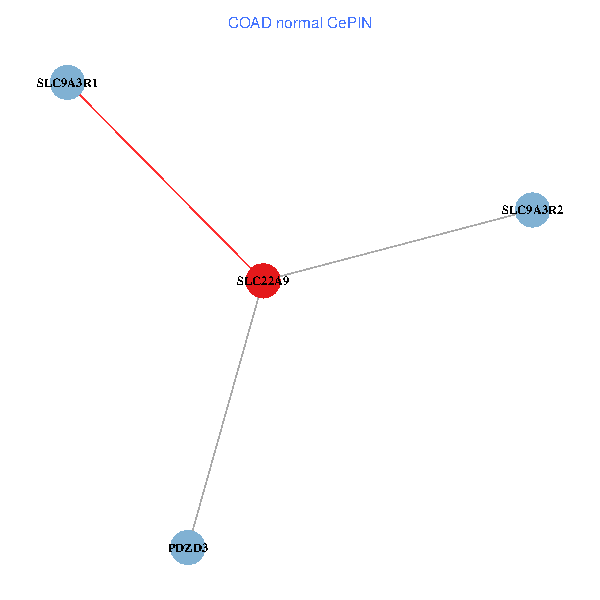
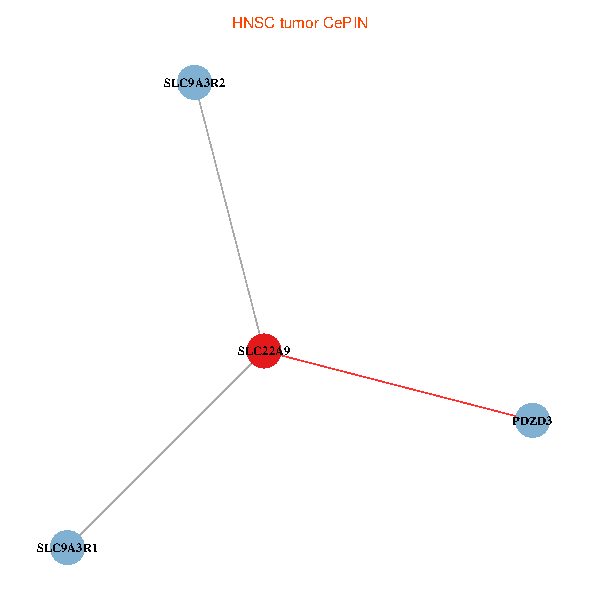
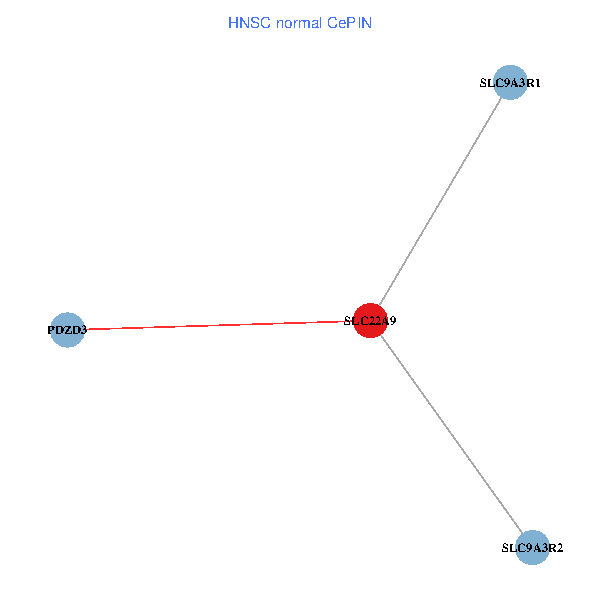
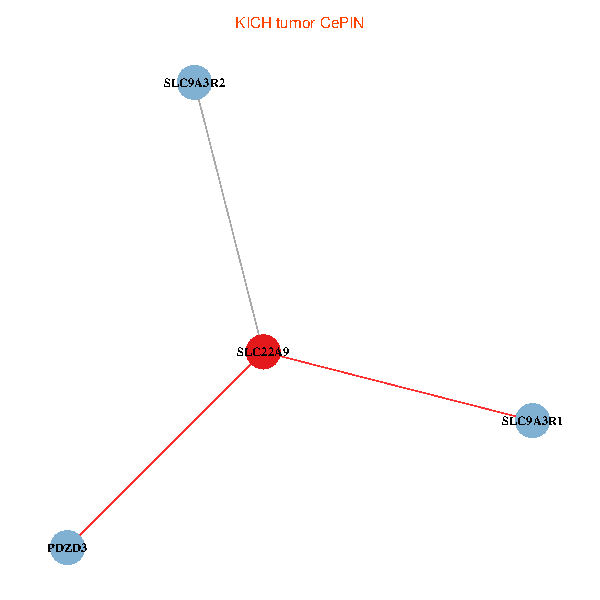
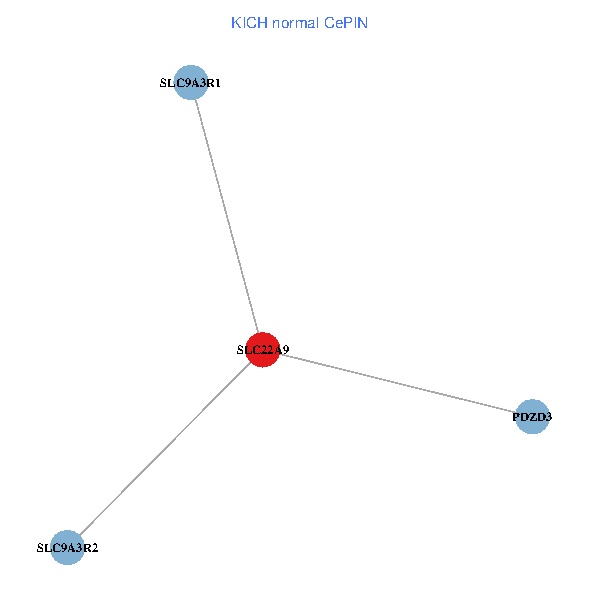
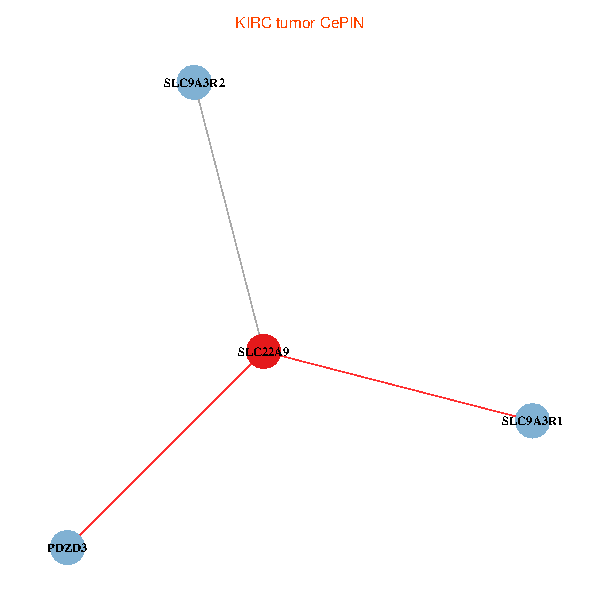
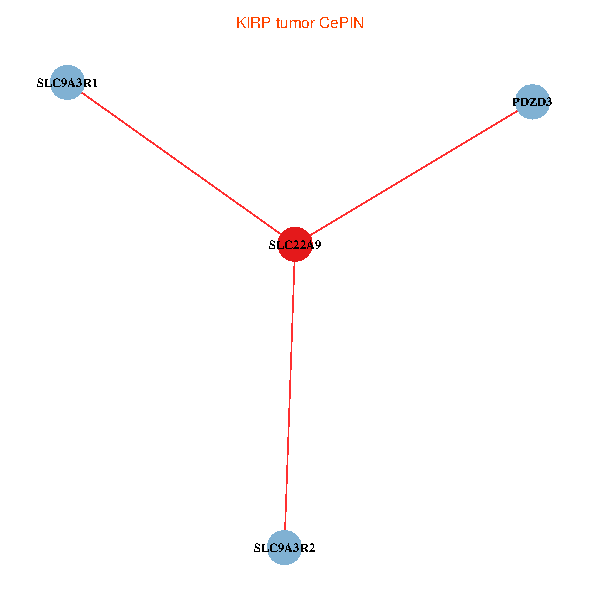
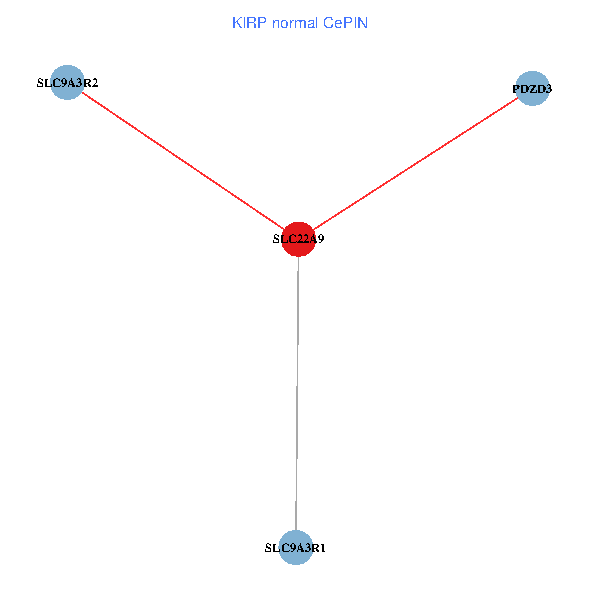
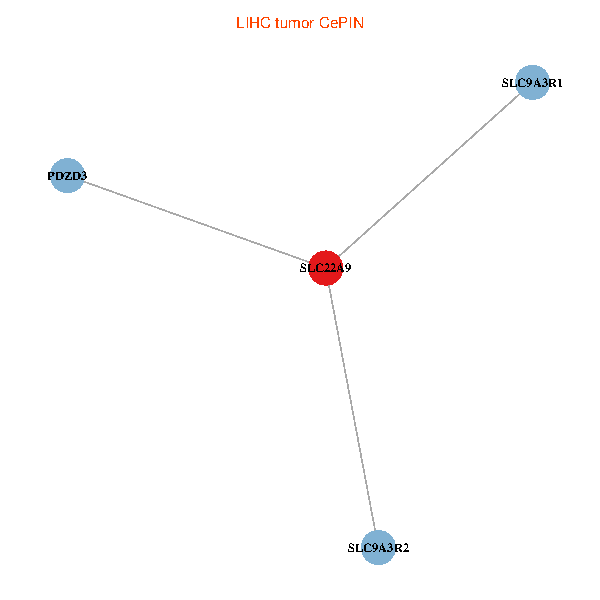
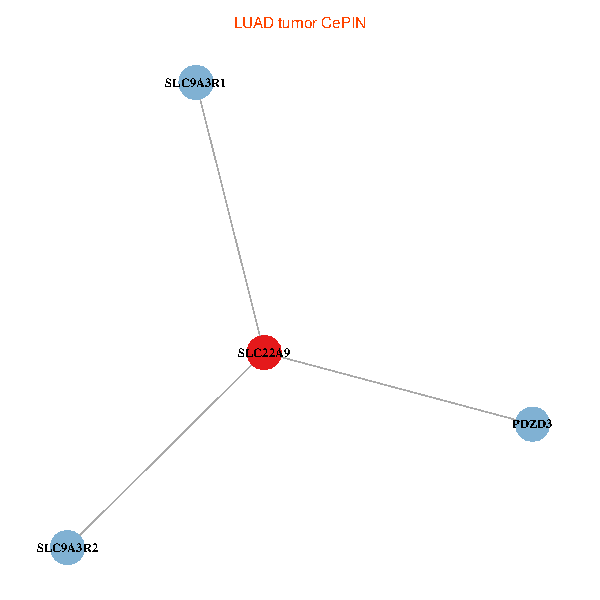
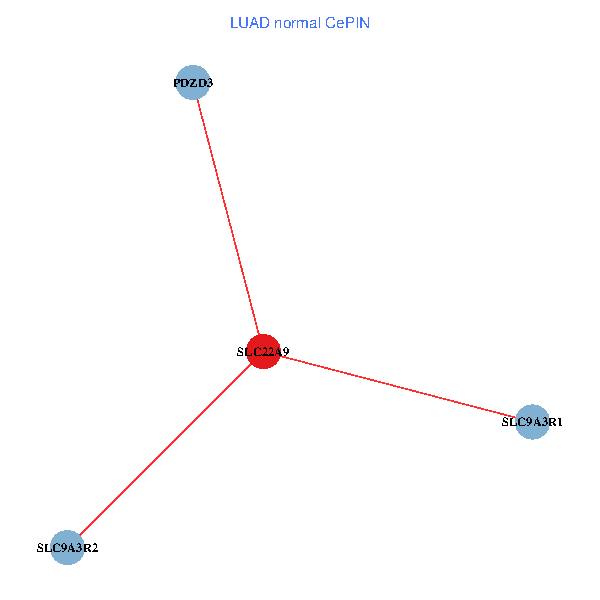
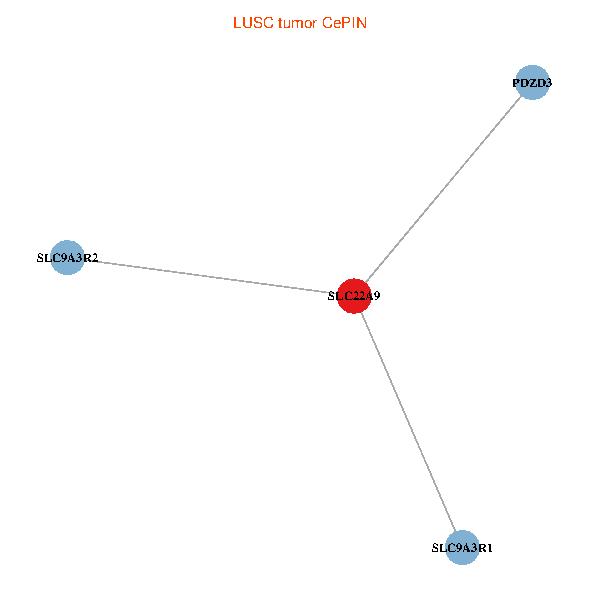
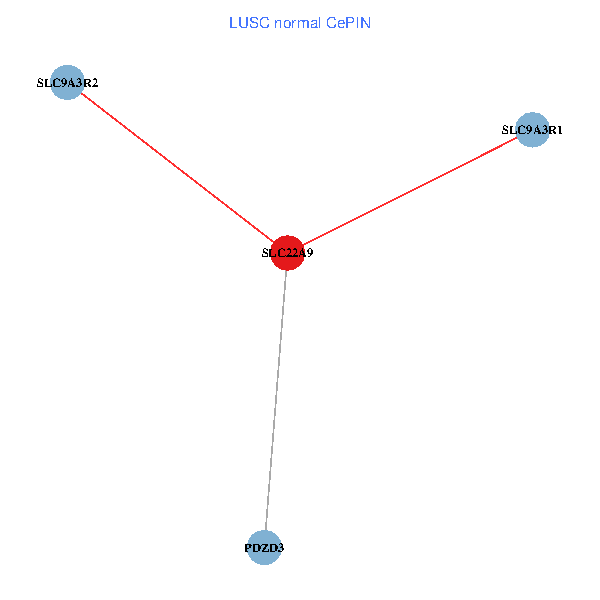
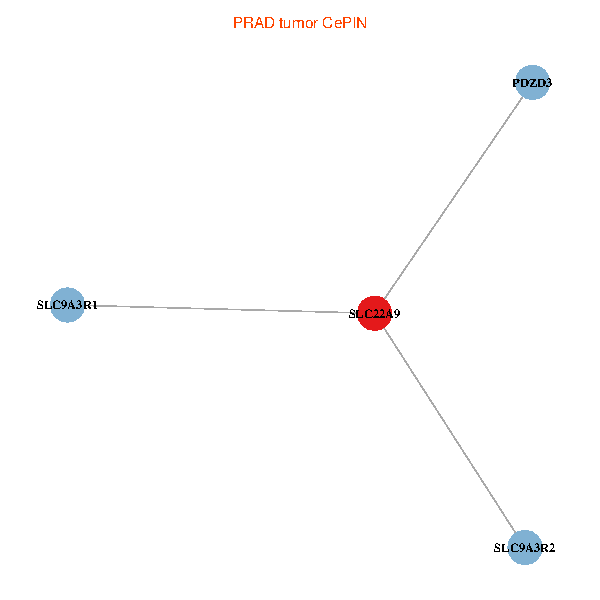
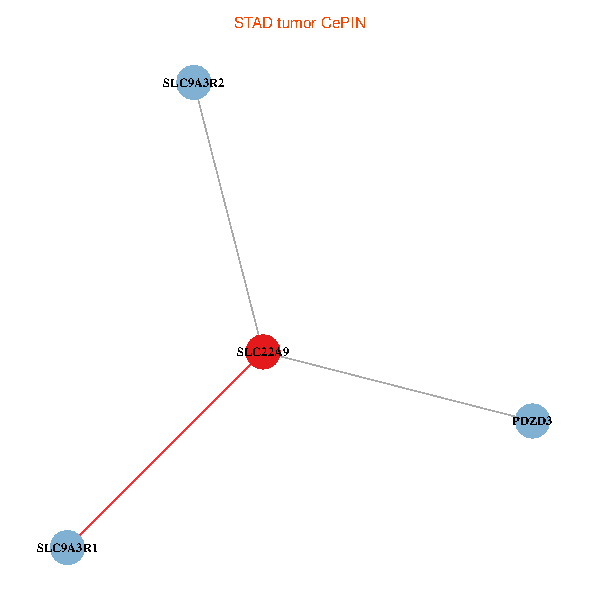
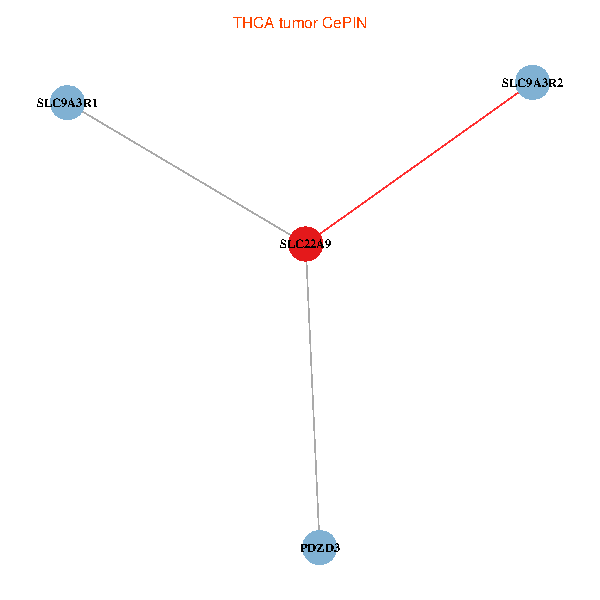
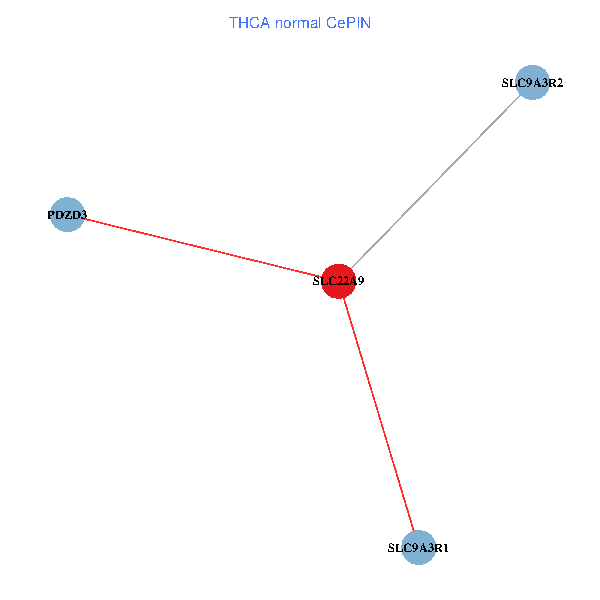
| Co-expressed gene networks based on protein-protein interaction data (CePIN) (TCGA IlluminaHiSeq_RNASeqV2, pan-cancer normalized log2(norm_counts+1) data, version 2016-08-16) (PINA2 ppi data) |
| BRCA (tumor) | BRCA (normal) |
| SLC22A9, SLC9A3R1, PDZD3, SLC9A3R2 (tumor) | SLC22A9, SLC9A3R1, PDZD3, SLC9A3R2 (normal) |
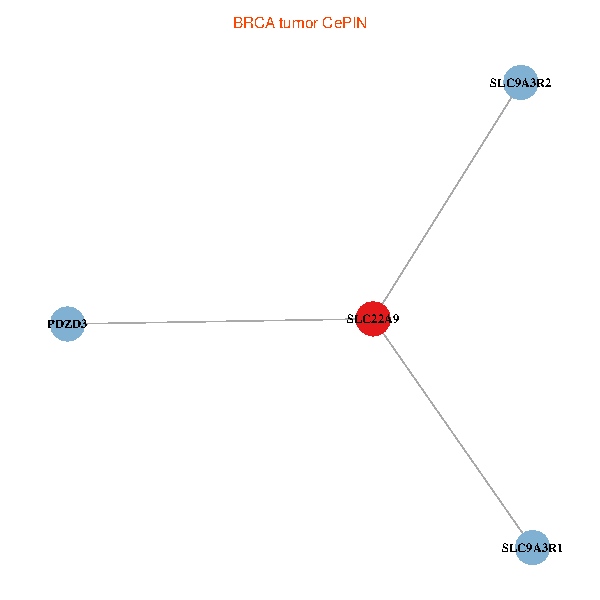 |  |
| COAD (tumor) | COAD (normal) |
| SLC22A9, SLC9A3R1, PDZD3, SLC9A3R2 (tumor) | SLC22A9, SLC9A3R1, PDZD3, SLC9A3R2 (normal) |
 |  |
| HNSC (tumor) | HNSC (normal) |
| SLC22A9, SLC9A3R1, PDZD3, SLC9A3R2 (tumor) | SLC22A9, SLC9A3R1, PDZD3, SLC9A3R2 (normal) |
 |  |
| KICH (tumor) | KICH (normal) |
| SLC22A9, SLC9A3R1, PDZD3, SLC9A3R2 (tumor) | SLC22A9, SLC9A3R1, PDZD3, SLC9A3R2 (normal) |
 |  |
| KIRC (tumor) | KIRC (normal) |
| SLC22A9, SLC9A3R1, PDZD3, SLC9A3R2 (tumor) | SLC22A9, SLC9A3R1, PDZD3, SLC9A3R2 (normal) |
 |  |
| KIRP (tumor) | KIRP (normal) |
| SLC22A9, SLC9A3R1, PDZD3, SLC9A3R2 (tumor) | SLC22A9, SLC9A3R1, PDZD3, SLC9A3R2 (normal) |
 |  |
| LIHC (tumor) | LIHC (normal) |
| SLC22A9, SLC9A3R1, PDZD3, SLC9A3R2 (tumor) | SLC22A9, SLC9A3R1, PDZD3, SLC9A3R2 (normal) |
 |  |
| LUAD (tumor) | LUAD (normal) |
| SLC22A9, SLC9A3R1, PDZD3, SLC9A3R2 (tumor) | SLC22A9, SLC9A3R1, PDZD3, SLC9A3R2 (normal) |
 |  |
| LUSC (tumor) | LUSC (normal) |
| SLC22A9, SLC9A3R1, PDZD3, SLC9A3R2 (tumor) | SLC22A9, SLC9A3R1, PDZD3, SLC9A3R2 (normal) |
 |  |
| PRAD (tumor) | PRAD (normal) |
| SLC22A9, SLC9A3R1, PDZD3, SLC9A3R2 (tumor) | SLC22A9, SLC9A3R1, PDZD3, SLC9A3R2 (normal) |
 |  |
| STAD (tumor) | STAD (normal) |
| SLC22A9, SLC9A3R1, PDZD3, SLC9A3R2 (tumor) | SLC22A9, SLC9A3R1, PDZD3, SLC9A3R2 (normal) |
 |  |
| THCA (tumor) | THCA (normal) |
| SLC22A9, SLC9A3R1, PDZD3, SLC9A3R2 (tumor) | SLC22A9, SLC9A3R1, PDZD3, SLC9A3R2 (normal) |
 |  |
| Top |
| TissGeneProg for SLC22A9 |
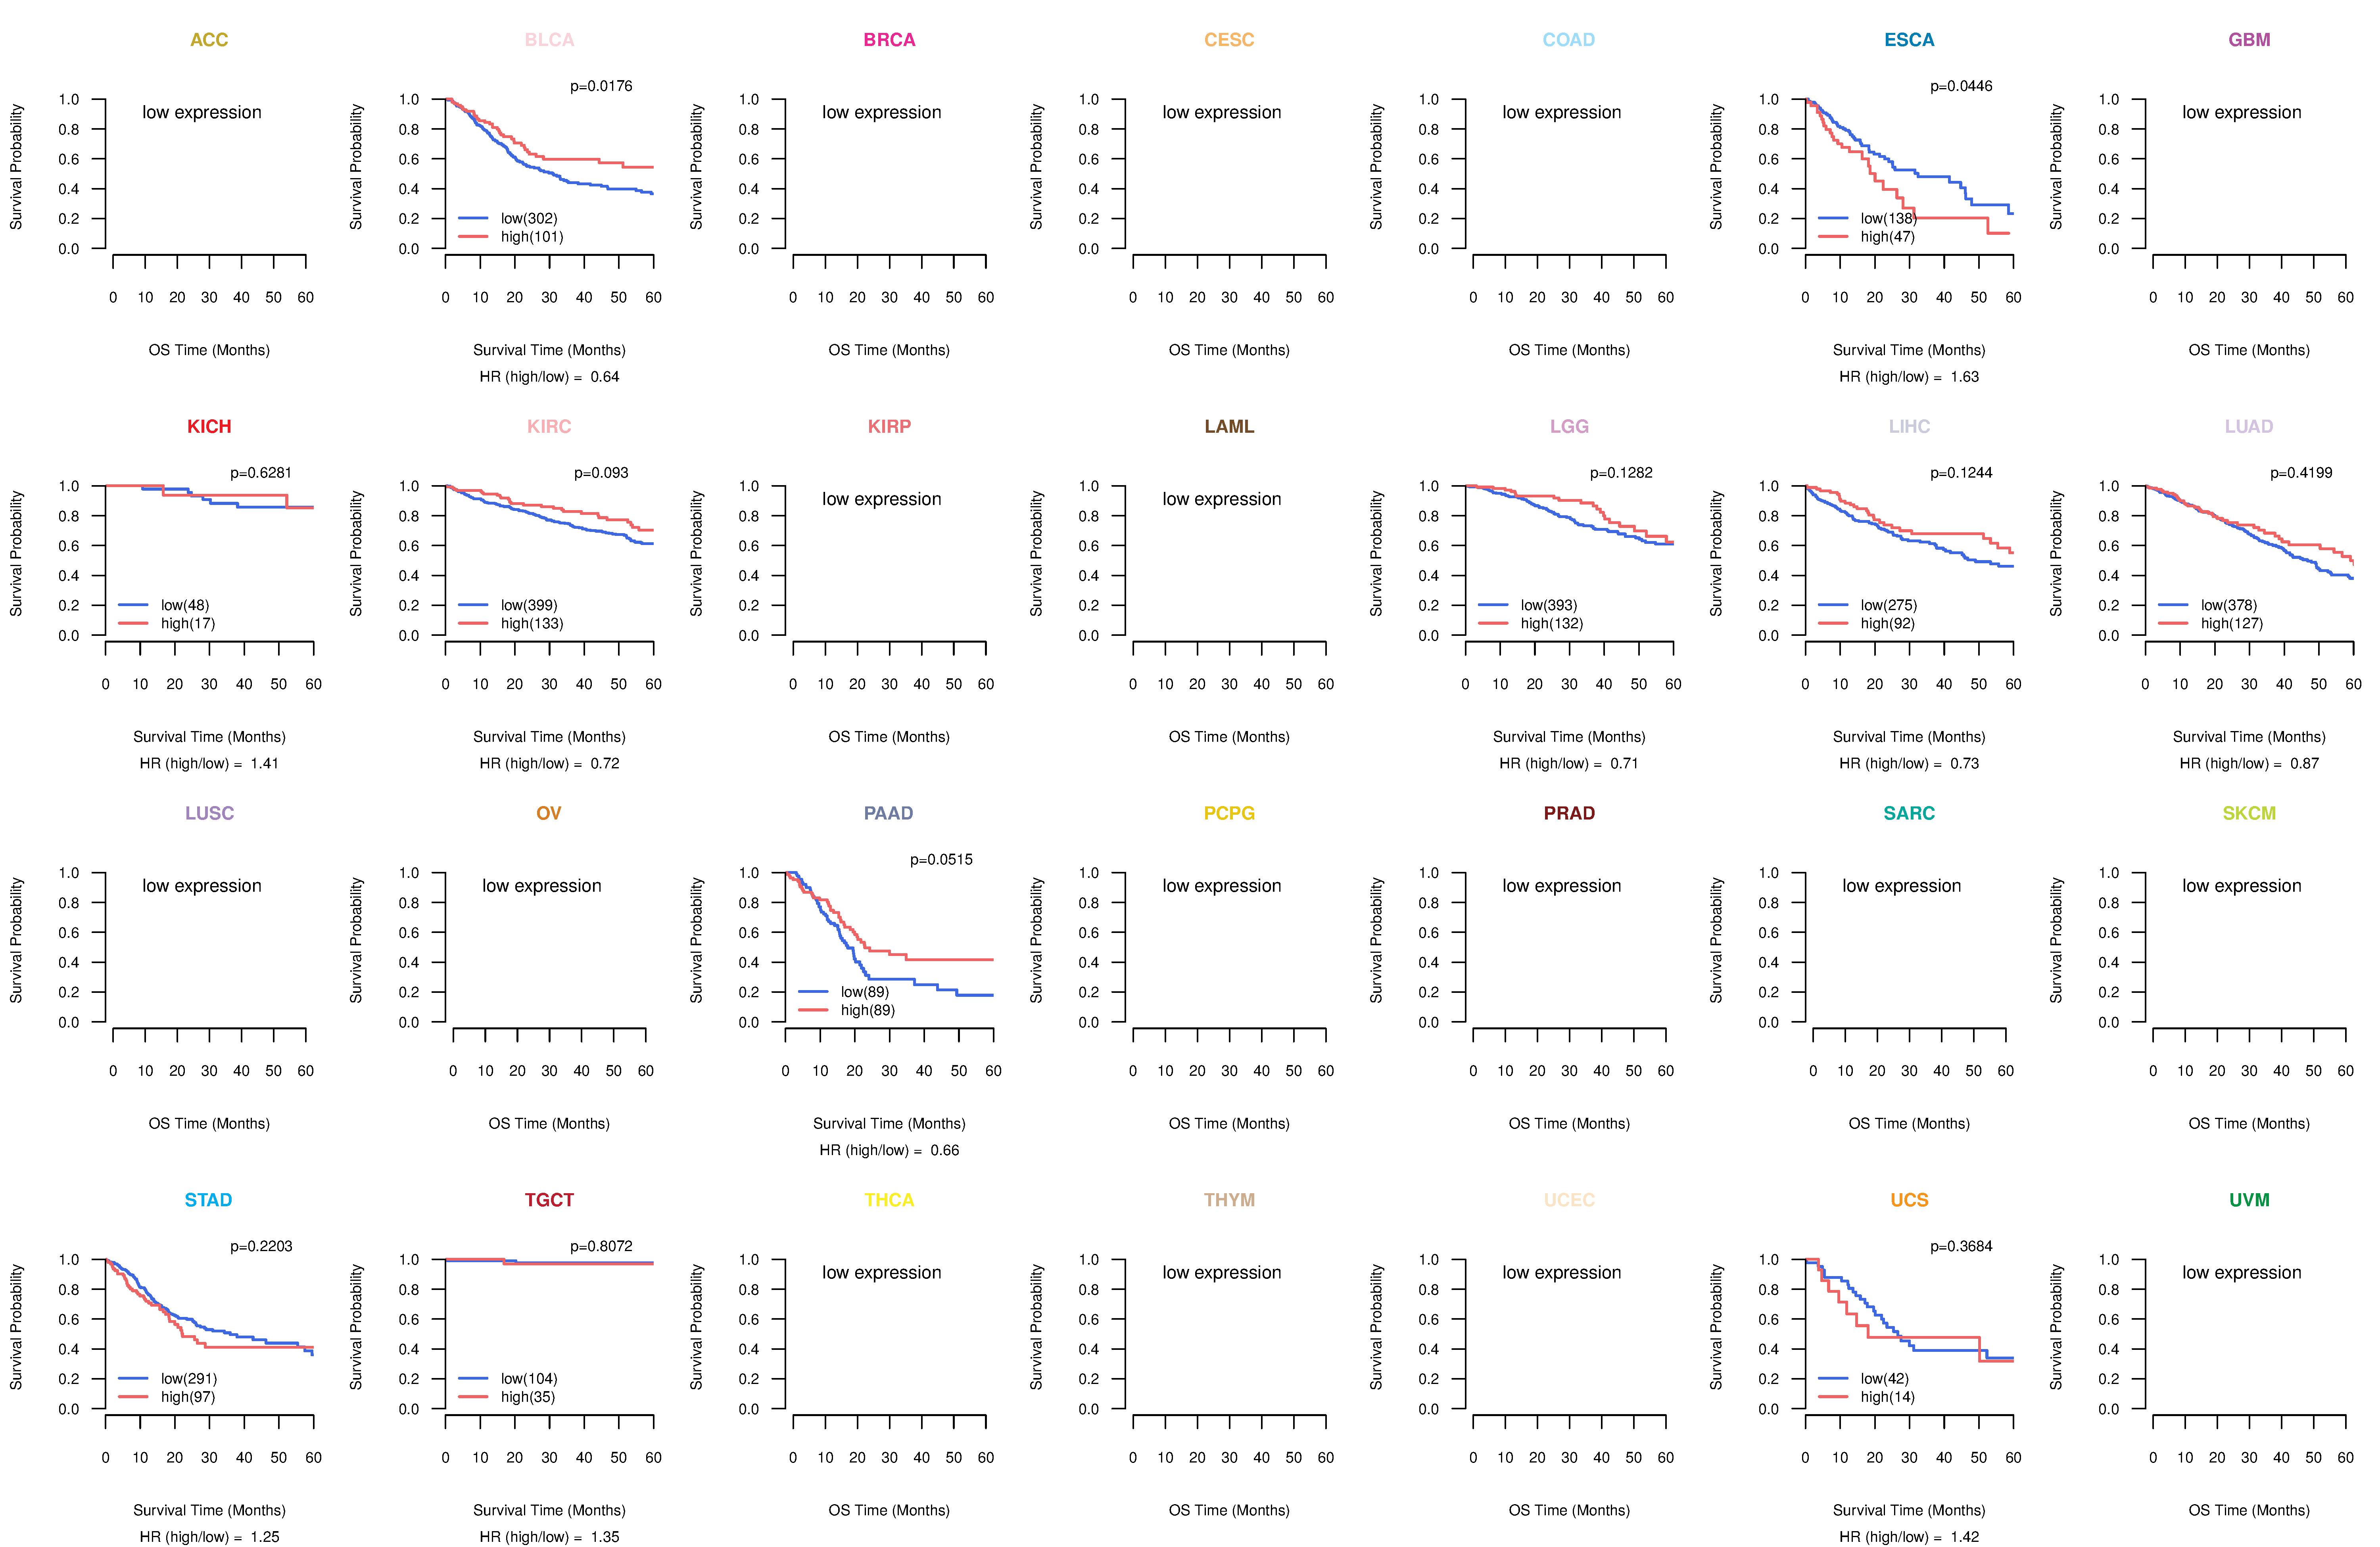
| Kaplan-Meier plots with logrank tests of overall survival (OS) using 28 cancer types (TCGA IlluminaHiSeq_RNASeqV2, pan-cancer normalized log2(norm_counts+1) data, version 2016-08-16) (TCGA clinicalMatrix, phenotype data, version 2016-04-27) * Click on the image to enlarge it in a new window. |
 |
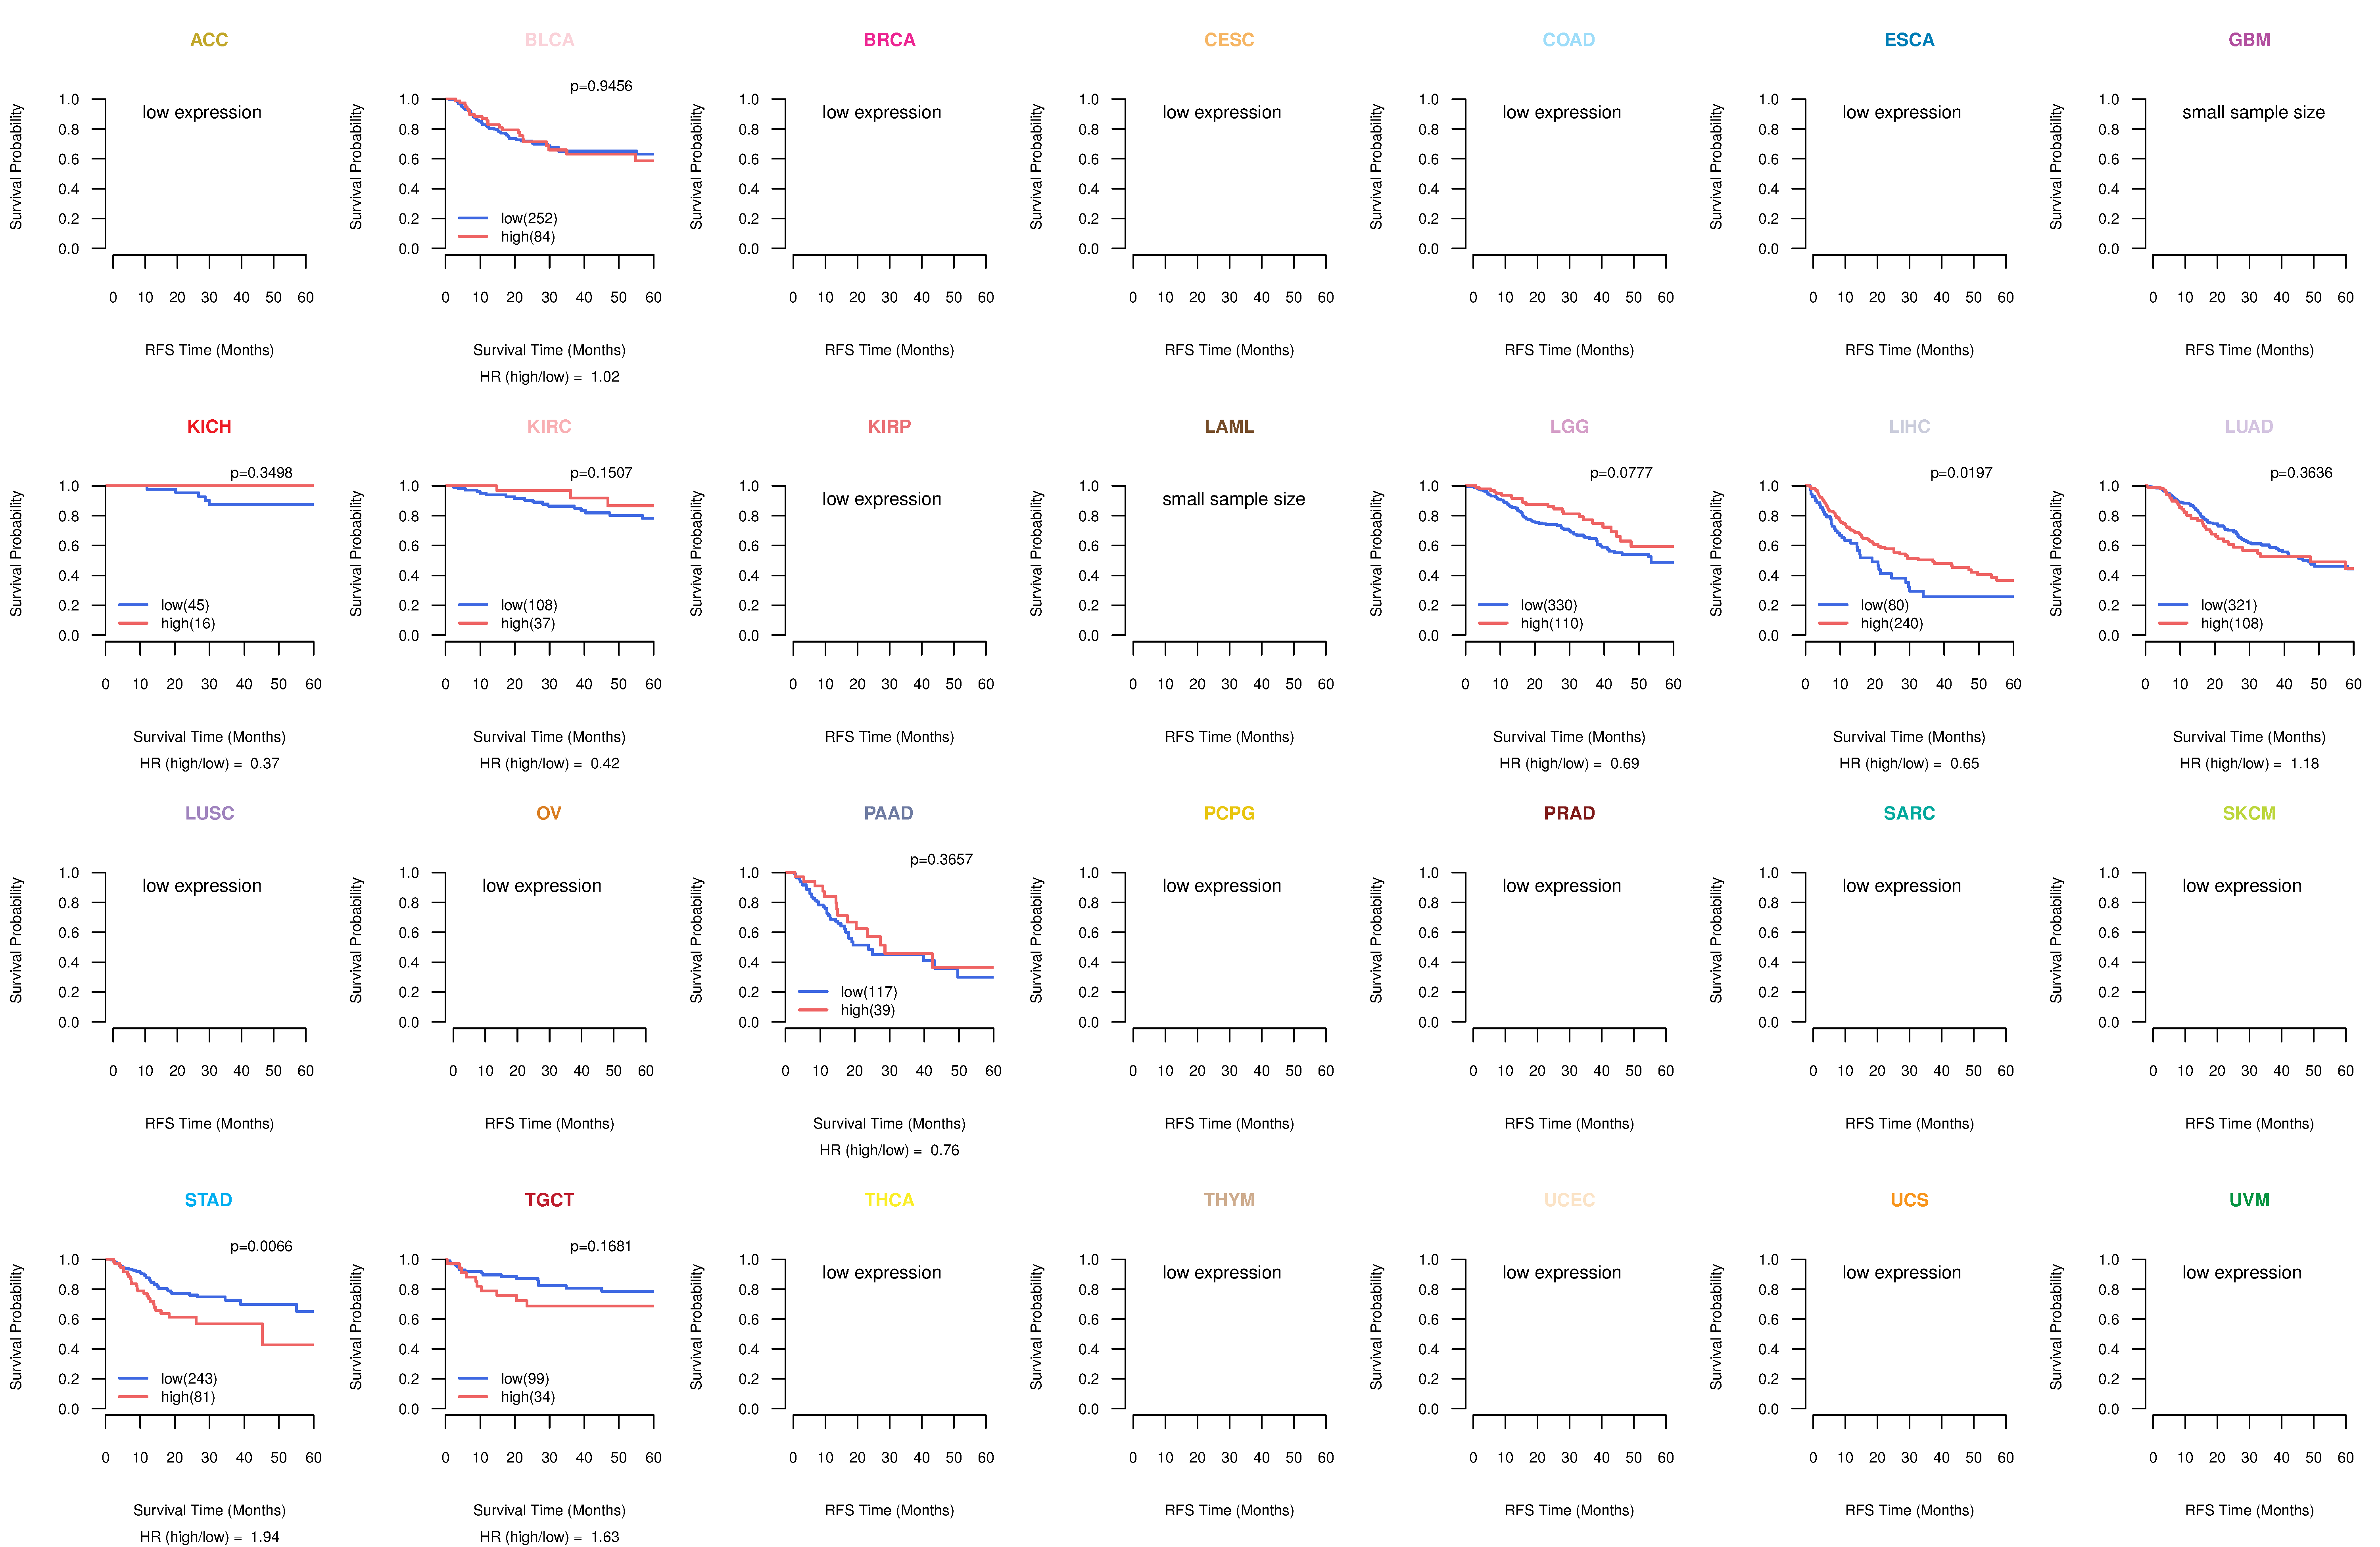
| Kaplan-Meier plots with logrank test of relapse free survival (RFS) using 28 cancer types (TCGA IlluminaHiSeq_RNASeqV2, pan-cancer normalized log2(norm_counts+1) data, version 2016-08-16) (TCGA clinicalMatrix, phenotype data, version 2016-04-27) * Click on the image enlarge it in a new window. |
 |
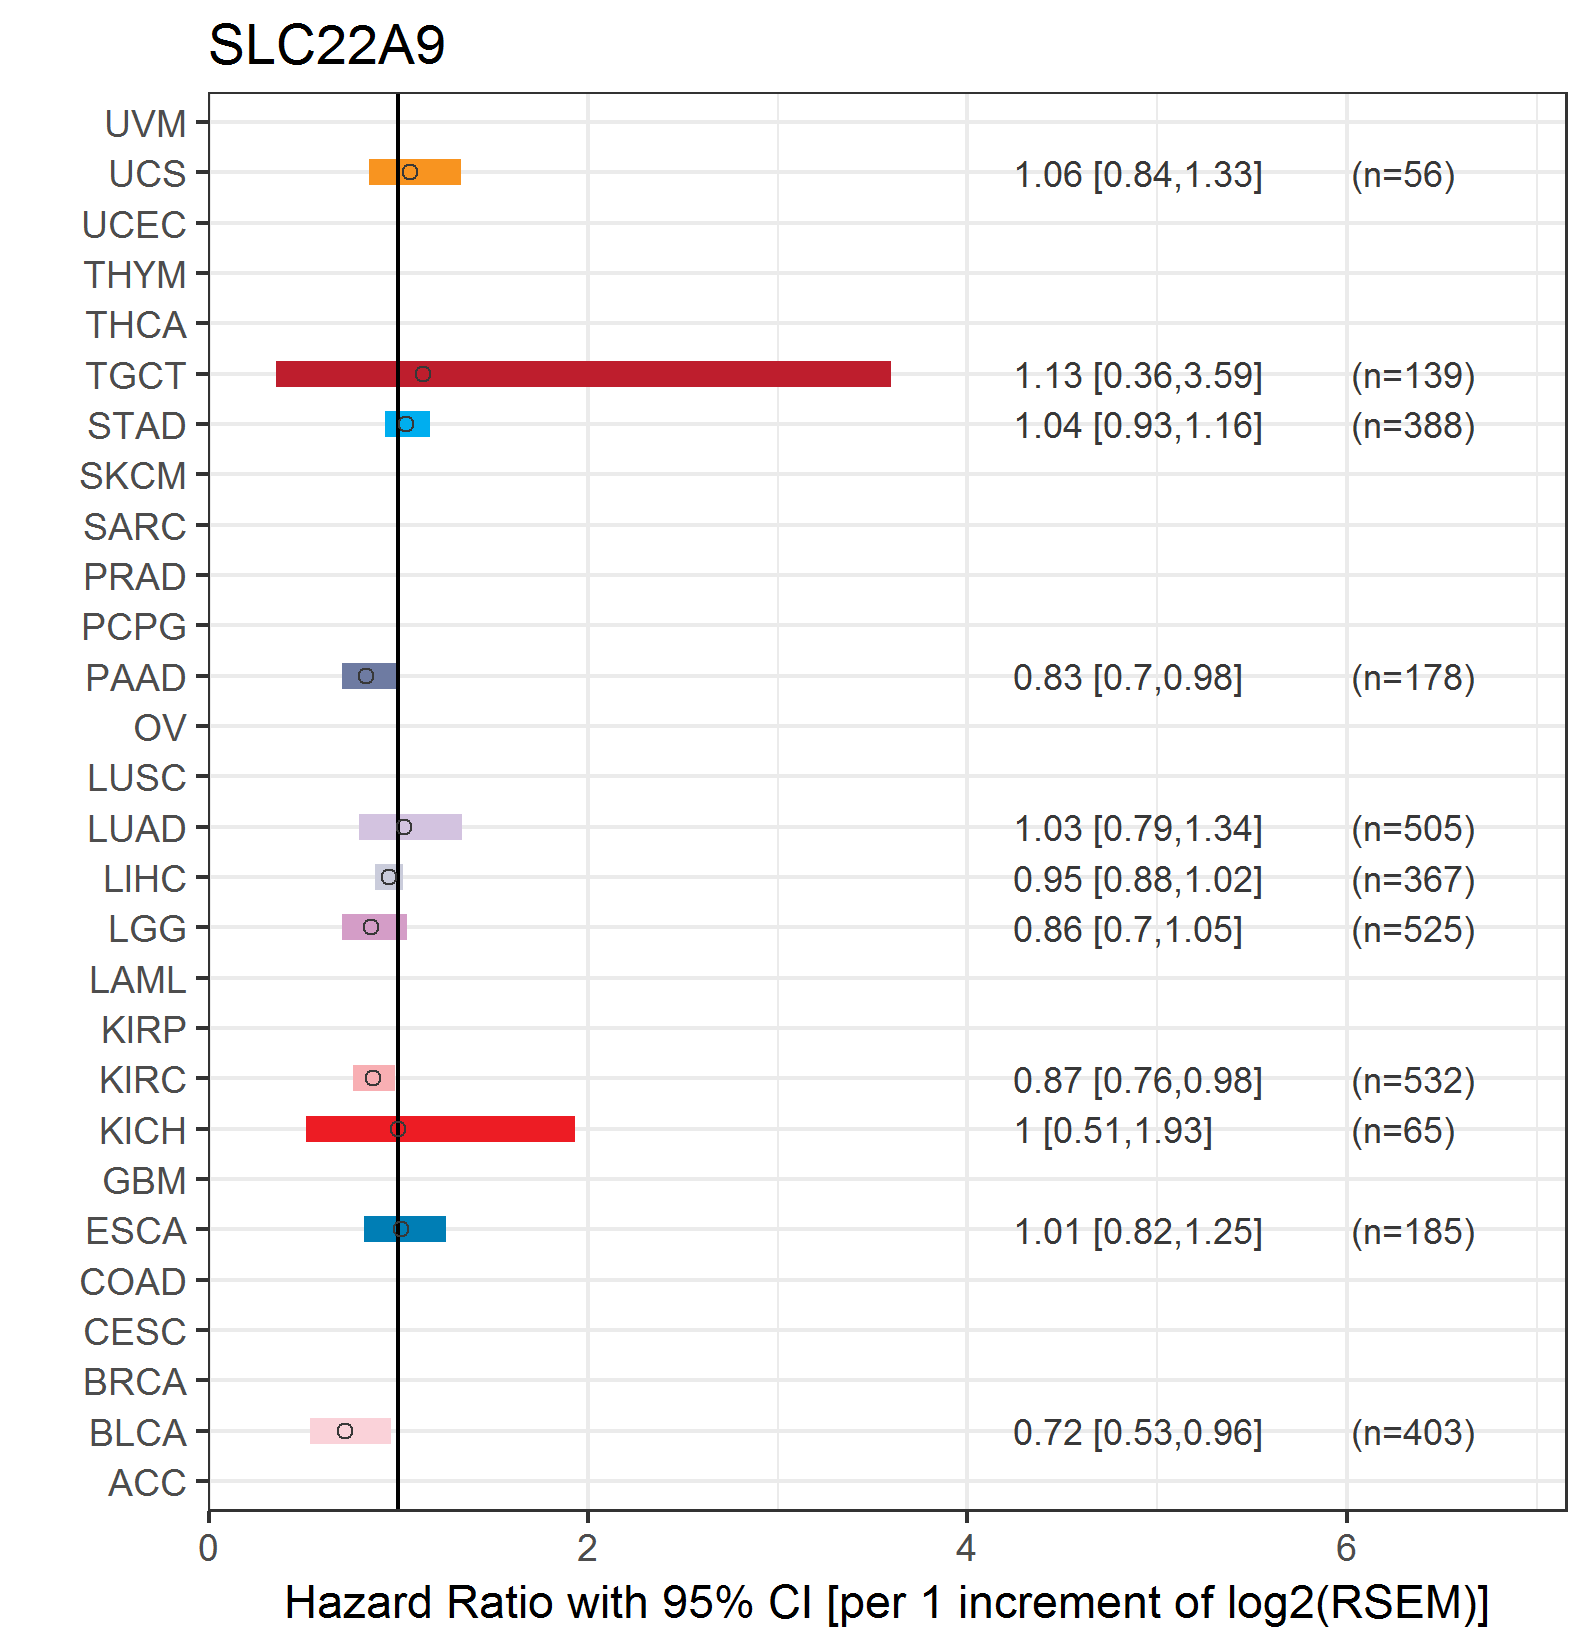
| Forest plot of Cox proportional hazard ratio (HR) and 95% CI of overall survival (OS) using 28 cancer types (TCGA IlluminaHiSeq_RNASeqV2, pan-cancer normalized log2(norm_counts+1) data, version 2016-08-16) (TCGA clinicalMatrix, phenotype data, version 2016-04-27) * Click on the image enlarge it in a new window. |
 |
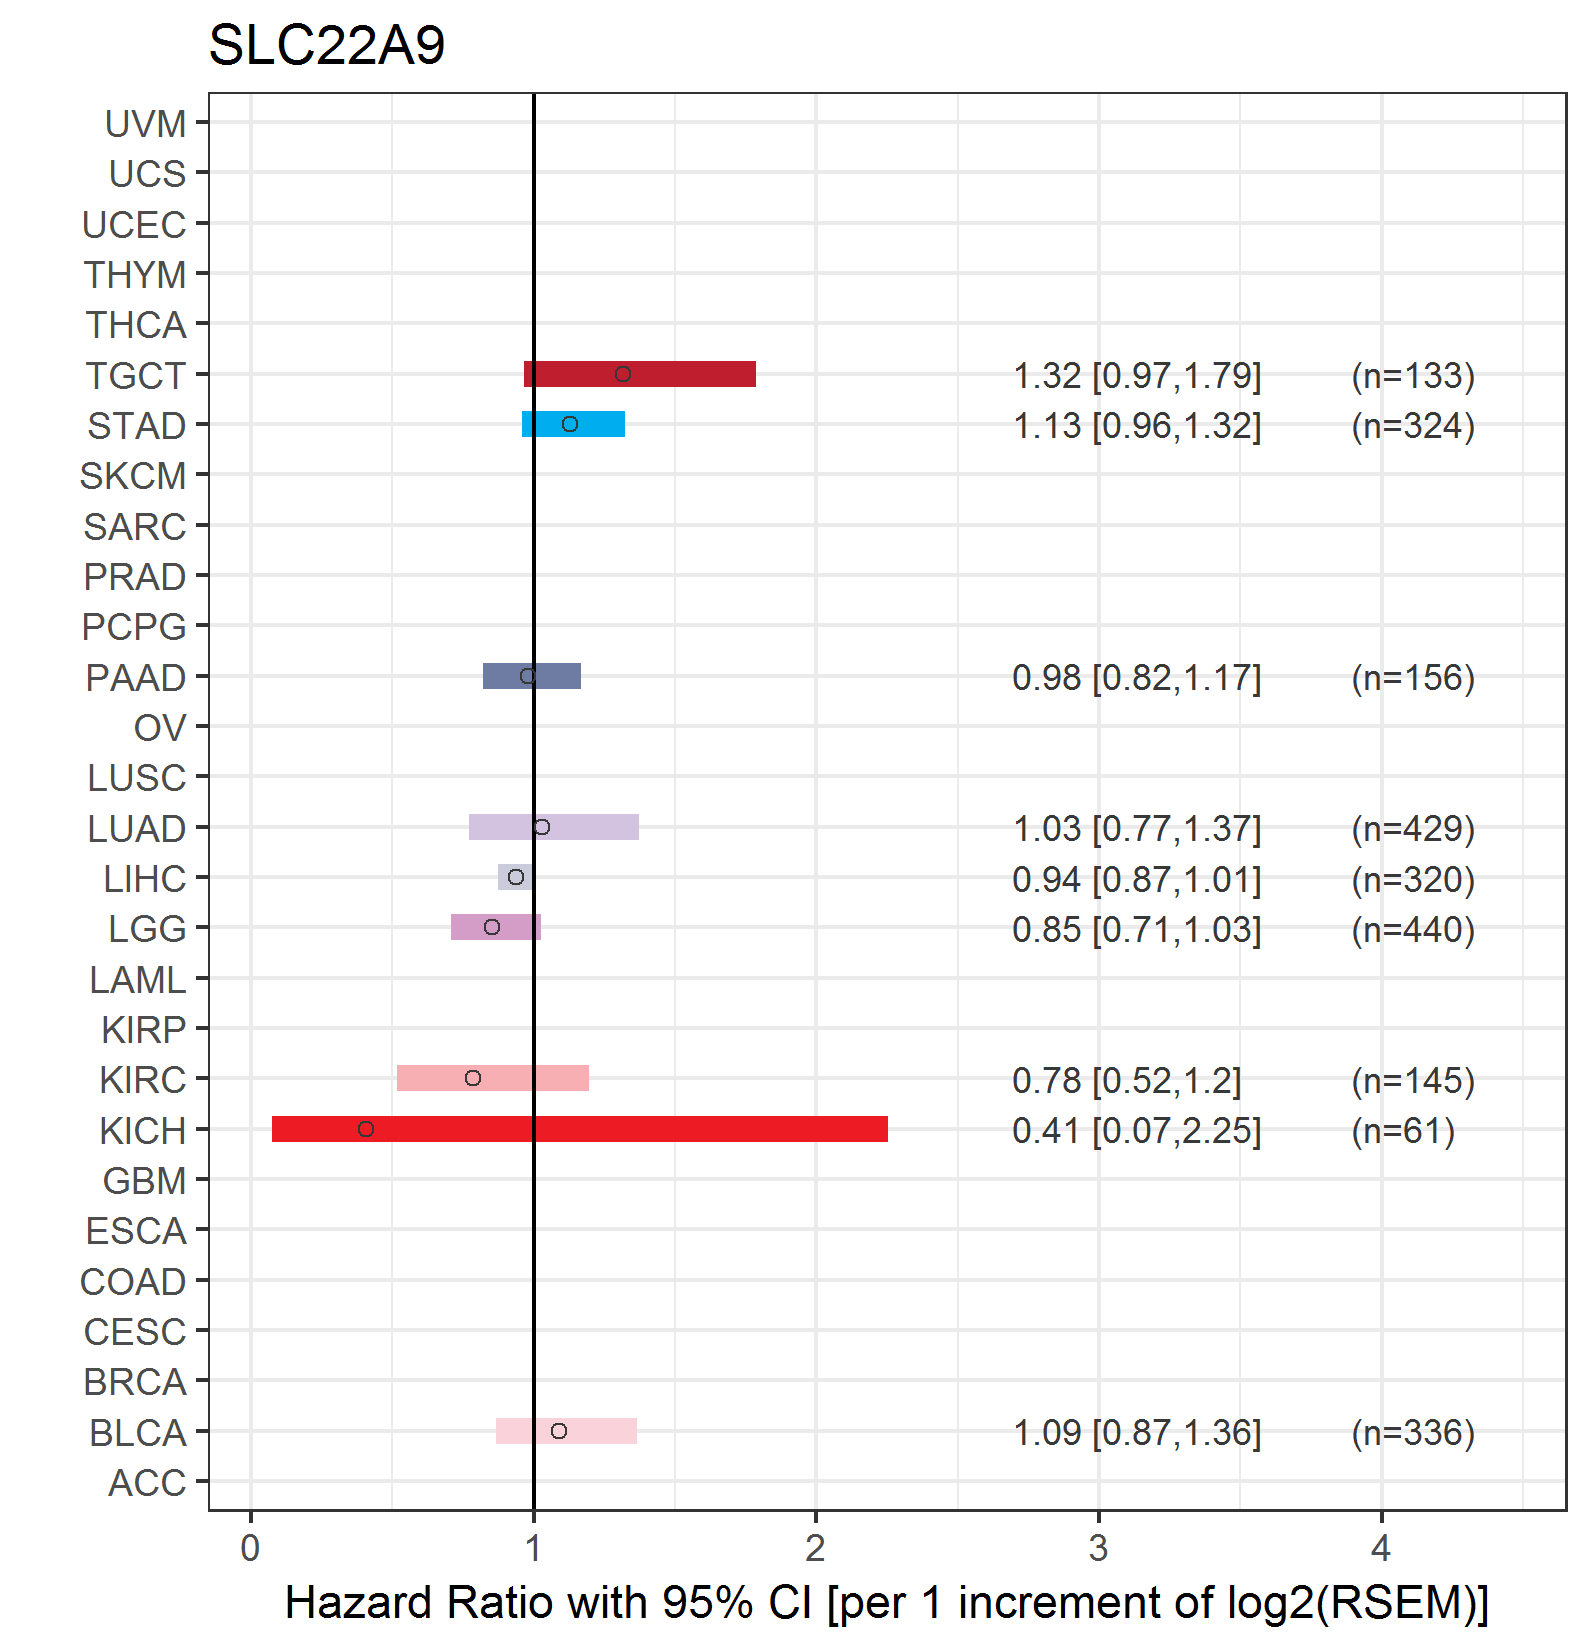
| Forest plot of Cox proportional hazard ratio (HR) and 95% CI of relapse free survival (RFS) using 28 cancer types (TCGA IlluminaHiSeq_RNASeqV2, pan-cancer normalized log2(norm_counts+1) data, version 2016-08-16) (TCGA clinicalMatrix, phenotype data, version 2016-04-27) * Click on the image enlarge it in a new window. |
 |
| Top |
| TissGeneClin for SLC22A9 |
| TissGeneDrug for SLC22A9 |
| Drug information targeting TissGene (DrugBank Version 5.0.6, 2017-04-01) |
| DrugBank ID | Drug name | Drug activity | Drug type | Drug status |
| Top |
| TissGeneDisease for SLC22A9 |
| Disease information associated with TissGene (DisGeNet, 2016-06-01) |
| Disease ID | Disease name | # pubmeds | Source |
| umls:C0040336 | Tobacco Use Disorder | 1 | GAD |
| umls:C0149896 | Primary gout | 1 | BeFree |
|
Copyright 2016-Present - The University of Texas Health Science Center at Houston (UTHealth) Web File Viewing | How to Report, Fraud, Waste and Abuse | State of Texas | Statewide Search | Texas Homeland Security | Site Policies |