 |
| |
| |
| |
| |
| |
| |
|

| TissGeneSummary for SLC26A9 |
 Gene summary Gene summary |
| Basic gene information | Gene symbol | SLC26A9 |
| Gene name | solute carrier family 26 (anion exchanger), member 9 | |
| Synonyms | - | |
| Cytomap | UCSC genome browser: 1q32.1 | |
| Type of gene | protein-coding | |
| RefGenes | NM_052934.3, NM_134325.2,NM_001142600.1, | |
| Description | anion transporter/exchanger protein 9anion transporter/exchanger-9solute carrier family 26 member 9solute carrier family 26, member 9 | |
| Modification date | 20141207 | |
| dbXrefs | MIM : 608481 | |
| HGNC : HGNC | ||
| Ensembl : ENSG00000174502 | ||
| HPRD : 12242 | ||
| Vega : OTTHUMG00000036001 | ||
| Protein | UniProt: go to UniProt's Cross Reference DB Table | |
| Expression | CleanEX: HS_SLC26A9 | |
| BioGPS: 115019 | ||
| Pathway | NCI Pathway Interaction Database: SLC26A9 | |
| KEGG: SLC26A9 | ||
| REACTOME: SLC26A9 | ||
| Pathway Commons: SLC26A9 | ||
| Context | iHOP: SLC26A9 | |
| ligand binding site mutation search in PubMed: SLC26A9 | ||
| UCL Cancer Institute: SLC26A9 | ||
| Assigned class in TissGDB* | C | |
| Included tissue-specific gene expression resources | TiGER,GTEx | |
| Specific-tissues in normal samples (assigned by TissGDB using HPA, TiGER, and GTEx) | PancreasStomach | |
| Cancer types related to the specific-tissues in cancer samples (assigned by TissGDB using TCGA) | PAADSTAD | |
| Reference showing the relevant tissue of SLC26A9 | ||
| Description by TissGene annotations | Have significant anti-correlated miRNA Fused withOncogene | |
| * Class A consists of genes with literature evidence and is part of the cTissGenes. Class B consists of only cTissGenes without additional evidence. The remaining genes belong to Class C. |
| Gene ontology having evidence of Inferred from Direct Assay (IDA) from Entrez |
| GO ID | GO term | PubMed ID | GO:0006820 | anion transport | 11834742 | GO:0006821 | chloride transport | 15800055 | GO:0010628 | positive regulation of gene expression | 20658517 | GO:0015701 | bicarbonate transport | 15800055 | GO:1902476 | chloride transmembrane transport | 17673510 | GO:0006820 | anion transport | 11834742 | GO:0006821 | chloride transport | 15800055 | GO:0010628 | positive regulation of gene expression | 20658517 | GO:0015701 | bicarbonate transport | 15800055 | GO:1902476 | chloride transmembrane transport | 17673510 |
| Top |
| TissGeneExp for SLC26A9 |
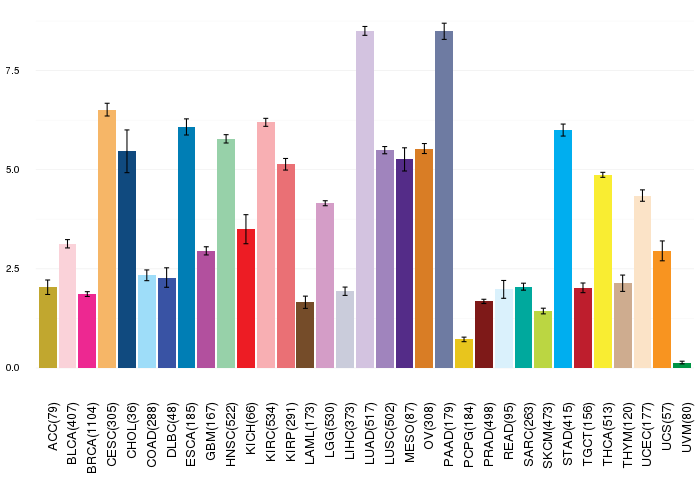
| Gene expressions across 28 cancer types (X-axis: cancer type and Y-axis: log2(norm_counts+1)) (TCGA IlluminaHiSeq_RNASeqV2, pan-cancer normalized log2(norm_counts+1) data, version 2016-08-16) |
 |
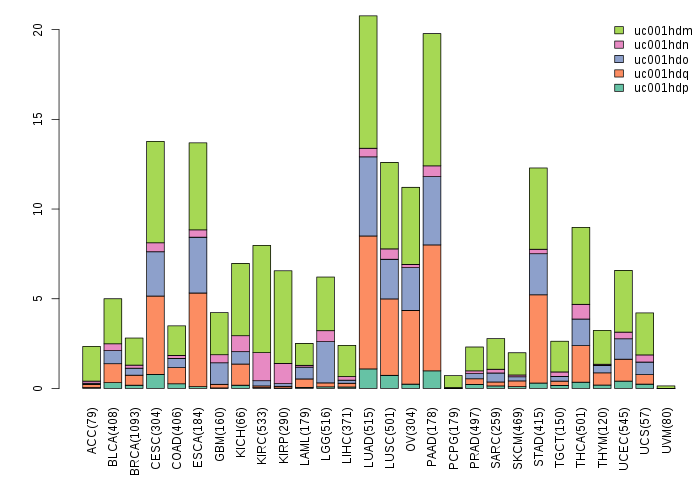
| Gene isoform expressions across 28 cancer types (X-axis: cancer type and Y-axis: log2(norm_counts+1)) (TCGA pan-cancer tcga_rsem_isoform_tpm, version 2016-09-01) |
 |
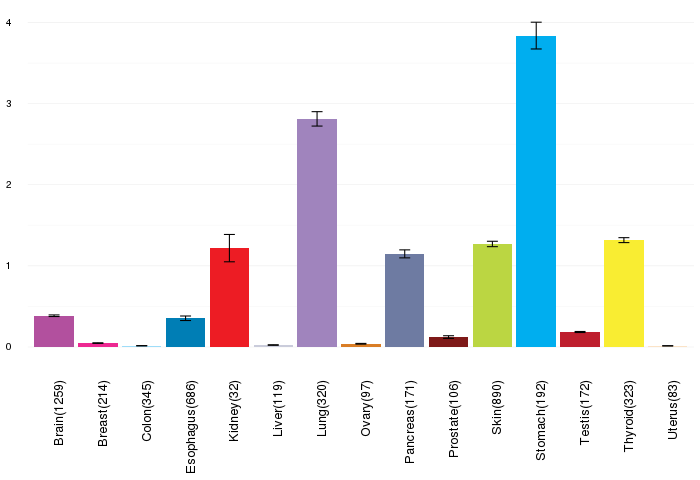
| Gene expressions across normal tissues of GTEx data (GTEx GTEx_Analysis_v6_RNA-seq_RNA-SeQCv1.1.8_gene_rpkm.gct) - Here, we shows the matched tissue types only among our 28 cancer types. |
 |
| Different expressions across 14 cancer types with more than 10 samples between matched tumors and normals (X-axis: cancer type and Y-axis: log2(norm_counts+1)) (TCGA IlluminaHiSeq_RNASeqV2, pan-cancer normalized log2(norm_counts+1) data, version 2016-08-16) |
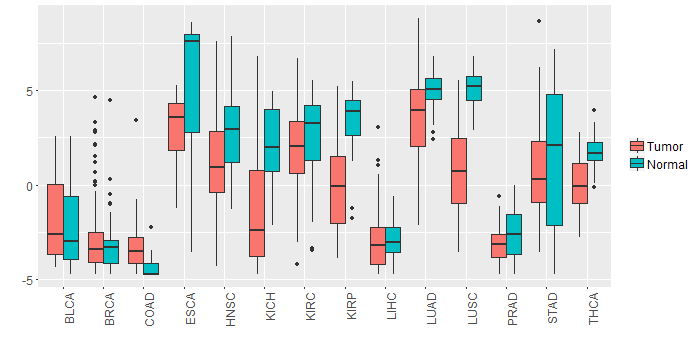 |
| - Significantly differentially expressed cancer types and information. (|Fold change|>1 and FDR<0.05) |
| Cancer type | Mean(exp) in tumor | Mean(exp) in matched normal | Log2FC | P-val. | FDR |
| KICH | -1.351608268 | 2.141819732 | -3.493428 | 3.45E-05 | 9.86E-05 |
| KIRP | -0.093497393 | 3.378171357 | -3.47166875 | 5.39E-09 | 4.35E-08 |
| LUSC | 0.837928281 | 5.116065535 | -4.278137255 | 4.31E-18 | 3.96E-17 |
| THCA | 0.080021833 | 1.788142172 | -1.708120339 | 1.57E-12 | 1.33E-11 |
| HNSC | 1.233469685 | 2.733492941 | -1.500023256 | 0.00513 | 0.013839928 |
| COAD | -3.080144268 | -4.367144268 | 1.287 | 0.000883 | 0.002565853 |
| LUAD | 3.579047111 | 5.067360904 | -1.488313793 | 0.00012 | 0.000299399 |
| Top |
| TissGene-miRNA for SLC26A9 |
| Significantly anti-correlated miRNAs of TissGene across 28 cancer types (Gene-miRNA relations from TargetScanHuman Relsease 7.1, Conserved_Site_Context_Scores.txt.zip, 06.01.2016) (TCGA IlluminaHiSeq_miRNASeq, log2(RPM+1) data, version 2016-11-21) (TCGA IlluminaHiSeq_RNASeqV2, log2(normalized_count+1) data, version 2016-08-16) (Spearman’s Rank Correlation (p-value<0.05 and coefficient<-0.25)) |
| Cancer type | miRNA id | miRNA accession | P-val. | Coeff. | # samples |
| LUAD | hsa-miR-96-5p | MIMAT0000095 | 0.041 | -0.27 | 60 |
| UCS | hsa-miR-26a-5p | MIMAT0000082 | 0.022 | -0.31 | 56 |
| UCS | hsa-miR-181d-5p | MIMAT0002821 | 0.019 | -0.31 | 56 |
| Top |
| TissGeneMut for SLC26A9 |
| TissGeneSNV for SLC26A9 |
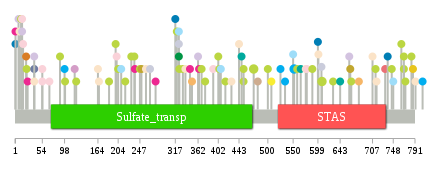
| nsSNV counts per each loci. Different colors of circles represent different cancer types. Circle size denotes number of samples. (TCGA somatic mutation (SNPs and small INDELs) data, version 2016-04-25) * Click on the image to enlarge it in a new window. |
 |
 |
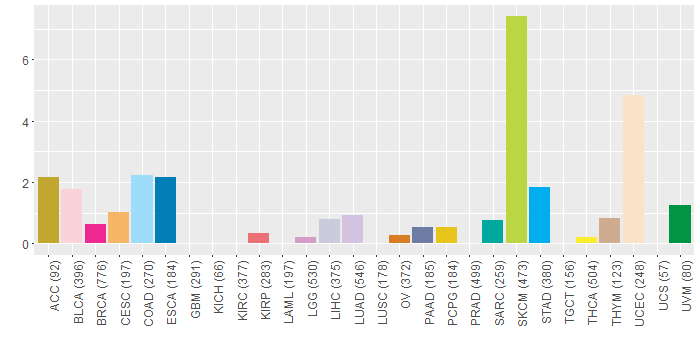
| Somatic nucleotide variants of TissGene across 28 cancer types (X-axis: cancer type and Y-axis: % of mutated samples) The numbers in parentheses are numbers of samples with mutation (nsSNVs). (TCGA somatic mutation (SNPs and small INDELs) data, version 2016-04-25) |
 |
| - nsSNVs sorted by frequency. |
| AAchange | Cancer type | # samples |
| p.A552T | STAD | 2 |
| p.P607S | SKCM | 2 |
| p.S472F | SKCM | 2 |
| p.K443N | UCEC | 1 |
| p.R317S | ESCA | 1 |
| p.S324T | LIHC | 1 |
| p.G225R | READ | 1 |
| p.G54E | BLCA | 1 |
| p.M369I | SKCM | 1 |
| p.S871F | COAD | 1 |
| p.A164V | UCEC | 1 |
| p.V9M | UCEC | 1 |
| p.P606S | LIHC | 1 |
| p.P558L | SKCM | 1 |
| p.R500Q | SKCM | 1 |
| p.P99S | SKCM | 1 |
| p.P325S | SKCM | 1 |
| p.N247Y | SKCM | 1 |
| p.Y865H | LIHC | 1 |
| p.G118E | LGG | 1 |
| p.I204L | SKCM | 1 |
| p.S392C | BLCA | 1 |
| p.P428T | UCEC | 1 |
| p.T661S | LUAD | 1 |
| p.D332N | SKCM | 1 |
| p.M1I | BRCA | 1 |
| p.A737V | READ | 1 |
| p.G54D | BLCA | 1 |
| p.Q448K | SARC | 1 |
| p.R29Q | HNSC | 1 |
| p.A350V | CESC | 1 |
| p.G713E | SKCM | 1 |
| p.H121Y | SKCM | 1 |
| p.Y534H | STAD | 1 |
| p.T787P | PCPG | 1 |
| p.S218L | SKCM | 1 |
| p.R12K | SKCM | 1 |
| p.A211D | HNSC | 1 |
| p.E166D | UCEC | 1 |
| p.I237V | BRCA | 1 |
| p.A14T | LUAD | 1 |
| p.S16C | BLCA | 1 |
| p.P320S | SKCM | 1 |
| p.M577I | BLCA | 1 |
| p.Q600H | UCEC | 1 |
| p.A337T | UCEC | 1 |
| p.N376S | SKCM | 1 |
| p.V346I | BRCA | 1 |
| p.R281C | READ | 1 |
| p.R576K | HNSC | 1 |
| p.A785T | DLBC | 1 |
| p.W772* | SKCM | 1 |
| p.P629S | SKCM | 1 |
| p.A259T | UCEC | 1 |
| p.A407T | COAD | 1 |
| p.A643D | SARC | 1 |
| p.M588I | SKCM | 1 |
| p.A14T | BLCA | 1 |
| p.Y707H | UCEC | 1 |
| p.L98H | STAD | 1 |
| p.H748R | COAD | 1 |
| p.P874S | SKCM | 1 |
| p.P452L | SKCM | 1 |
| p.G402E | SKCM | 1 |
| p.H278Q | BRCA | 1 |
| p.G841E | SKCM | 1 |
| p.G186S | SKCM | 1 |
| p.Q507E | THCA | 1 |
| p.H784Y | SKCM | 1 |
| p.R38C | UCEC | 1 |
| p.S764L | SKCM | 1 |
| p.L665F | SKCM | 1 |
| p.H250Y | ACC | 1 |
| p.G89S | SKCM | 1 |
| p.A210T | COAD | 1 |
| p.E23K | SKCM | 1 |
| p.S877L | SKCM | 1 |
| p.I680M | CESC | 1 |
| p.M1I | ESCA | 1 |
| p.R38H | PAAD | 1 |
| p.S236F | SKCM | 1 |
| p.S230C | SKCM | 1 |
| p.Q599E | ESCA | 1 |
| p.V715I | UCEC | 1 |
| p.K565Q | SARC | 1 |
| p.A181P | HNSC | 1 |
| p.M416I | SKCM | 1 |
| p.Y480H | THYM | 1 |
| p.R769H | SKCM | 1 |
| p.R769H | HNSC | 1 |
| p.S324L | COAD | 1 |
| p.K68E | BLCA | 1 |
| p.D362N | LUAD | 1 |
| p.V267E | LIHC | 1 |
| p.E792K | UCEC | 1 |
| p.R575W | UCEC | 1 |
| p.R769C | SKCM | 1 |
| p.D364H | BRCA | 1 |
| p.S324L | UVM | 1 |
| p.R38C | HNSC | 1 |
| p.H663N | ACC | 1 |
| p.D844Y | STAD | 1 |
| p.T745I | SKCM | 1 |
| p.P452S | SKCM | 1 |
| p.R7L | LUAD | 1 |
| p.E806D | STAD | 1 |
| p.S404C | SKCM | 1 |
| p.A733T | READ | 1 |
| p.E201K | BLCA | 1 |
| p.A737V | ESCA | 1 |
| p.A790T | READ | 1 |
| p.L199F | SKCM | 1 |
| p.V550G | COAD | 1 |
| p.D732N | KIRP | 1 |
| p.R38C | LUAD | 1 |
| p.D525N | STAD | 1 |
| p.A390V | READ | 1 |
| p.D22E | OV | 1 |
| p.E25Q | BRCA | 1 |
| Top |
| TissGeneCNV for SLC26A9 |
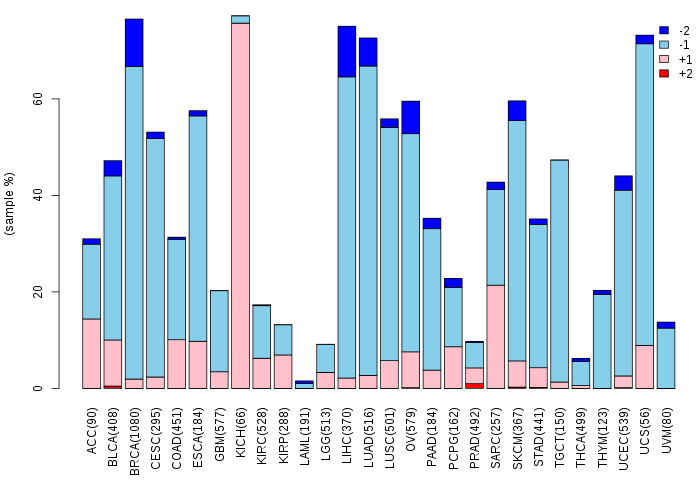
| Copy number variations of TissGene across 28 cancer types (X-axis: cancer type and Y-axis: % of CNV samples) (TCGA Gistic2_CopyNumber_Gistic2_all_data_by_genes, Gistic2 copy number data, version 2016-08-16) |
 |
| Top |
| TissGeneFusions for SLC26A9 |
| Fusion genes including TissGene (ChimerDB 3.0, 2016-12-01 and TCGA fusion Portal 2015-12-01) |
| Database | Src | Cancer type | Sample | Fusion gene | ORF | 5'-gene BP | 3'-gene BP |
| Chimerdb3.0 | FusionScan | BRCA | TCGA-E2-A1B0-01A | NUCKS1-SLC26A9 | In-Frame | chr1:205719084 | chr1:205902212 |
| TCGAfusionPortal | PRADA | PRAD | TCGA-HC-8265-01A | ELK4-SLC26A9 | CDS-5UTR | Chr1:205592804 | Chr1:205904966 |
| Top |
| TissGeneNet for SLC26A9 |
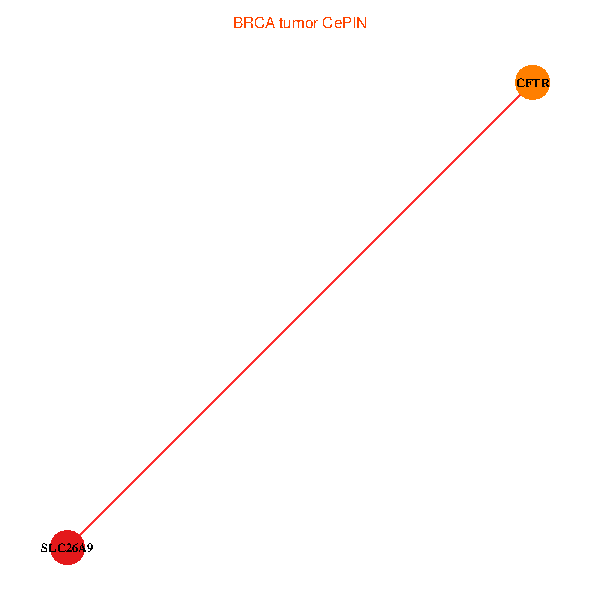
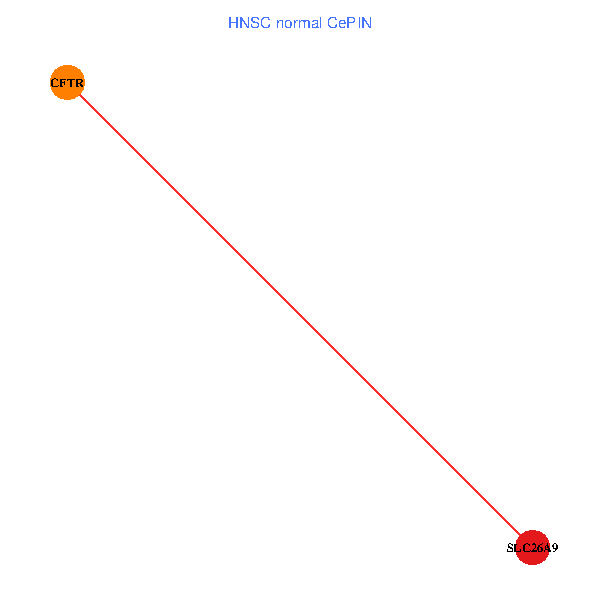
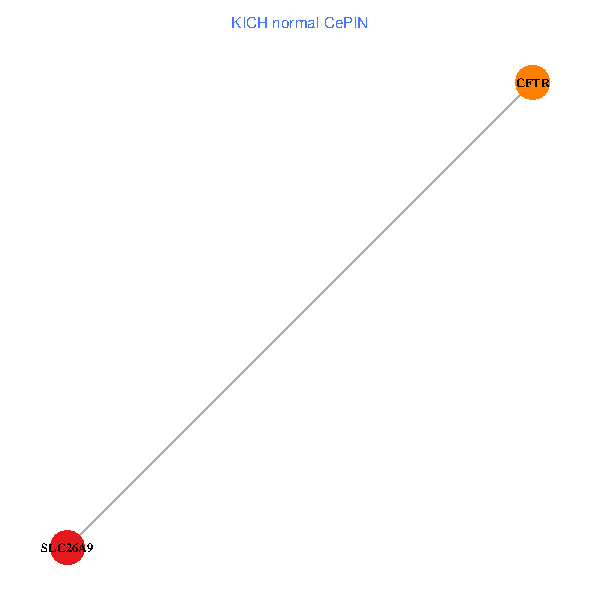
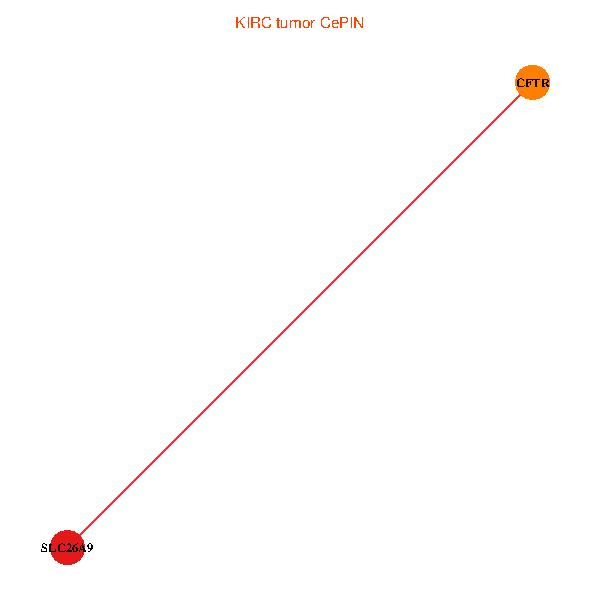
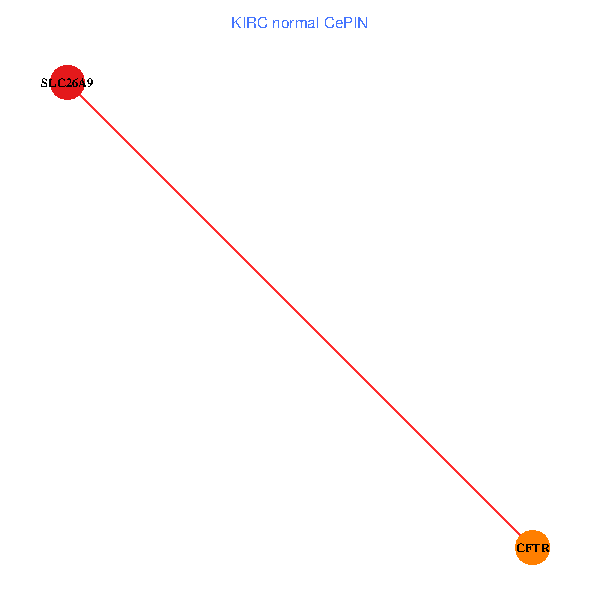
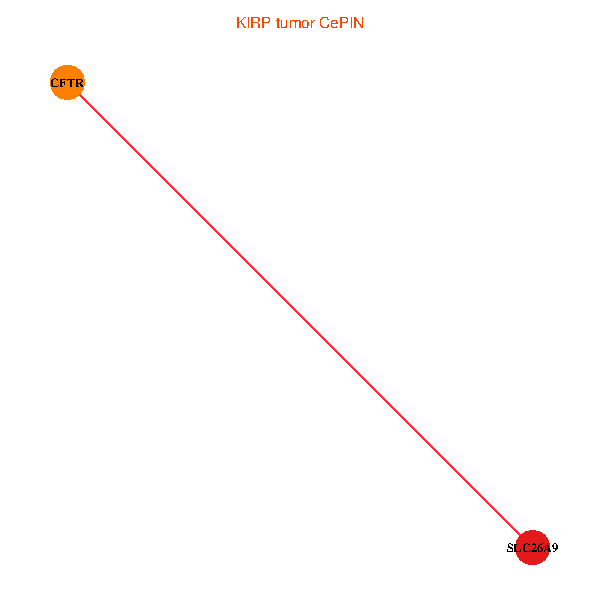
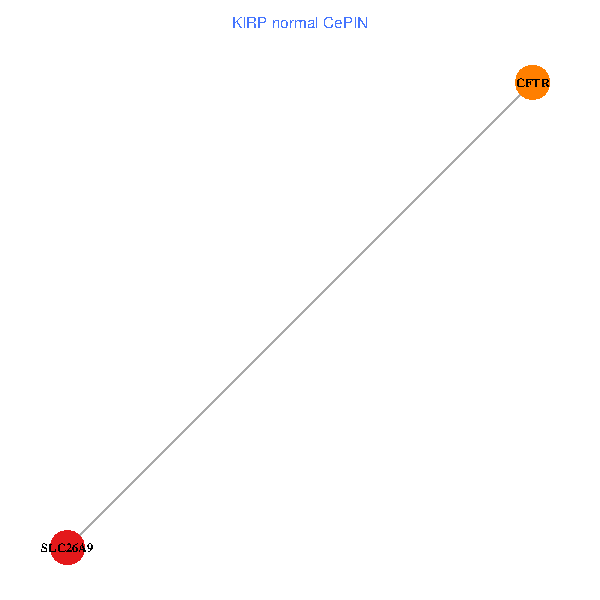
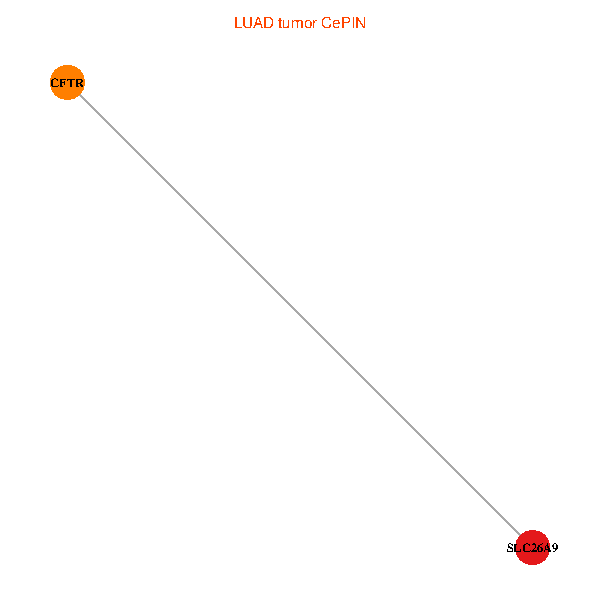
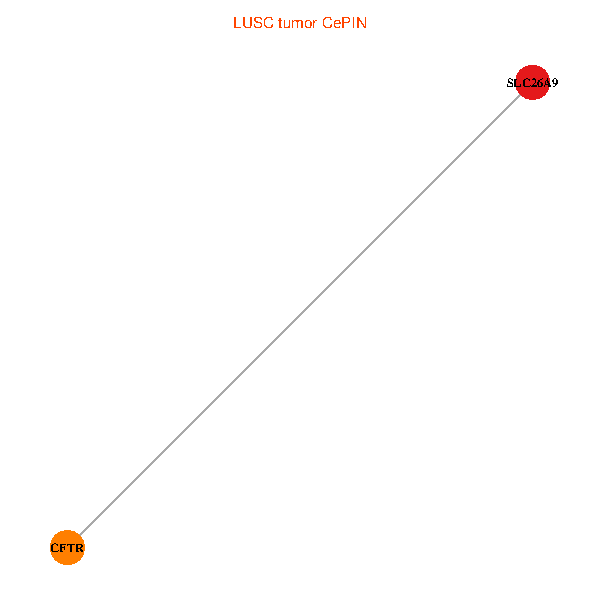
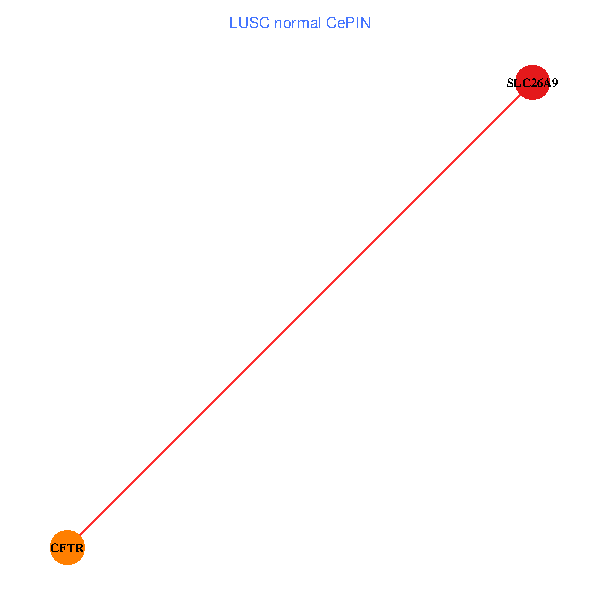
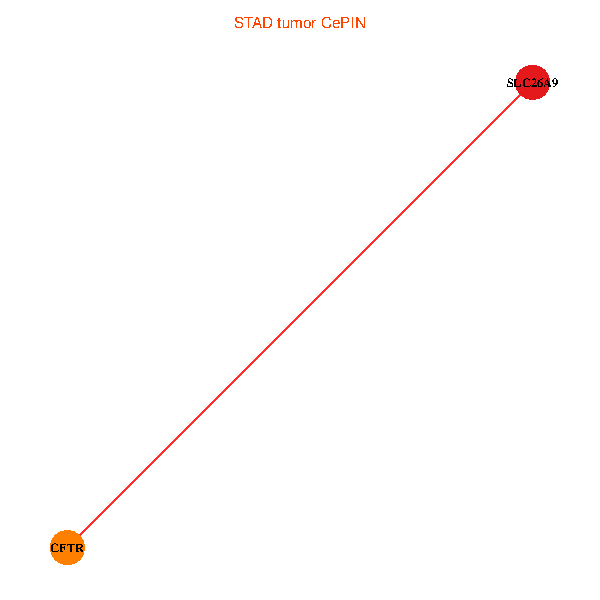
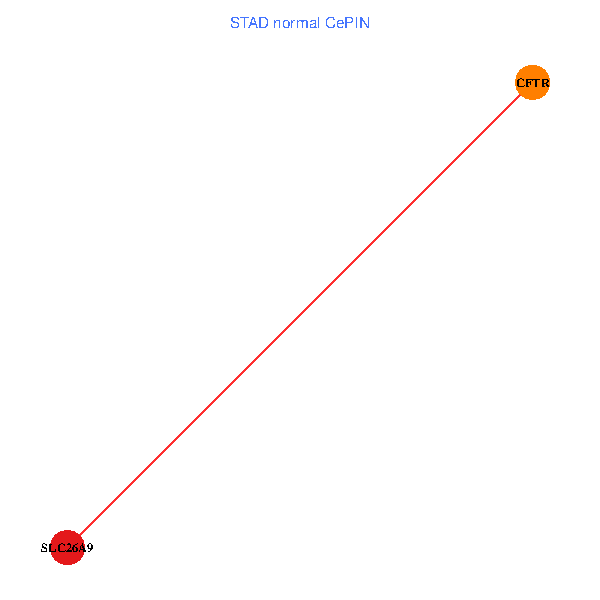
| Co-expressed gene networks based on protein-protein interaction data (CePIN) (TCGA IlluminaHiSeq_RNASeqV2, pan-cancer normalized log2(norm_counts+1) data, version 2016-08-16) (PINA2 ppi data) |
| BRCA (tumor) | BRCA (normal) |
| SLC26A9, CFTR (tumor) | SLC26A9, CFTR (normal) |
 |  |
| COAD (tumor) | COAD (normal) |
| SLC26A9, CFTR (tumor) | SLC26A9, CFTR (normal) |
 |  |
| HNSC (tumor) | HNSC (normal) |
| SLC26A9, CFTR (tumor) | SLC26A9, CFTR (normal) |
 |  |
| KICH (tumor) | KICH (normal) |
| SLC26A9, CFTR (tumor) | SLC26A9, CFTR (normal) |
 |  |
| KIRC (tumor) | KIRC (normal) |
| SLC26A9, CFTR (tumor) | SLC26A9, CFTR (normal) |
 |  |
| KIRP (tumor) | KIRP (normal) |
| SLC26A9, CFTR (tumor) | SLC26A9, CFTR (normal) |
 |  |
| LIHC (tumor) | LIHC (normal) |
| SLC26A9, CFTR (tumor) | SLC26A9, CFTR (normal) |
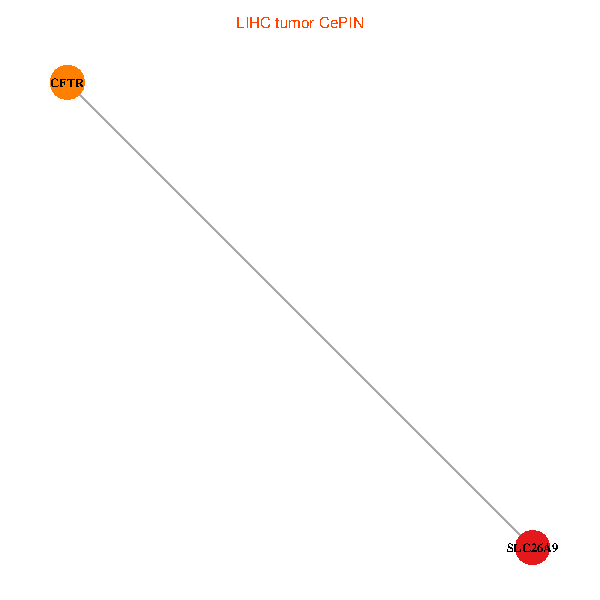 |  |
| LUAD (tumor) | LUAD (normal) |
| SLC26A9, CFTR (tumor) | SLC26A9, CFTR (normal) |
 |  |
| LUSC (tumor) | LUSC (normal) |
| SLC26A9, CFTR (tumor) | SLC26A9, CFTR (normal) |
 |  |
| PRAD (tumor) | PRAD (normal) |
| SLC26A9, CFTR (tumor) | SLC26A9, CFTR (normal) |
 |  |
| STAD (tumor) | STAD (normal) |
| SLC26A9, CFTR (tumor) | SLC26A9, CFTR (normal) |
 |  |
| THCA (tumor) | THCA (normal) |
| SLC26A9, CFTR (tumor) | SLC26A9, CFTR (normal) |
 |  |
| Top |
| TissGeneProg for SLC26A9 |
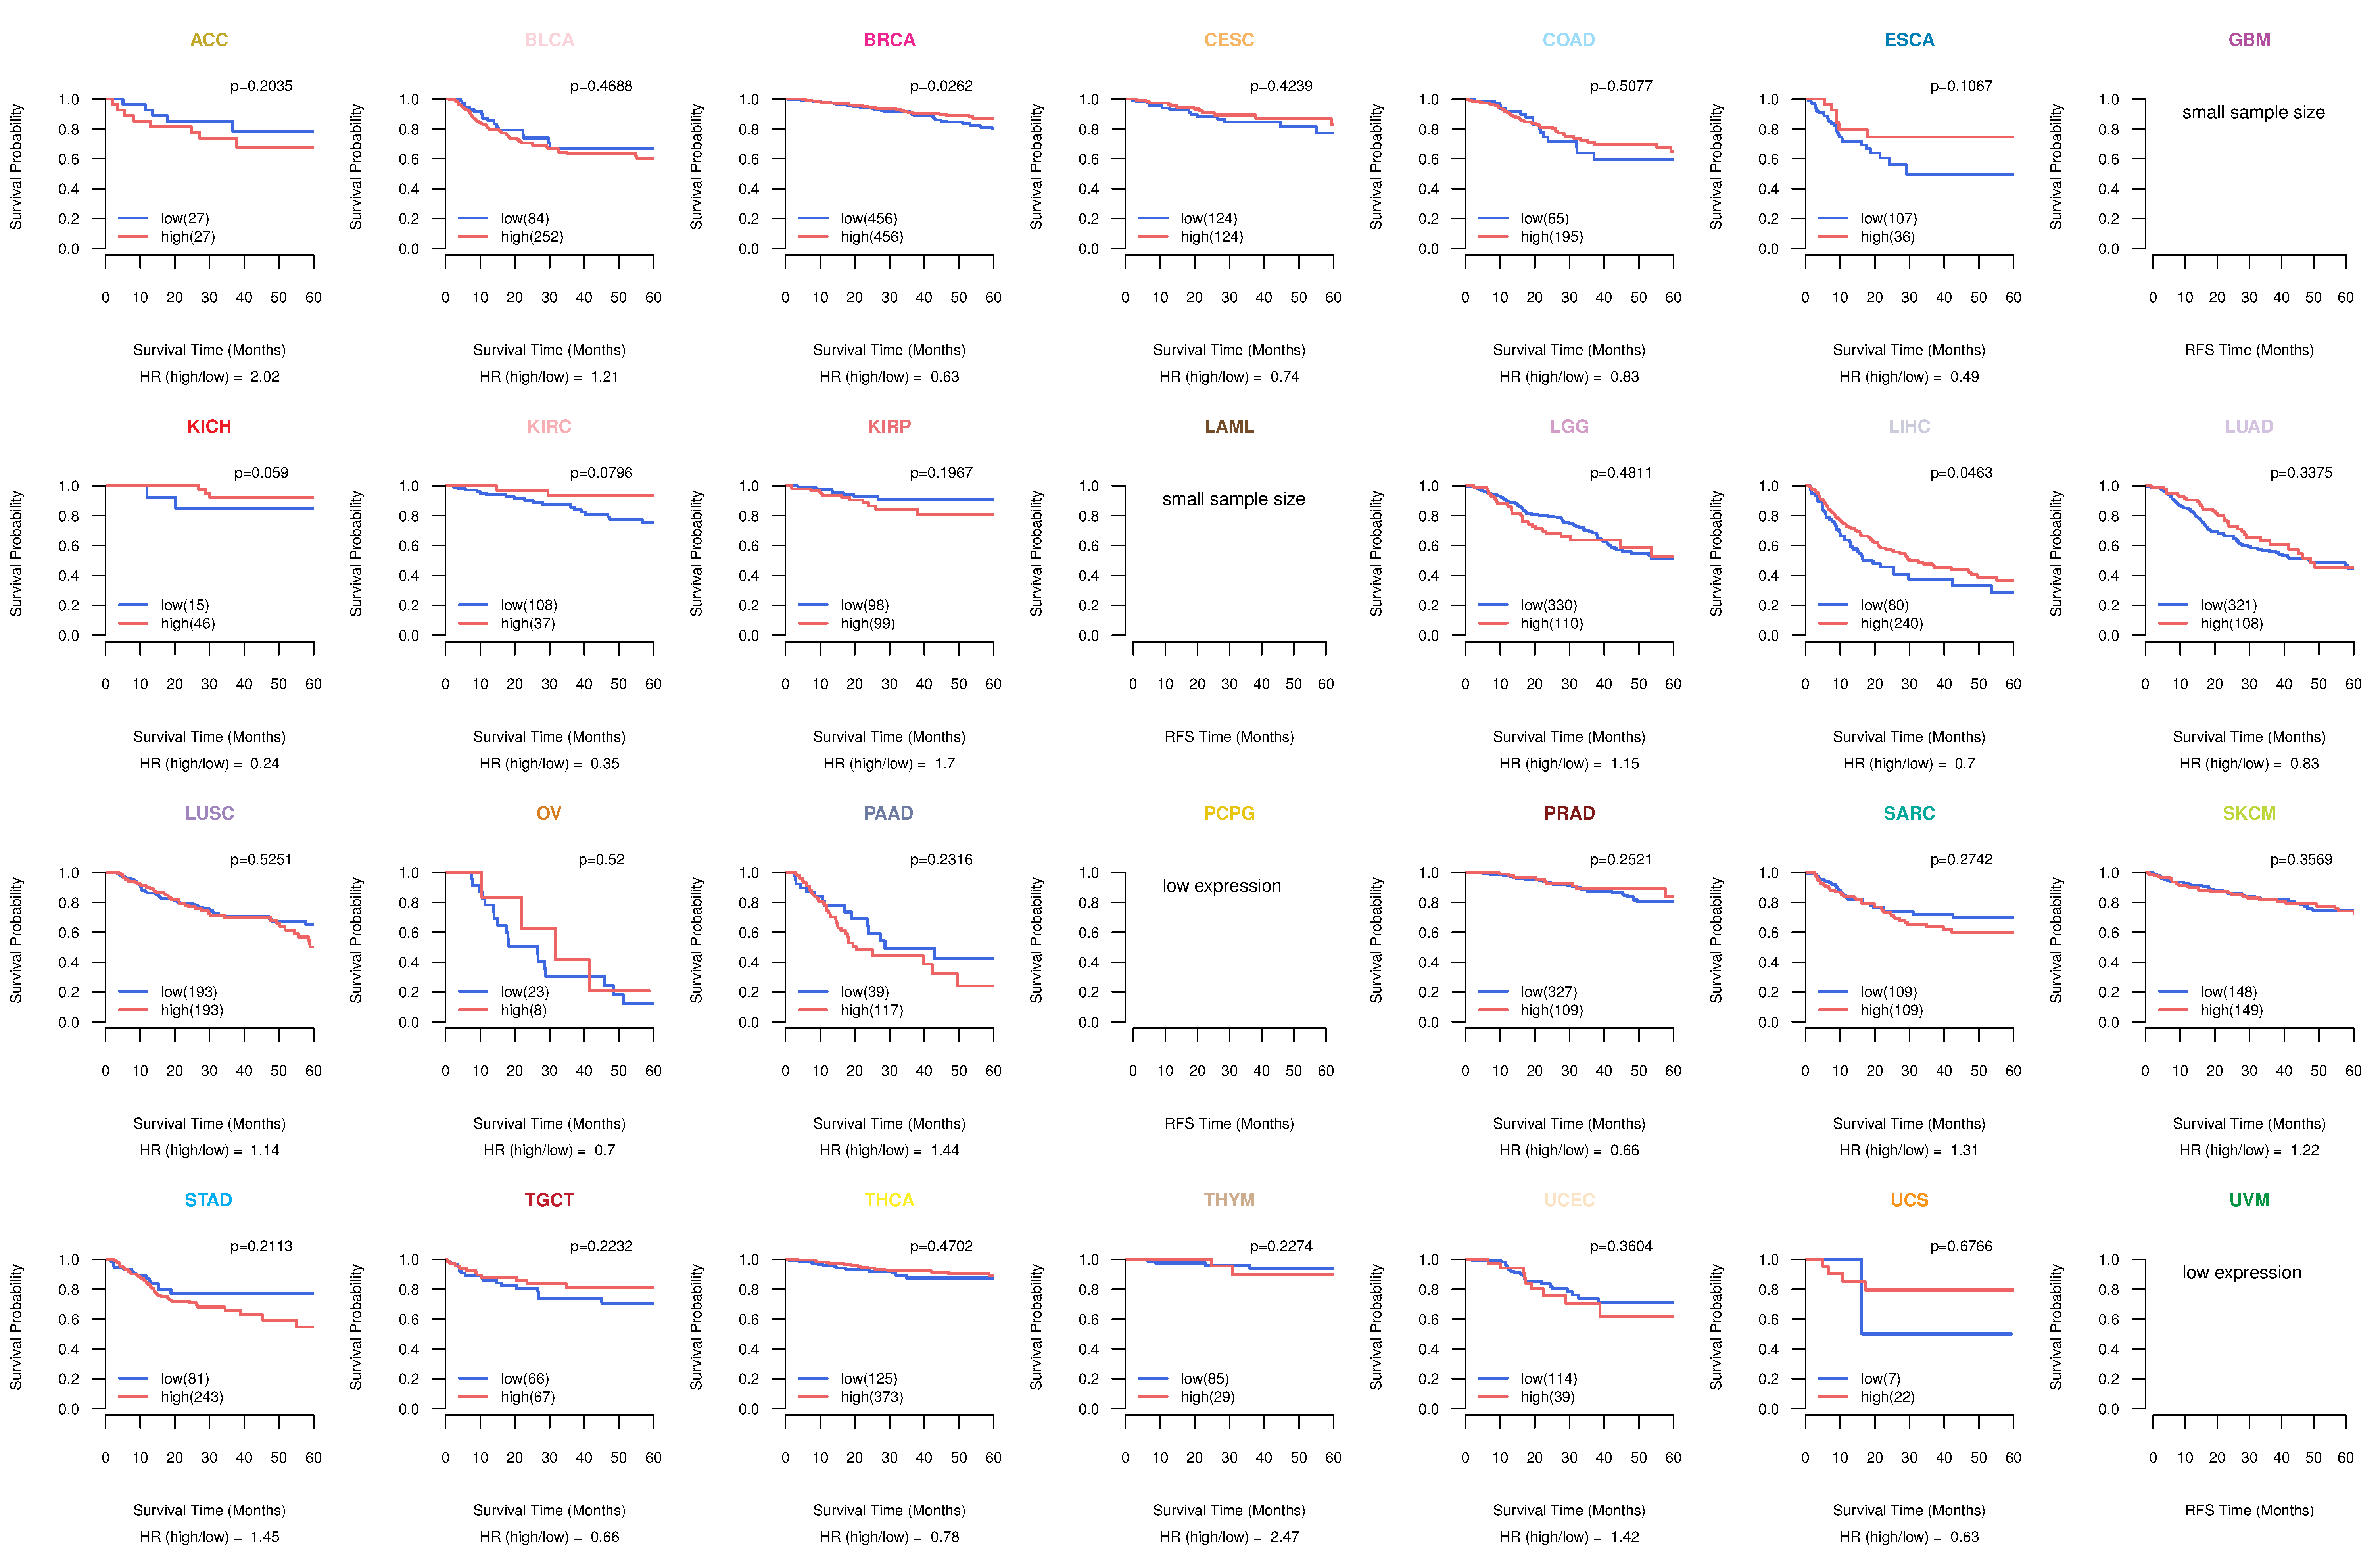
| Kaplan-Meier plots with logrank tests of overall survival (OS) using 28 cancer types (TCGA IlluminaHiSeq_RNASeqV2, pan-cancer normalized log2(norm_counts+1) data, version 2016-08-16) (TCGA clinicalMatrix, phenotype data, version 2016-04-27) * Click on the image to enlarge it in a new window. |
 |
| Kaplan-Meier plots with logrank test of relapse free survival (RFS) using 28 cancer types (TCGA IlluminaHiSeq_RNASeqV2, pan-cancer normalized log2(norm_counts+1) data, version 2016-08-16) (TCGA clinicalMatrix, phenotype data, version 2016-04-27) * Click on the image enlarge it in a new window. |
 |
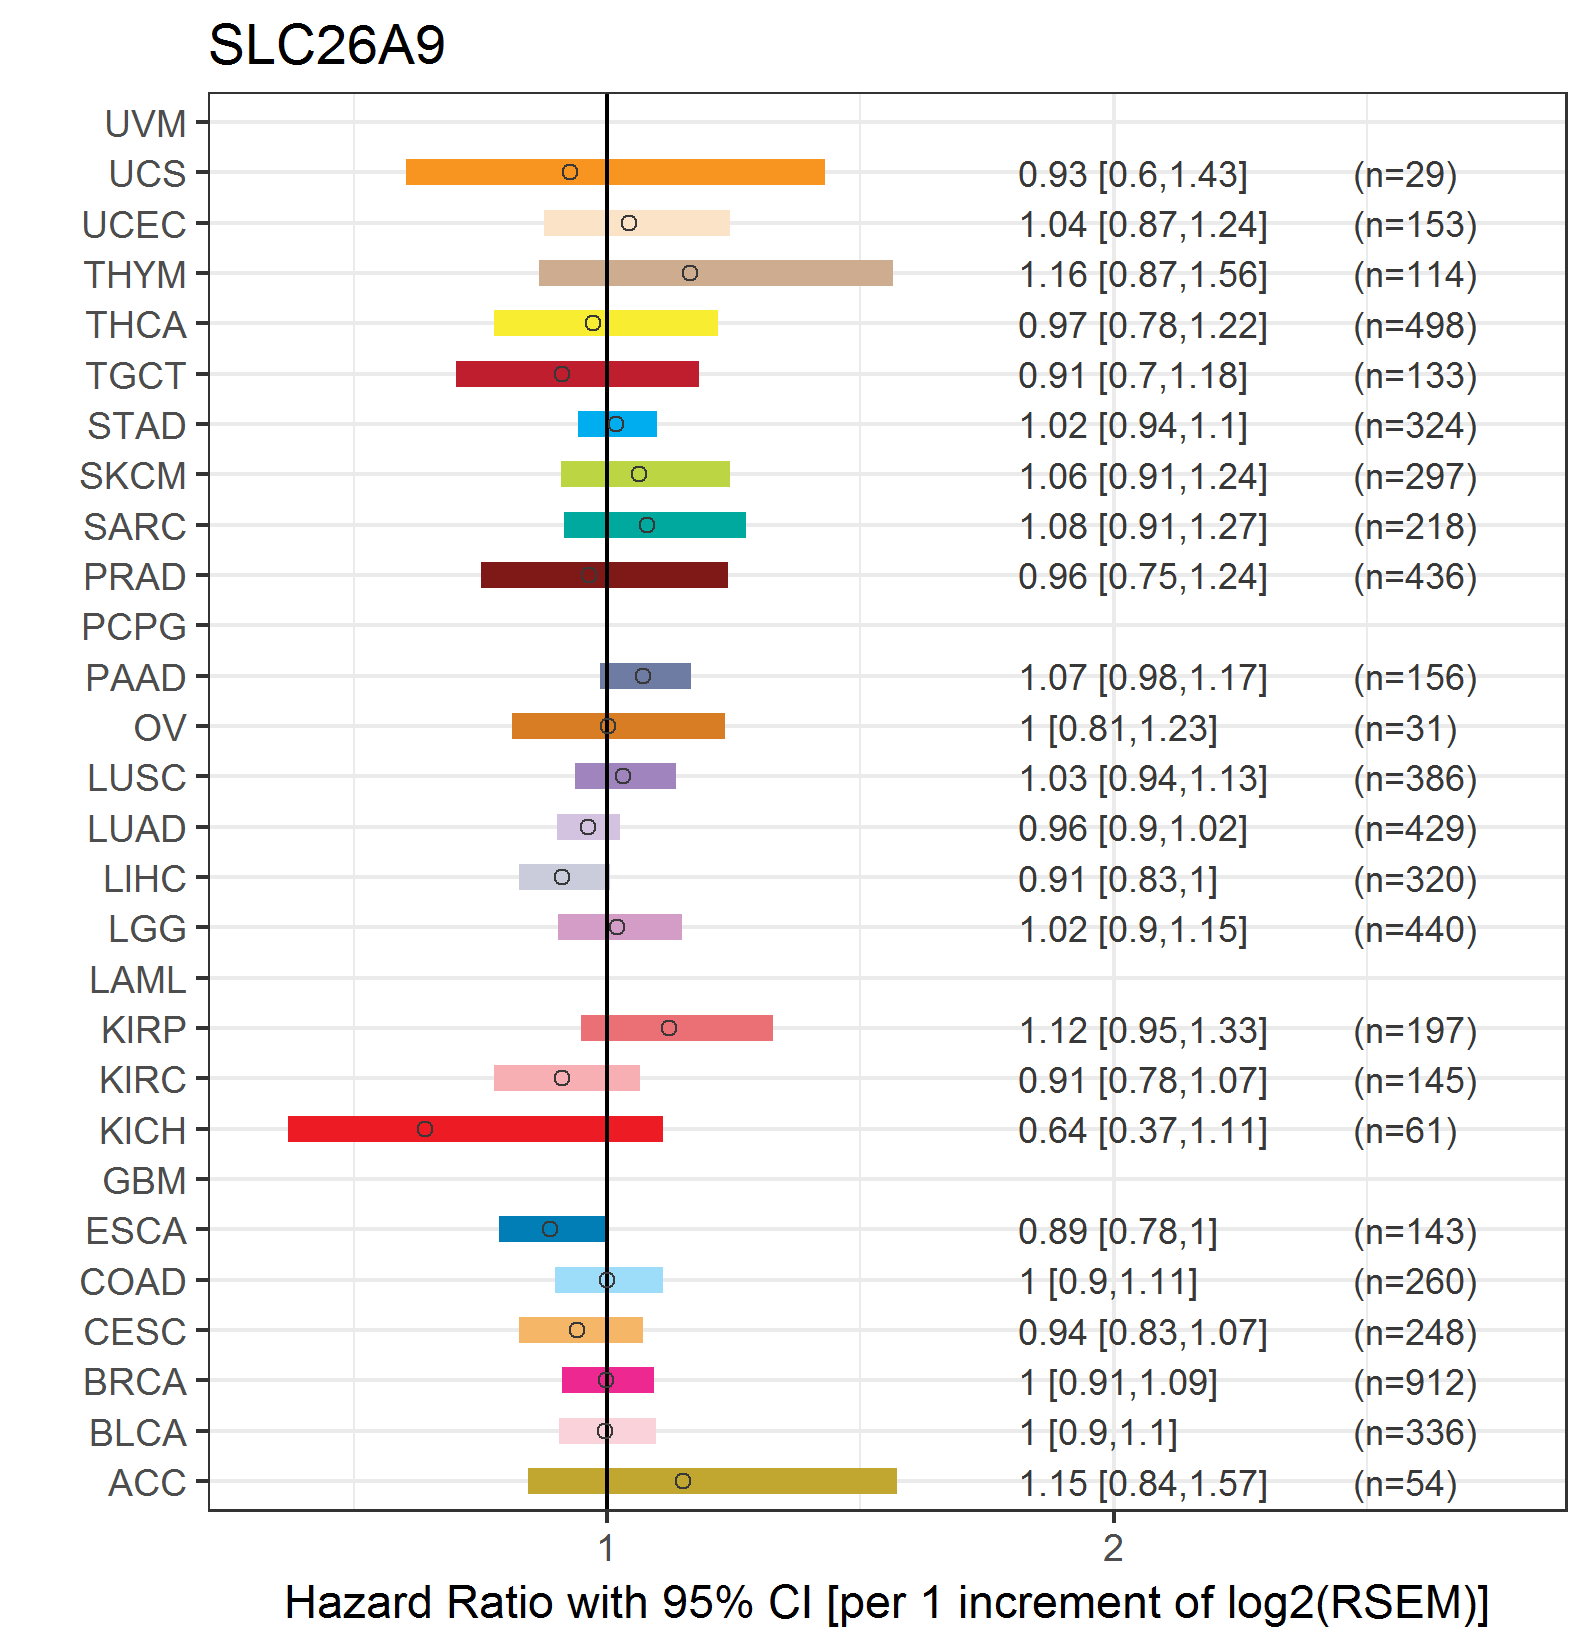
| Forest plot of Cox proportional hazard ratio (HR) and 95% CI of overall survival (OS) using 28 cancer types (TCGA IlluminaHiSeq_RNASeqV2, pan-cancer normalized log2(norm_counts+1) data, version 2016-08-16) (TCGA clinicalMatrix, phenotype data, version 2016-04-27) * Click on the image enlarge it in a new window. |
 |
| Forest plot of Cox proportional hazard ratio (HR) and 95% CI of relapse free survival (RFS) using 28 cancer types (TCGA IlluminaHiSeq_RNASeqV2, pan-cancer normalized log2(norm_counts+1) data, version 2016-08-16) (TCGA clinicalMatrix, phenotype data, version 2016-04-27) * Click on the image enlarge it in a new window. |
 |
| Top |
| TissGeneClin for SLC26A9 |
| TissGeneDrug for SLC26A9 |
| Drug information targeting TissGene (DrugBank Version 5.0.6, 2017-04-01) |
| DrugBank ID | Drug name | Drug activity | Drug type | Drug status |
| Top |
| TissGeneDisease for SLC26A9 |
| Disease information associated with TissGene (DisGeNet, 2016-06-01) |
| Disease ID | Disease name | # pubmeds | Source |
| umls:C0024115 | Lung diseases | 2 | BeFree |
| umls:C0270246 | Meconium plug syndrome | 2 | BeFree |
| umls:C0546982 | Cystic fibrosis with meconium ileus | 2 | BeFree |
| umls:C2939175 | Meconium ileus | 2 | BeFree |
| umls:C0001883 | Airway Obstruction | 1 | BeFree |
| umls:C0004096 | Asthma | 1 | BeFree |
| umls:C0010674 | Cystic Fibrosis | 1 | BeFree |
| umls:C0011847 | Diabetes | 1 | BeFree |
| umls:C0011849 | Diabetes Mellitus | 1 | BeFree |
| umls:C0011860 | Diabetes Mellitus, Non-Insulin-Dependent | 1 | BeFree |
| umls:C0019196 | Hepatitis C | 1 | GAD |
| umls:C0021843 | Intestinal Obstruction | 1 | CTD_human |
| umls:C0030286 | Pancreatic Diseases | 1 | BeFree |
| umls:C0333133 | Mucus cast | 1 | BeFree |
| umls:C0339985 | Idiopathic bronchiectasis | 1 | BeFree |
| umls:C0699949 | airway disease | 1 | BeFree |
| umls:C1859047 | CYSTIC FIBROSIS MODIFIER 1 | 1 | CTD_human |
|
Copyright 2016-Present - The University of Texas Health Science Center at Houston (UTHealth) Web File Viewing | How to Report, Fraud, Waste and Abuse | State of Texas | Statewide Search | Texas Homeland Security | Site Policies |