 |
| |
| |
| |
| |
| |
| |
|

| TissGeneSummary for CMTM5 |
 Gene summary Gene summary |
| Basic gene information | Gene symbol | CMTM5 |
| Gene name | CKLF-like MARVEL transmembrane domain containing 5 | |
| Synonyms | CKLFSF5 | |
| Cytomap | UCSC genome browser: 14q11.2 | |
| Type of gene | protein-coding | |
| RefGenes | NM_001037288.1, NM_001288744.1,NM_001288745.1,NM_001288746.1,NM_138460.2, NM_181618.1, | |
| Description | CKLF-like MARVEL transmembrane domain-containing protein 5chemokine-like factor super family 5chemokine-like factor superfamily member 5 | |
| Modification date | 20141207 | |
| dbXrefs | MIM : 607888 | |
| HGNC : HGNC | ||
| Ensembl : ENSG00000166091 | ||
| HPRD : 06986 | ||
| Vega : OTTHUMG00000028751 | ||
| Protein | UniProt: go to UniProt's Cross Reference DB Table | |
| Expression | CleanEX: HS_CMTM5 | |
| BioGPS: 116173 | ||
| Pathway | NCI Pathway Interaction Database: CMTM5 | |
| KEGG: CMTM5 | ||
| REACTOME: CMTM5 | ||
| Pathway Commons: CMTM5 | ||
| Context | iHOP: CMTM5 | |
| ligand binding site mutation search in PubMed: CMTM5 | ||
| UCL Cancer Institute: CMTM5 | ||
| Assigned class in TissGDB* | C | |
| Included tissue-specific gene expression resources | HPA,TiGER | |
| Specific-tissues in normal samples (assigned by TissGDB using HPA, TiGER, and GTEx) | Brain | |
| Cancer types related to the specific-tissues in cancer samples (assigned by TissGDB using TCGA) | GBM,LGG | |
| Reference showing the relevant tissue of CMTM5 | ||
| Description by TissGene annotations | Cancer gene TissgsKTS | |
| * Class A consists of genes with literature evidence and is part of the cTissGenes. Class B consists of only cTissGenes without additional evidence. The remaining genes belong to Class C. |
| Gene ontology having evidence of Inferred from Direct Assay (IDA) from Entrez |
| GO ID | GO term | PubMed ID |
| Top |
| TissGeneExp for CMTM5 |
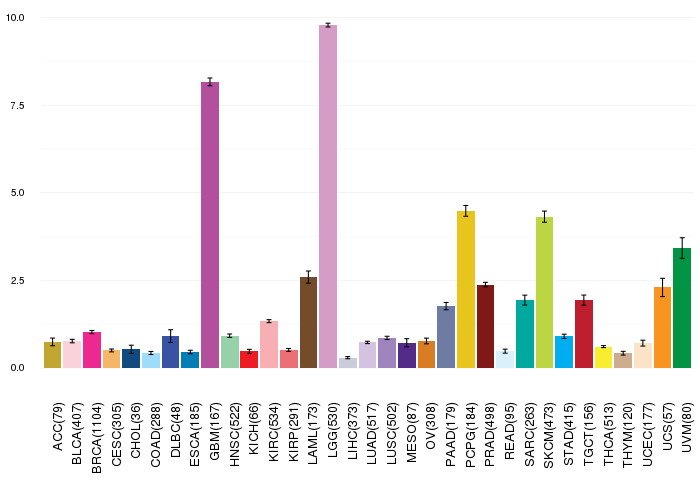
| Gene expressions across 28 cancer types (X-axis: cancer type and Y-axis: log2(norm_counts+1)) (TCGA IlluminaHiSeq_RNASeqV2, pan-cancer normalized log2(norm_counts+1) data, version 2016-08-16) |
 |
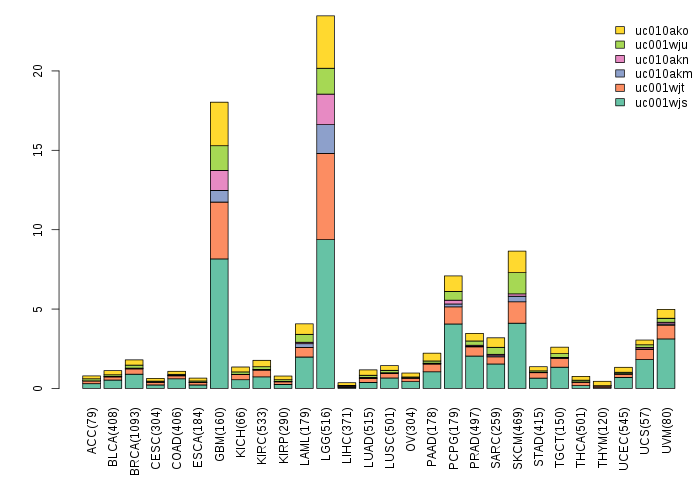
| Gene isoform expressions across 28 cancer types (X-axis: cancer type and Y-axis: log2(norm_counts+1)) (TCGA pan-cancer tcga_rsem_isoform_tpm, version 2016-09-01) |
 |
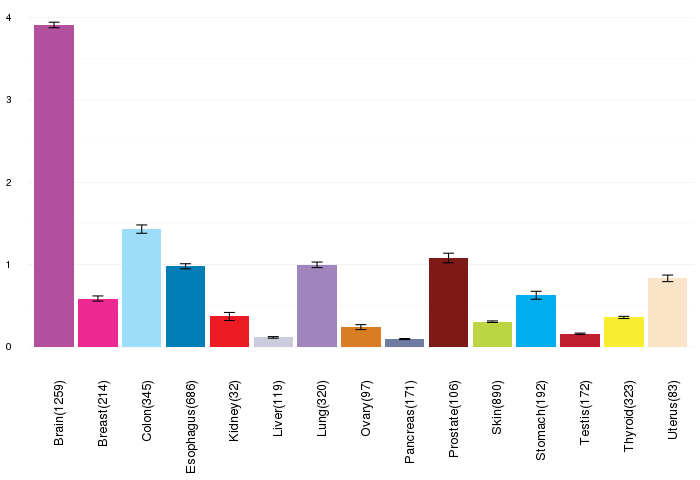
| Gene expressions across normal tissues of GTEx data (GTEx GTEx_Analysis_v6_RNA-seq_RNA-SeQCv1.1.8_gene_rpkm.gct) - Here, we shows the matched tissue types only among our 28 cancer types. |
 |
| Different expressions across 14 cancer types with more than 10 samples between matched tumors and normals (X-axis: cancer type and Y-axis: log2(norm_counts+1)) (TCGA IlluminaHiSeq_RNASeqV2, pan-cancer normalized log2(norm_counts+1) data, version 2016-08-16) |
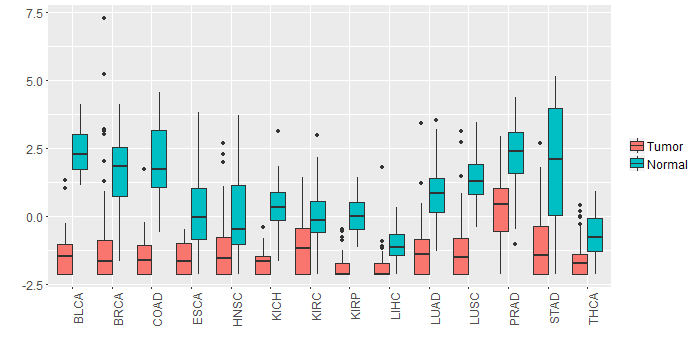 |
| - Significantly differentially expressed cancer types and information. (|Fold change|>1 and FDR<0.05) |
| Cancer type | Mean(exp) in tumor | Mean(exp) in matched normal | Log2FC | P-val. | FDR |
| KICH | -1.671331621 | 0.400532379 | -2.071864 | 1.25E-10 | 9.34E-10 |
| STAD | -0.965649871 | 1.960722004 | -2.926371875 | 2.14E-08 | 8.30E-07 |
| PRAD | 0.280108302 | 2.245510225 | -1.965401923 | 9.30E-14 | 6.72E-12 |
| KIRC | -1.052825565 | -0.021878343 | -1.030947222 | 1.49E-10 | 5.17E-10 |
| LUSC | -1.11486715 | 1.291464222 | -2.406331373 | 2.27E-19 | 2.45E-18 |
| COAD | -1.442320544 | 1.998517918 | -3.440838462 | 7.19E-13 | 1.99E-11 |
| KIRP | -1.794856121 | 0.039493879 | -1.83435 | 4.82E-17 | 1.93E-15 |
| LUAD | -1.23201431 | 0.886671896 | -2.118686207 | 6.38E-21 | 1.48E-19 |
| BLCA | -1.226543621 | 2.402866906 | -3.629410526 | 6.39E-14 | 1.42E-10 |
| BRCA | -1.146007656 | 1.607079186 | -2.753086842 | 6.95E-35 | 1.31E-33 |
| HNSC | -1.101294784 | -0.053350598 | -1.047944186 | 0.000574 | 0.00210342 |
| Top |
| TissGene-miRNA for CMTM5 |
| Significantly anti-correlated miRNAs of TissGene across 28 cancer types (Gene-miRNA relations from TargetScanHuman Relsease 7.1, Conserved_Site_Context_Scores.txt.zip, 06.01.2016) (TCGA IlluminaHiSeq_miRNASeq, log2(RPM+1) data, version 2016-11-21) (TCGA IlluminaHiSeq_RNASeqV2, log2(normalized_count+1) data, version 2016-08-16) (Spearman’s Rank Correlation (p-value<0.05 and coefficient<-0.25)) |
| Cancer type | miRNA id | miRNA accession | P-val. | Coeff. | # samples |
| Top |
| TissGeneMut for CMTM5 |
| TissGeneSNV for CMTM5 |
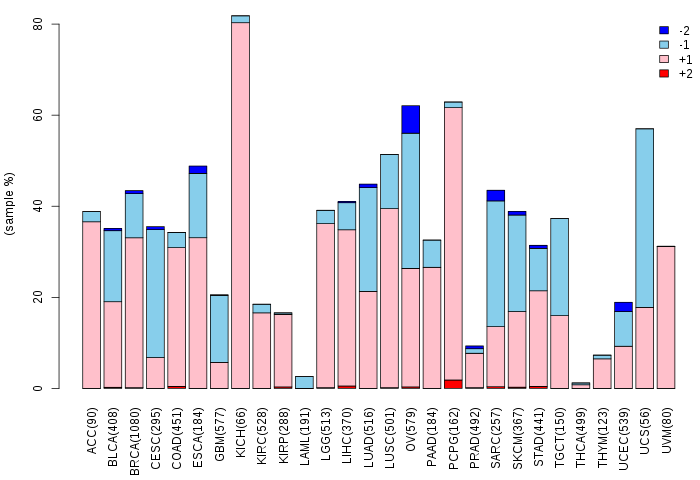
| nsSNV counts per each loci. Different colors of circles represent different cancer types. Circle size denotes number of samples. (TCGA somatic mutation (SNPs and small INDELs) data, version 2016-04-25) * Click on the image to enlarge it in a new window. |
 |
 |
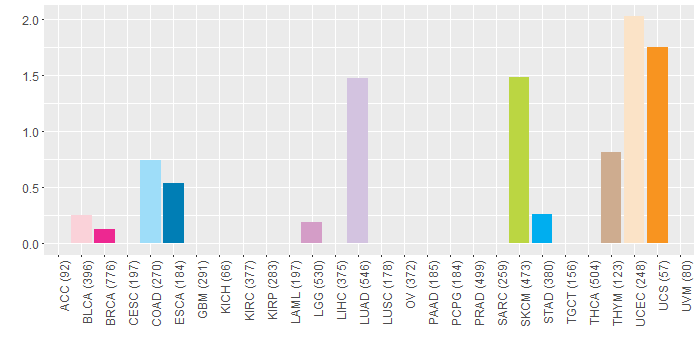
| Somatic nucleotide variants of TissGene across 28 cancer types (X-axis: cancer type and Y-axis: % of mutated samples) The numbers in parentheses are numbers of samples with mutation (nsSNVs). (TCGA somatic mutation (SNPs and small INDELs) data, version 2016-04-25) |
 |
| - nsSNVs sorted by frequency. |
| AAchange | Cancer type | # samples |
| p.P131S | SKCM | 1 |
| p.P117H | LUAD | 1 |
| p.D26E | UCEC | 1 |
| p.Q118* | HNSC | 1 |
| p.P105L | STAD | 1 |
| p.P125L | LUAD | 1 |
| p.R8Q | HNSC | 1 |
| p.E41K | UCEC | 1 |
| p.P91L | SKCM | 1 |
| p.A119D | COAD | 1 |
| p.G149R | UCEC | 1 |
| p.E14K | HNSC | 1 |
| p.A61D | LUAD | 1 |
| p.F52V | THYM | 1 |
| p.D86N | UCS | 1 |
| p.H33Y | SKCM | 1 |
| p.K34M | LUAD | 1 |
| p.A123V | LGG | 1 |
| p.S110F | SKCM | 1 |
| p.I48N | LUAD | 1 |
| p.S112L | BLCA | 1 |
| p.R84H | UCEC | 1 |
| p.A119S | ESCA | 1 |
| p.A24V | LUAD | 1 |
| p.G143S | SKCM | 1 |
| p.C153F | BRCA | 1 |
| p.A150V | SKCM | 1 |
| p.R116Q | HNSC | 1 |
| p.R87Q | UCEC | 1 |
| p.L96M | COAD | 1 |
| p.F73L | LUAD | 1 |
| p.G153E | SKCM | 1 |
| p.A62S | LUAD | 1 |
| Top |
| TissGeneCNV for CMTM5 |
| Copy number variations of TissGene across 28 cancer types (X-axis: cancer type and Y-axis: % of CNV samples) (TCGA Gistic2_CopyNumber_Gistic2_all_data_by_genes, Gistic2 copy number data, version 2016-08-16) |
 |
| Top |
| TissGeneFusions for CMTM5 |
| Fusion genes including TissGene (ChimerDB 3.0, 2016-12-01 and TCGA fusion Portal 2015-12-01) |
| Database | Src | Cancer type | Sample | Fusion gene | ORF | 5'-gene BP | 3'-gene BP |
| Top |
| TissGeneNet for CMTM5 |
| Co-expressed gene networks based on protein-protein interaction data (CePIN) (TCGA IlluminaHiSeq_RNASeqV2, pan-cancer normalized log2(norm_counts+1) data, version 2016-08-16) (PINA2 ppi data) |
| Top |
| TissGeneProg for CMTM5 |
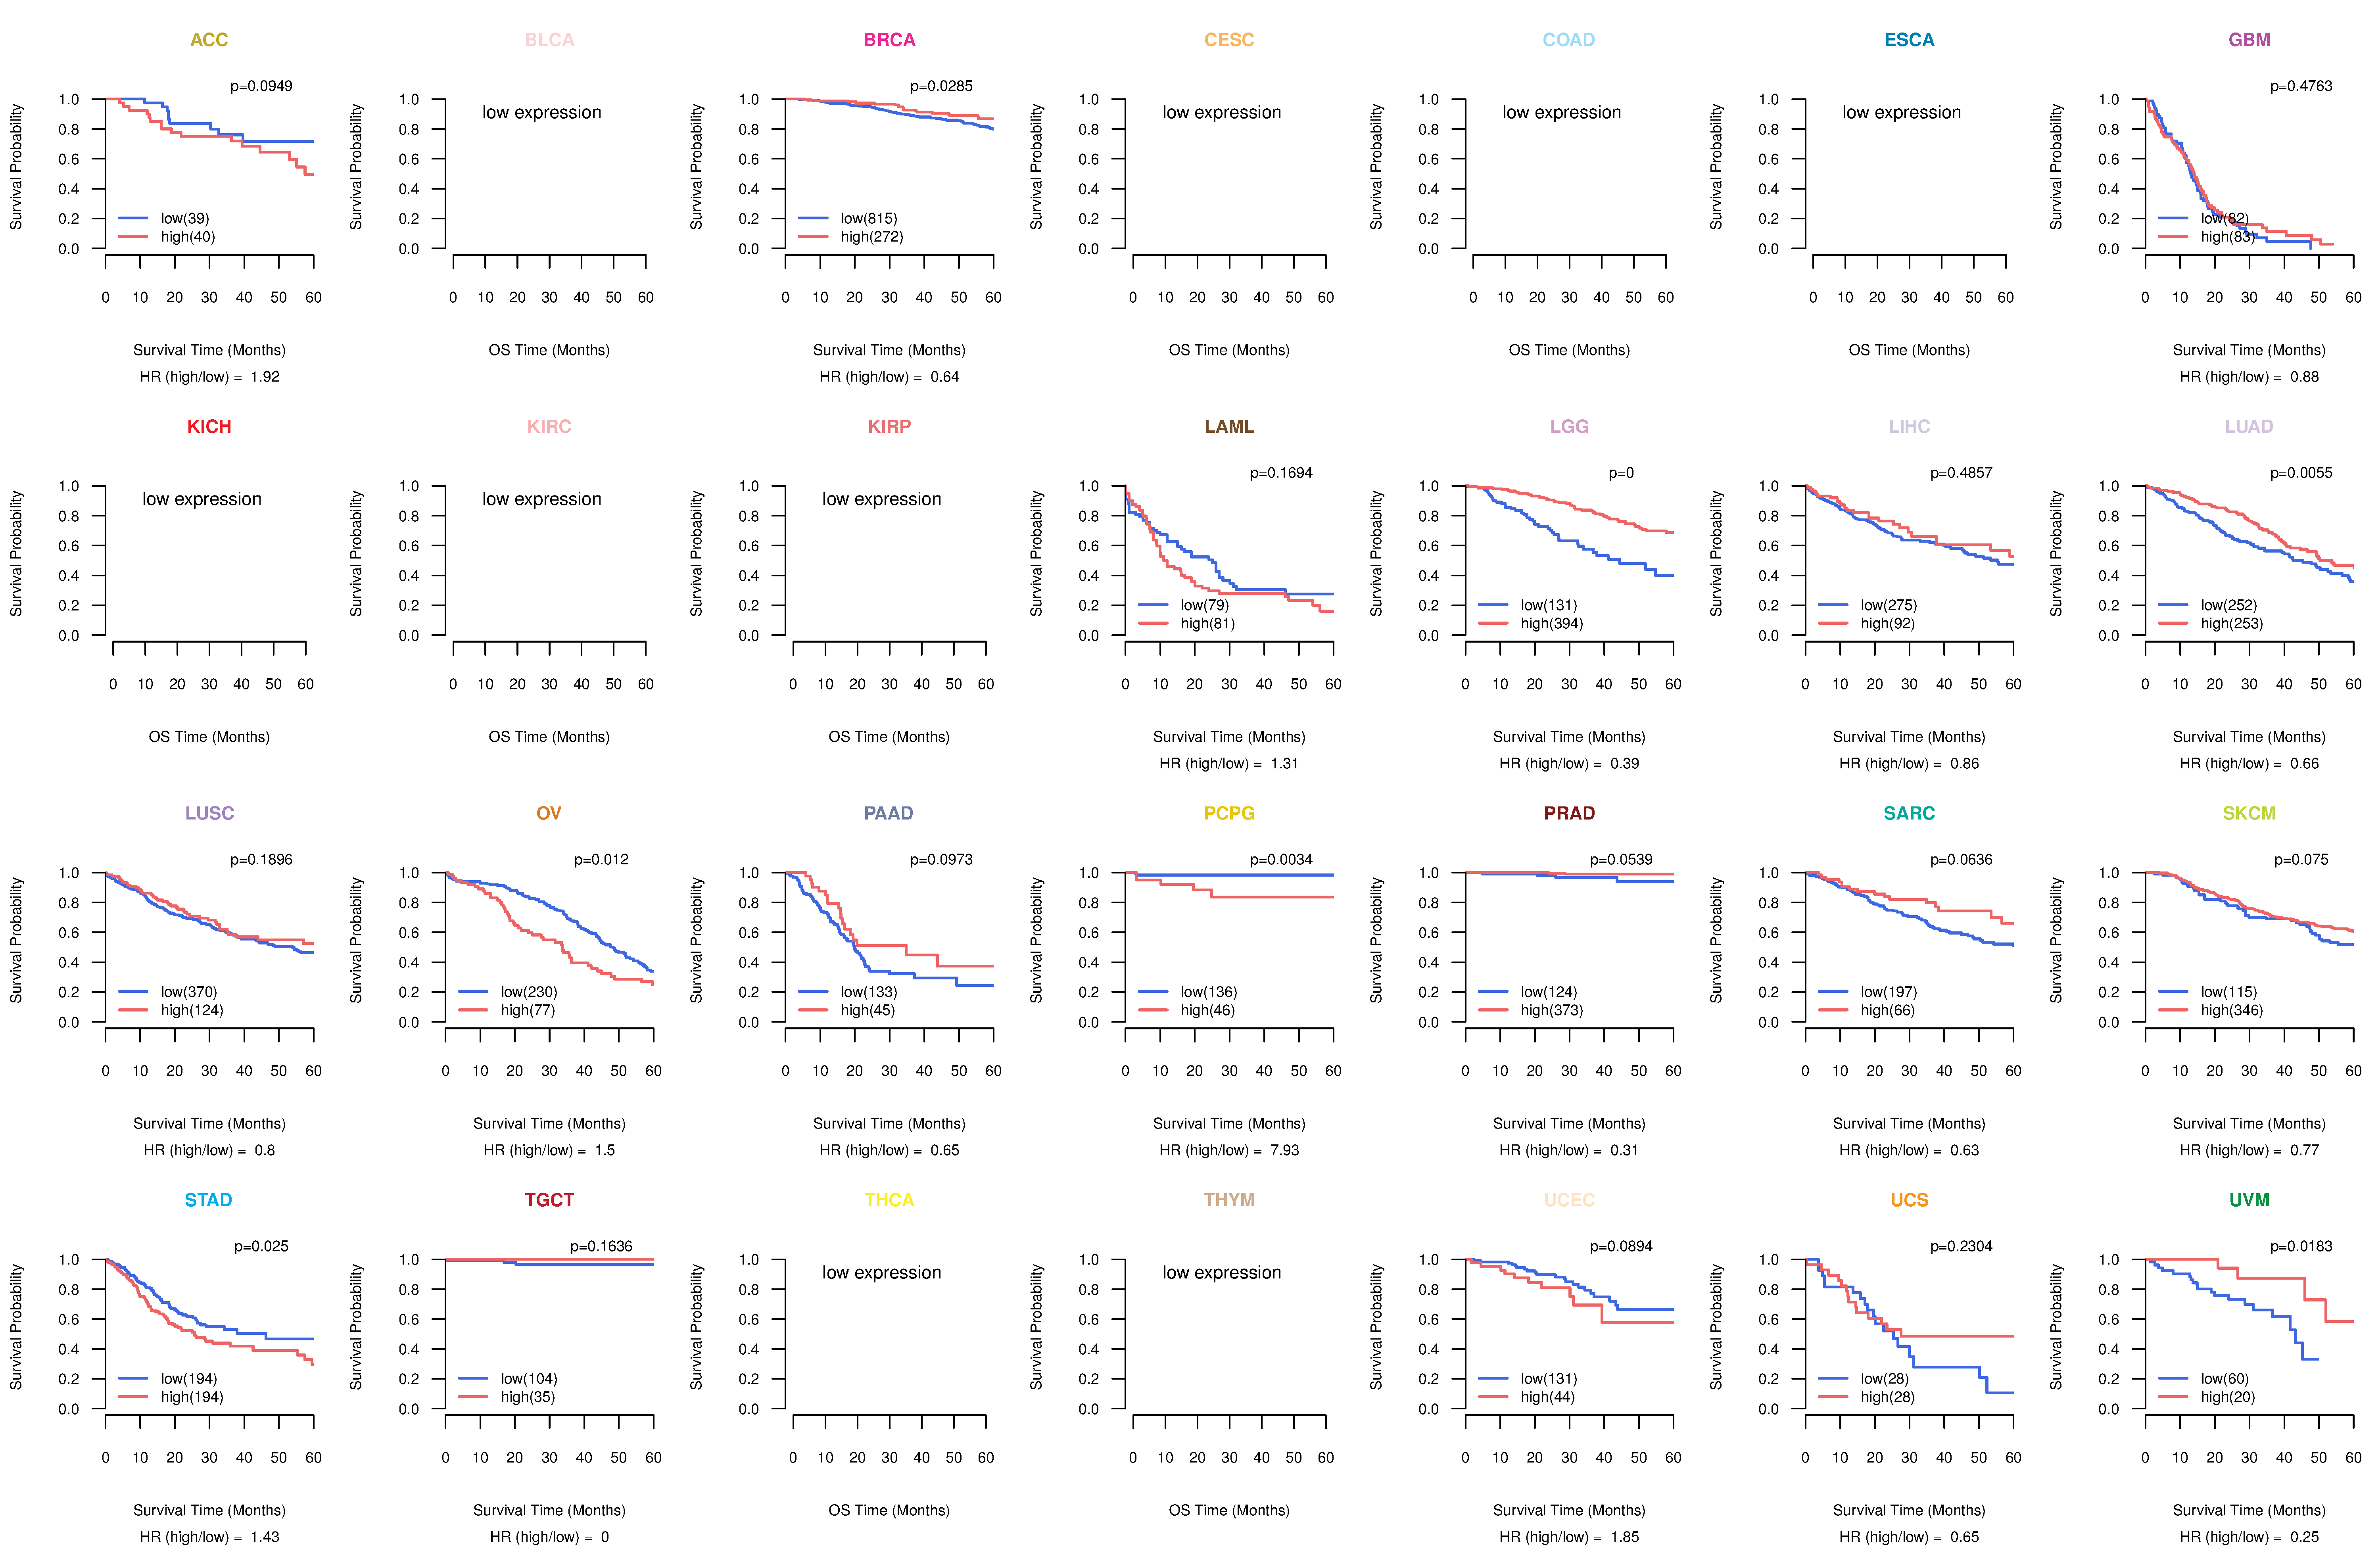
| Kaplan-Meier plots with logrank tests of overall survival (OS) using 28 cancer types (TCGA IlluminaHiSeq_RNASeqV2, pan-cancer normalized log2(norm_counts+1) data, version 2016-08-16) (TCGA clinicalMatrix, phenotype data, version 2016-04-27) * Click on the image to enlarge it in a new window. |
 |
| Kaplan-Meier plots with logrank test of relapse free survival (RFS) using 28 cancer types (TCGA IlluminaHiSeq_RNASeqV2, pan-cancer normalized log2(norm_counts+1) data, version 2016-08-16) (TCGA clinicalMatrix, phenotype data, version 2016-04-27) * Click on the image enlarge it in a new window. |
 |
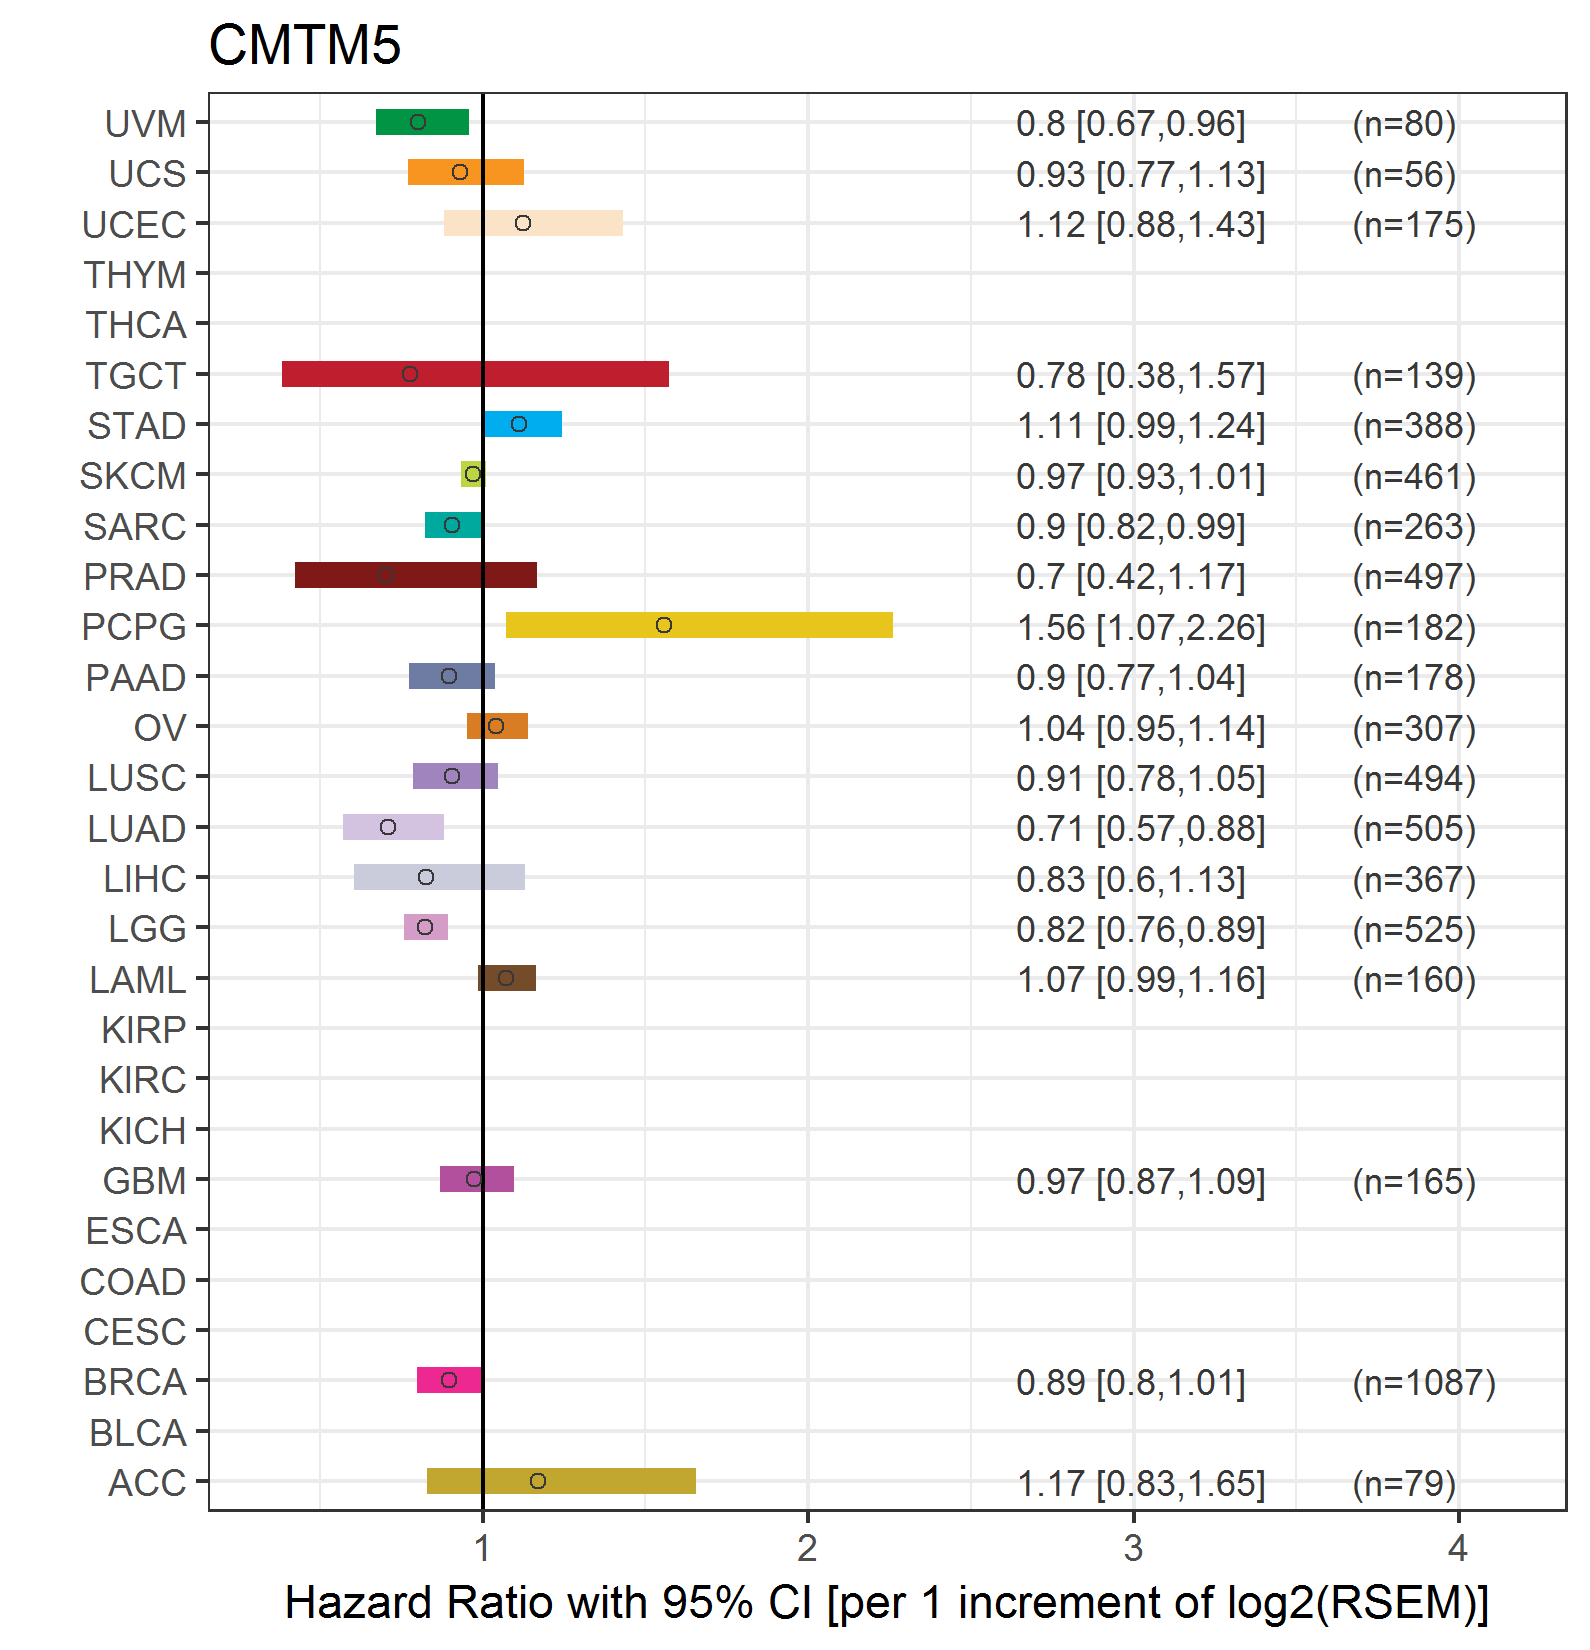
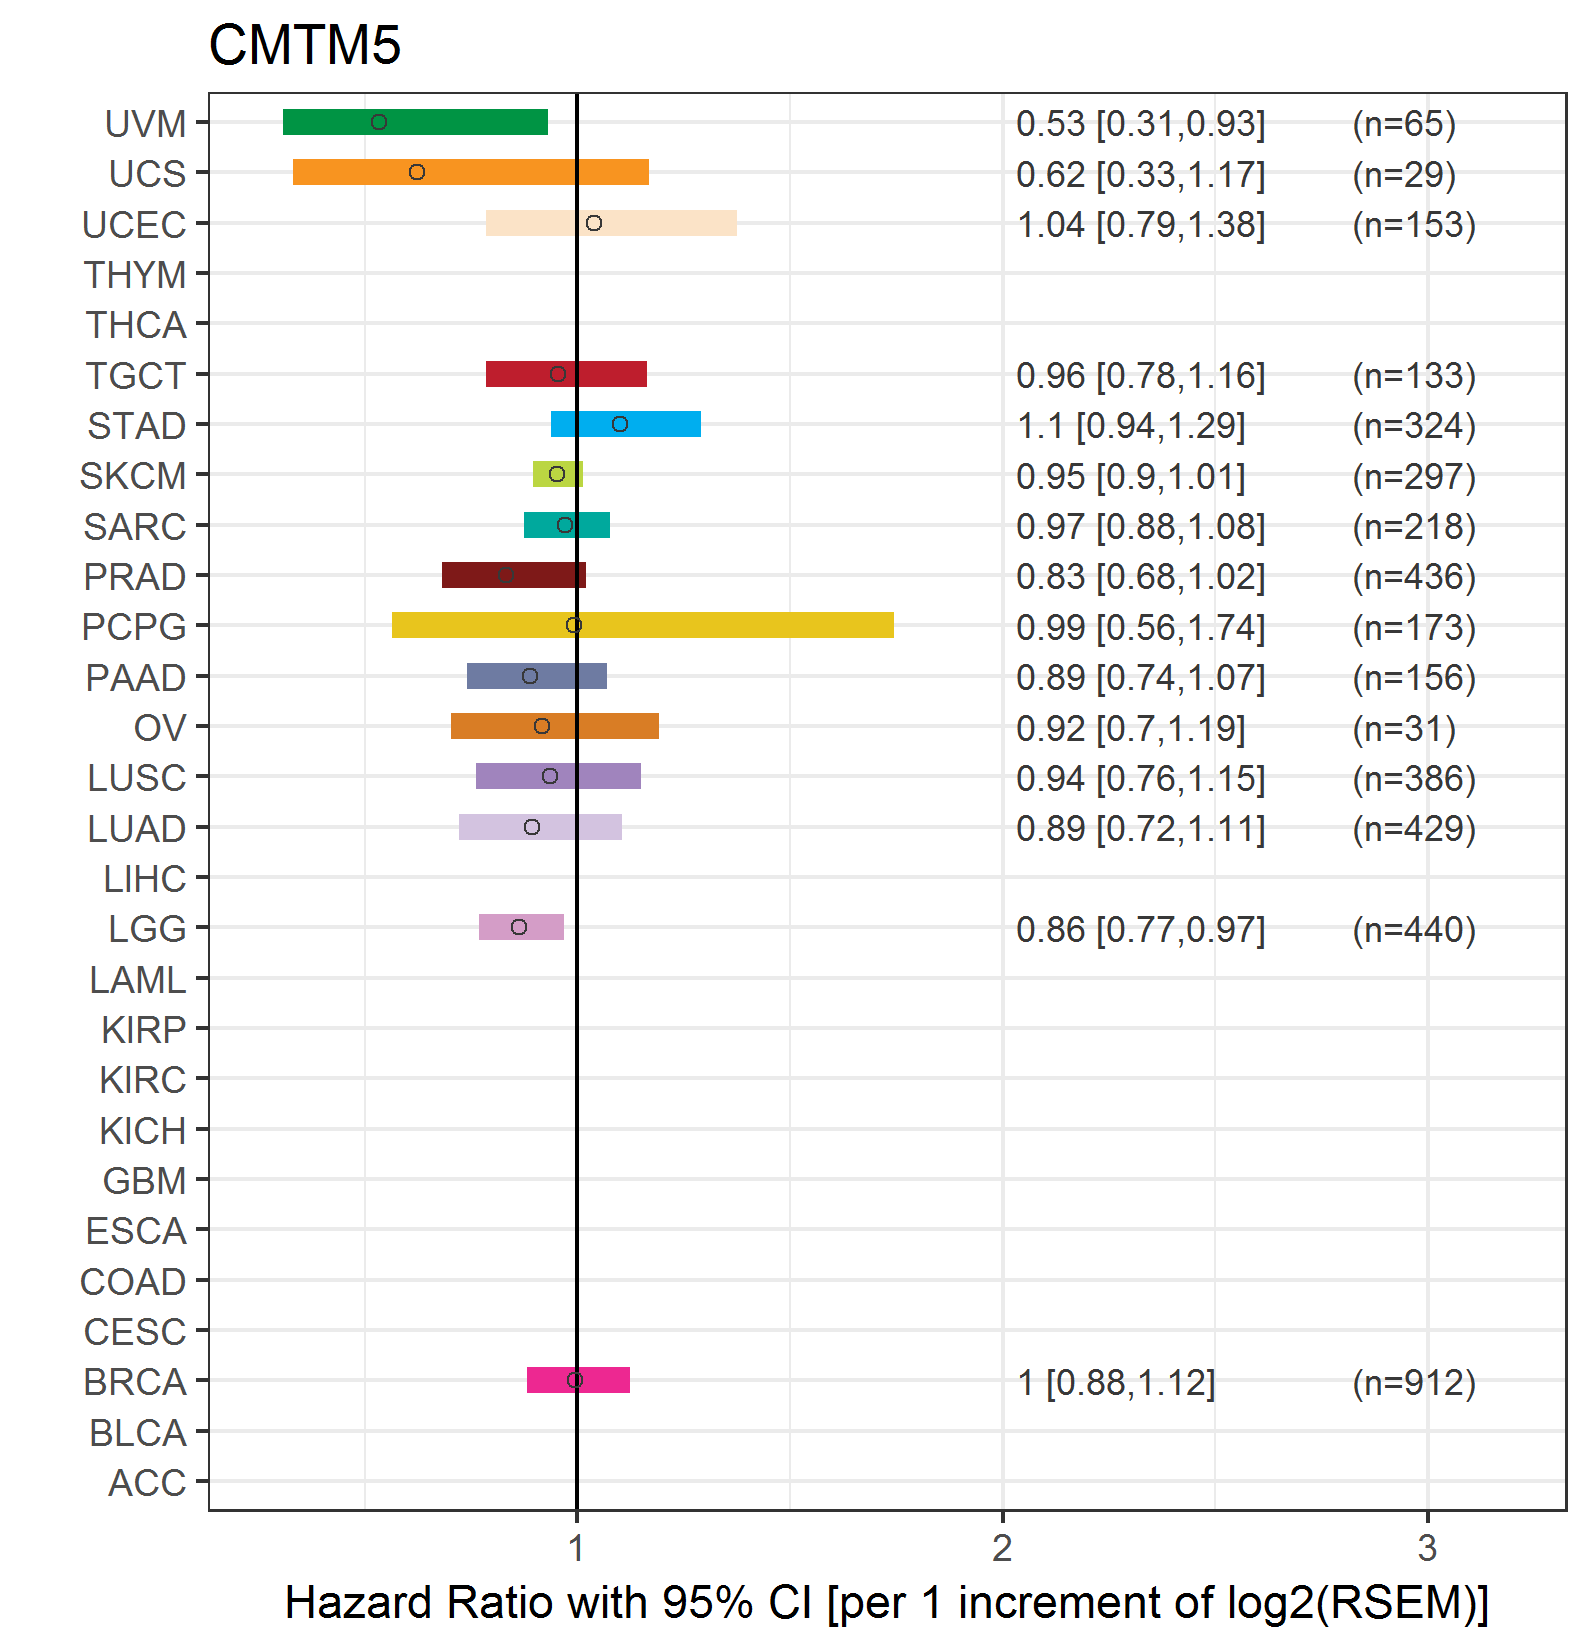
| Forest plot of Cox proportional hazard ratio (HR) and 95% CI of overall survival (OS) using 28 cancer types (TCGA IlluminaHiSeq_RNASeqV2, pan-cancer normalized log2(norm_counts+1) data, version 2016-08-16) (TCGA clinicalMatrix, phenotype data, version 2016-04-27) * Click on the image enlarge it in a new window. |
 |
| Forest plot of Cox proportional hazard ratio (HR) and 95% CI of relapse free survival (RFS) using 28 cancer types (TCGA IlluminaHiSeq_RNASeqV2, pan-cancer normalized log2(norm_counts+1) data, version 2016-08-16) (TCGA clinicalMatrix, phenotype data, version 2016-04-27) * Click on the image enlarge it in a new window. |
 |
| Top |
| TissGeneClin for CMTM5 |
| TissGeneDrug for CMTM5 |
| Drug information targeting TissGene (DrugBank Version 5.0.6, 2017-04-01) |
| DrugBank ID | Drug name | Drug activity | Drug type | Drug status |
| Top |
| TissGeneDisease for CMTM5 |
| Disease information associated with TissGene (DisGeNet, 2016-06-01) |
| Disease ID | Disease name | # pubmeds | Source |
| umls:C0023418 | leukemia | 1 | BeFree |
| umls:C0023470 | Myeloid Leukemia | 1 | BeFree |
|
Copyright 2016-Present - The University of Texas Health Science Center at Houston (UTHealth) Web File Viewing | How to Report, Fraud, Waste and Abuse | State of Texas | Statewide Search | Texas Homeland Security | Site Policies |