 |
| |
| |
| |
| |
| |
| |
|

| TissGeneSummary for ACSM1 |
 Gene summary Gene summary |
| Basic gene information | Gene symbol | ACSM1 |
| Gene name | acyl-CoA synthetase medium-chain family member 1 | |
| Synonyms | BUCS1|MACS1 | |
| Cytomap | UCSC genome browser: 16p12.3 | |
| Type of gene | protein-coding | |
| RefGenes | NM_052956.2, | |
| Description | Butyrate CoA ligaseacyl-coenzyme A synthetase ACSM1, mitochondrialbutyrate--CoA ligase 1butyryl Coenzyme A synthetase 1butyryl-coenzyme A synthetase 1lipoate-activating enzymemedium-chain acyl-CoA synthetasemiddle-chain acyl-CoA synthetase 1 | |
| Modification date | 20141207 | |
| dbXrefs | MIM : 614357 | |
| HGNC : HGNC | ||
| Ensembl : ENSG00000166743 | ||
| HPRD : 12551 | ||
| Vega : OTTHUMG00000131550 | ||
| Protein | UniProt: go to UniProt's Cross Reference DB Table | |
| Expression | CleanEX: HS_ACSM1 | |
| BioGPS: 116285 | ||
| Pathway | NCI Pathway Interaction Database: ACSM1 | |
| KEGG: ACSM1 | ||
| REACTOME: ACSM1 | ||
| Pathway Commons: ACSM1 | ||
| Context | iHOP: ACSM1 | |
| ligand binding site mutation search in PubMed: ACSM1 | ||
| UCL Cancer Institute: ACSM1 | ||
| Assigned class in TissGDB* | A | |
| Included tissue-specific gene expression resources | HPA,TiGER,GTEx | |
| Specific-tissues in normal samples (assigned by TissGDB using HPA, TiGER, and GTEx) | BreastTestis | |
| Cancer types related to the specific-tissues in cancer samples (assigned by TissGDB using TCGA) | BRCATGCT | |
| Reference showing the relevant tissue of ACSM1 | "15-prostaglandin dehydrogenase expression alone or in combination with ACSM1 defines a subgroup of the apocrine molecular subtype of breast carcinoma. (pmid:) go to article | |
| Description by TissGene annotations | Fused withOncogene | |
| * Class A consists of genes with literature evidence and is part of the cTissGenes. Class B consists of only cTissGenes without additional evidence. The remaining genes belong to Class C. |
| Gene ontology having evidence of Inferred from Direct Assay (IDA) from Entrez |
| GO ID | GO term | PubMed ID |
| Top |
| TissGeneExp for ACSM1 |
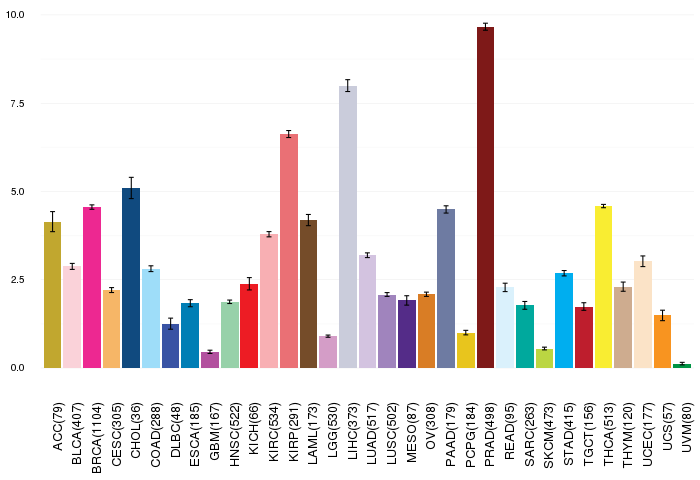
| Gene expressions across 28 cancer types (X-axis: cancer type and Y-axis: log2(norm_counts+1)) (TCGA IlluminaHiSeq_RNASeqV2, pan-cancer normalized log2(norm_counts+1) data, version 2016-08-16) |
 |
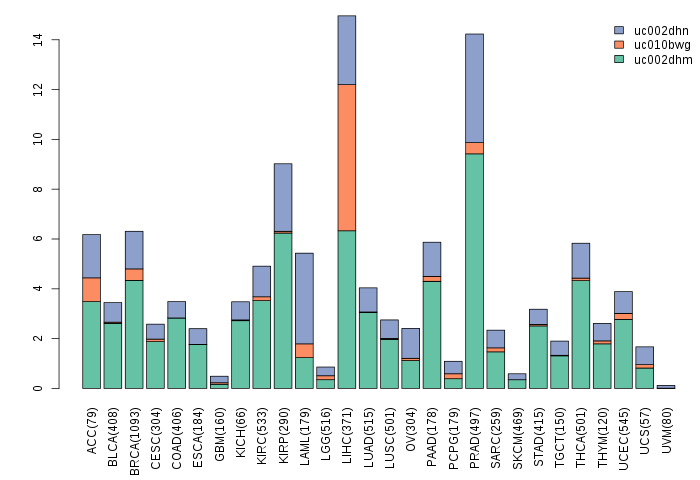
| Gene isoform expressions across 28 cancer types (X-axis: cancer type and Y-axis: log2(norm_counts+1)) (TCGA pan-cancer tcga_rsem_isoform_tpm, version 2016-09-01) |
 |
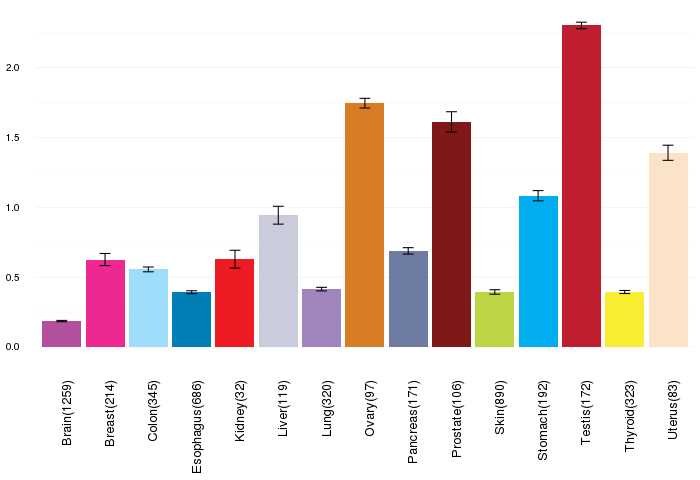
| Gene expressions across normal tissues of GTEx data (GTEx GTEx_Analysis_v6_RNA-seq_RNA-SeQCv1.1.8_gene_rpkm.gct) - Here, we shows the matched tissue types only among our 28 cancer types. |
 |
| Different expressions across 14 cancer types with more than 10 samples between matched tumors and normals (X-axis: cancer type and Y-axis: log2(norm_counts+1)) (TCGA IlluminaHiSeq_RNASeqV2, pan-cancer normalized log2(norm_counts+1) data, version 2016-08-16) |
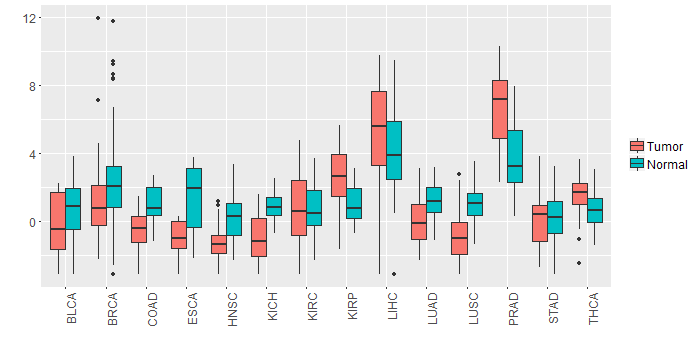 |
| - Significantly differentially expressed cancer types and information. (|Fold change|>1 and FDR<0.05) |
| Cancer type | Mean(exp) in tumor | Mean(exp) in matched normal | Log2FC | P-val. | FDR |
| LUSC | -0.904829066 | 1.066649365 | -1.971478431 | 2.11E-12 | 9.45E-12 |
| COAD | -0.484542415 | 0.975784509 | -1.460326923 | 2.08E-05 | 8.80E-05 |
| PRAD | 6.64402297 | 3.715636432 | 2.928386538 | 2.06E-11 | 5.84E-10 |
| KICH | -0.964675184 | 0.903848816 | -1.868524 | 1.13E-06 | 4.23E-06 |
| HNSC | -1.297290626 | 0.262172165 | -1.559462791 | 1.63E-08 | 1.88E-07 |
| LUAD | 0.050716471 | 1.197042333 | -1.146325862 | 2.79E-07 | 1.02E-06 |
| BRCA | 1.048595237 | 2.095245237 | -1.04665 | 0.00141 | 0.002716359 |
| KIRP | 2.535911191 | 1.029398691 | 1.5065125 | 0.000174 | 0.0005605 |
| Top |
| TissGene-miRNA for ACSM1 |
| Significantly anti-correlated miRNAs of TissGene across 28 cancer types (Gene-miRNA relations from TargetScanHuman Relsease 7.1, Conserved_Site_Context_Scores.txt.zip, 06.01.2016) (TCGA IlluminaHiSeq_miRNASeq, log2(RPM+1) data, version 2016-11-21) (TCGA IlluminaHiSeq_RNASeqV2, log2(normalized_count+1) data, version 2016-08-16) (Spearman’s Rank Correlation (p-value<0.05 and coefficient<-0.25)) |
| Cancer type | miRNA id | miRNA accession | P-val. | Coeff. | # samples |
| Top |
| TissGeneMut for ACSM1 |
| TissGeneSNV for ACSM1 |
| nsSNV counts per each loci. Different colors of circles represent different cancer types. Circle size denotes number of samples. (TCGA somatic mutation (SNPs and small INDELs) data, version 2016-04-25) * Click on the image to enlarge it in a new window. |
 |
 |
| Somatic nucleotide variants of TissGene across 28 cancer types (X-axis: cancer type and Y-axis: % of mutated samples) The numbers in parentheses are numbers of samples with mutation (nsSNVs). (TCGA somatic mutation (SNPs and small INDELs) data, version 2016-04-25) |
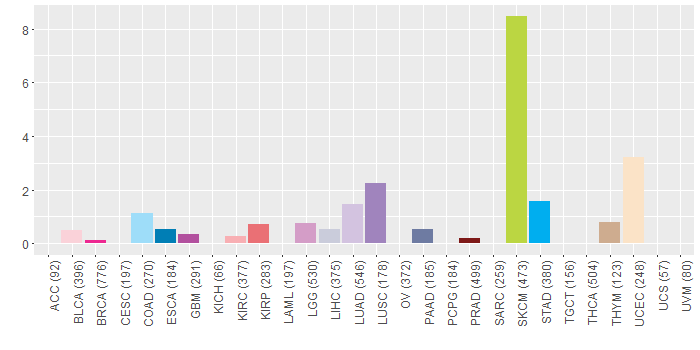 |
| - nsSNVs sorted by frequency. |
| AAchange | Cancer type | # samples |
| p.H20Y | SKCM | 4 |
| p.S16F | SKCM | 2 |
| p.R133Q | UCEC | 2 |
| p.P13S | SKCM | 2 |
| p.D328N | SKCM | 2 |
| p.E219K | SKCM | 2 |
| p.E224K | SKCM | 2 |
| p.S406R | LUAD | 1 |
| p.T95I | SKCM | 1 |
| p.R255Q | SKCM | 1 |
| p.A487T | LUSC | 1 |
| p.F199L | SKCM | 1 |
| p.R39K | SKCM | 1 |
| p.T217A | LIHC | 1 |
| p.E371K | SKCM | 1 |
| p.P13L | SKCM | 1 |
| p.R8W | STAD | 1 |
| p.E183K | SKCM | 1 |
| p.T35S | SKCM | 1 |
| p.P208L | ESCA | 1 |
| p.R322L | UCEC | 1 |
| p.E134K | SKCM | 1 |
| p.M5I | SKCM | 1 |
| p.K216N | READ | 1 |
| p.W315L | SKCM | 1 |
| p.S33* | LUAD | 1 |
| p.R158* | BLCA | 1 |
| p.P122S | SKCM | 1 |
| p.E573K | SKCM | 1 |
| p.E568K | SKCM | 1 |
| p.G96E | SKCM | 1 |
| p.I175V | LUSC | 1 |
| p.S331_splice | LUSC | 1 |
| p.H292Y | SKCM | 1 |
| p.F35L | GBM | 1 |
| p.P295L | LUAD | 1 |
| p.E353K | HNSC | 1 |
| p.P194L | SKCM | 1 |
| p.G92E | UCEC | 1 |
| p.R570W | SKCM | 1 |
| p.G454D | SKCM | 1 |
| p.P246H | KIRP | 1 |
| p.D452G | LIHC | 1 |
| p.R28H | READ | 1 |
| p.M389I | SKCM | 1 |
| p.L254I | KIRP | 1 |
| p.R322Q | COAD | 1 |
| p.Q110* | LUAD | 1 |
| p.L266M | PAAD | 1 |
| p.S78N | SKCM | 1 |
| p.V347M | UCEC | 1 |
| p.V135I | HNSC | 1 |
| p.K455N | UCEC | 1 |
| p.E123Q | HNSC | 1 |
| p.W40X | SKCM | 1 |
| p.S57R | LUAD | 1 |
| p.R322Q | UCEC | 1 |
| p.S256N | COAD | 1 |
| p.E136K | SKCM | 1 |
| p.P72L | SKCM | 1 |
| p.D86N | SKCM | 1 |
| p.F49V | KIRC | 1 |
| p.Y54F | LUAD | 1 |
| p.P208T | THYM | 1 |
| p.A243S | LUAD | 1 |
| p.F35C | COAD | 1 |
| p.G9R | SKCM | 1 |
| p.R96H | READ | 1 |
| p.W40* | SKCM | 1 |
| p.D219N | SKCM | 1 |
| p.T134S | LGG | 1 |
| p.P394S | SKCM | 1 |
| p.R419I | UCEC | 1 |
| p.I143F | LUSC | 1 |
| p.P70L | SKCM | 1 |
| p.R133Q | STAD | 1 |
| p.V398I | UCEC | 1 |
| p.R39G | LGG | 1 |
| p.P38R | BRCA | 1 |
| p.K258N | COAD | 1 |
| p.R221W | SKCM | 1 |
| p.E47K | SKCM | 1 |
| p.F314L | SKCM | 1 |
| p.V51A | LGG | 1 |
| p.S31F | SKCM | 1 |
| p.R322Q | SKCM | 1 |
| p.P394L | SKCM | 1 |
| p.R28H | COAD | 1 |
| p.A73V | STAD | 1 |
| p.S406N | STAD | 1 |
| p.R133G | BLCA | 1 |
| p.D435N | SKCM | 1 |
| p.P233H | PRAD | 1 |
| p.G111E | SKCM | 1 |
| p.F248L | HNSC | 1 |
| p.G131R | HNSC | 1 |
| p.P543L | SKCM | 1 |
| p.E202K | SKCM | 1 |
| p.S227I | LUAD | 1 |
| p.K89R | LGG | 1 |
| p.E34D | STAD | 1 |
| p.M8I | SKCM | 1 |
| p.R133Q | SKCM | 1 |
| p.G231C | UCEC | 1 |
| p.G105D | SKCM | 1 |
| p.I71N | LUAD | 1 |
| p.K258N | STAD | 1 |
| p.S319F | SKCM | 1 |
| p.R322Q | STAD | 1 |
| Top |
| TissGeneCNV for ACSM1 |
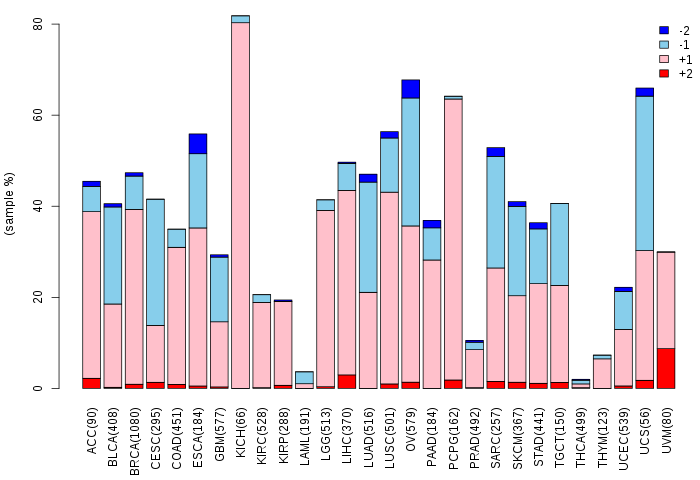
| Copy number variations of TissGene across 28 cancer types (X-axis: cancer type and Y-axis: % of CNV samples) (TCGA Gistic2_CopyNumber_Gistic2_all_data_by_genes, Gistic2 copy number data, version 2016-08-16) |
 |
| Top |
| TissGeneFusions for ACSM1 |
| Fusion genes including TissGene (ChimerDB 3.0, 2016-12-01 and TCGA fusion Portal 2015-12-01) |
| Database | Src | Cancer type | Sample | Fusion gene | ORF | 5'-gene BP | 3'-gene BP |
| Chimerdb3.0 | ChiTaRs | NA | BF932027 | KAT2A-ACSM1 | chr17:40265561 | chr16:20688194 | |
| Chimerdb3.0 | FusionScan | PRAD | TCGA-YL-A8SR-01B | ACSM2A-ACSM1 | In-Frame | chr16:20494499 | chr16:20635537 |
| TCGAfusionPortal | PRADA | KIRC | TCGA-BP-4787-01A | IKBKE-ACSM1 | In-frame | Chr1:206667324 | Chr16:20651906 |
| TCGAfusionPortal | PRADA | PRAD | TCGA-EJ-A46G-01A | ACSM1-DNAH3 | In-frame | Chr16:20681149 | Chr16:21128660 |
| Top |
| TissGeneNet for ACSM1 |
| Co-expressed gene networks based on protein-protein interaction data (CePIN) (TCGA IlluminaHiSeq_RNASeqV2, pan-cancer normalized log2(norm_counts+1) data, version 2016-08-16) (PINA2 ppi data) |
| Top |
| TissGeneProg for ACSM1 |
| Kaplan-Meier plots with logrank tests of overall survival (OS) using 28 cancer types (TCGA IlluminaHiSeq_RNASeqV2, pan-cancer normalized log2(norm_counts+1) data, version 2016-08-16) (TCGA clinicalMatrix, phenotype data, version 2016-04-27) * Click on the image to enlarge it in a new window. |
 |
| Kaplan-Meier plots with logrank test of relapse free survival (RFS) using 28 cancer types (TCGA IlluminaHiSeq_RNASeqV2, pan-cancer normalized log2(norm_counts+1) data, version 2016-08-16) (TCGA clinicalMatrix, phenotype data, version 2016-04-27) * Click on the image enlarge it in a new window. |
 |
| Forest plot of Cox proportional hazard ratio (HR) and 95% CI of overall survival (OS) using 28 cancer types (TCGA IlluminaHiSeq_RNASeqV2, pan-cancer normalized log2(norm_counts+1) data, version 2016-08-16) (TCGA clinicalMatrix, phenotype data, version 2016-04-27) * Click on the image enlarge it in a new window. |
 |
| Forest plot of Cox proportional hazard ratio (HR) and 95% CI of relapse free survival (RFS) using 28 cancer types (TCGA IlluminaHiSeq_RNASeqV2, pan-cancer normalized log2(norm_counts+1) data, version 2016-08-16) (TCGA clinicalMatrix, phenotype data, version 2016-04-27) * Click on the image enlarge it in a new window. |
 |
| Top |
| TissGeneClin for ACSM1 |
| TissGeneDrug for ACSM1 |
| Drug information targeting TissGene (DrugBank Version 5.0.6, 2017-04-01) |
| DrugBank ID | Drug name | Drug activity | Drug type | Drug status |
| Top |
| TissGeneDisease for ACSM1 |
| Disease information associated with TissGene (DisGeNet, 2016-06-01) |
| Disease ID | Disease name | # pubmeds | Source |
| umls:C0036341 | Schizophrenia | 3 | BeFree,GAD |
| umls:C0020538 | Hypertensive disease | 1 | GAD |
| umls:C0024121 | Lung Neoplasms | 1 | CTD_human |
| umls:C0041696 | Unipolar Depression | 1 | BeFree |
| umls:C0524620 | Metabolic Syndrome X | 1 | BeFree |
| umls:C1269683 | Major Depressive Disorder | 1 | BeFree |
|
Copyright 2016-Present - The University of Texas Health Science Center at Houston (UTHealth) Web File Viewing | How to Report, Fraud, Waste and Abuse | State of Texas | Statewide Search | Texas Homeland Security | Site Policies |