 |
| |
| |
| |
| |
| |
| |
|

| TissGeneSummary for LRG1 |
 Gene summary Gene summary |
| Basic gene information | Gene symbol | LRG1 |
| Gene name | leucine-rich alpha-2-glycoprotein 1 | |
| Synonyms | HMFT1766|LRG | |
| Cytomap | UCSC genome browser: 19p13.3 | |
| Type of gene | protein-coding | |
| RefGenes | NM_052972.2, | |
| Description | 1300008B03Rik2310031E04Rikleucine rich alpha 2 glycoproteinleucine-rich alpha-2-glycoprotein | |
| Modification date | 20141207 | |
| dbXrefs | MIM : 611289 | |
| HGNC : HGNC | ||
| HPRD : 10056 | ||
| Protein | UniProt: go to UniProt's Cross Reference DB Table | |
| Expression | CleanEX: HS_LRG1 | |
| BioGPS: 116844 | ||
| Pathway | NCI Pathway Interaction Database: LRG1 | |
| KEGG: LRG1 | ||
| REACTOME: LRG1 | ||
| Pathway Commons: LRG1 | ||
| Context | iHOP: LRG1 | |
| ligand binding site mutation search in PubMed: LRG1 | ||
| UCL Cancer Institute: LRG1 | ||
| Assigned class in TissGDB* | B | |
| Included tissue-specific gene expression resources | HPA,TiGER,GTEx | |
| Specific-tissues in normal samples (assigned by TissGDB using HPA, TiGER, and GTEx) | Liver | |
| Cancer types related to the specific-tissues in cancer samples (assigned by TissGDB using TCGA) | LIHC | |
| Reference showing the relevant tissue of LRG1 | ||
| Description by TissGene annotations | ||
| * Class A consists of genes with literature evidence and is part of the cTissGenes. Class B consists of only cTissGenes without additional evidence. The remaining genes belong to Class C. |
| Gene ontology having evidence of Inferred from Direct Assay (IDA) from Entrez |
| GO ID | GO term | PubMed ID |
| Top |
| TissGeneExp for LRG1 |
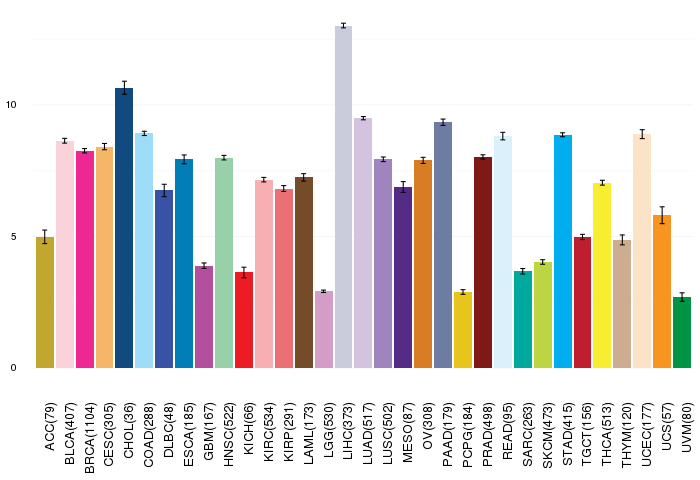
| Gene expressions across 28 cancer types (X-axis: cancer type and Y-axis: log2(norm_counts+1)) (TCGA IlluminaHiSeq_RNASeqV2, pan-cancer normalized log2(norm_counts+1) data, version 2016-08-16) |
 |
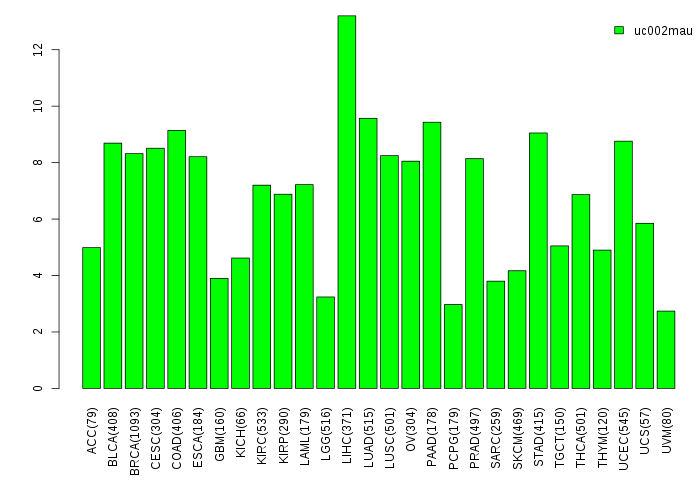
| Gene isoform expressions across 28 cancer types (X-axis: cancer type and Y-axis: log2(norm_counts+1)) (TCGA pan-cancer tcga_rsem_isoform_tpm, version 2016-09-01) |
 |
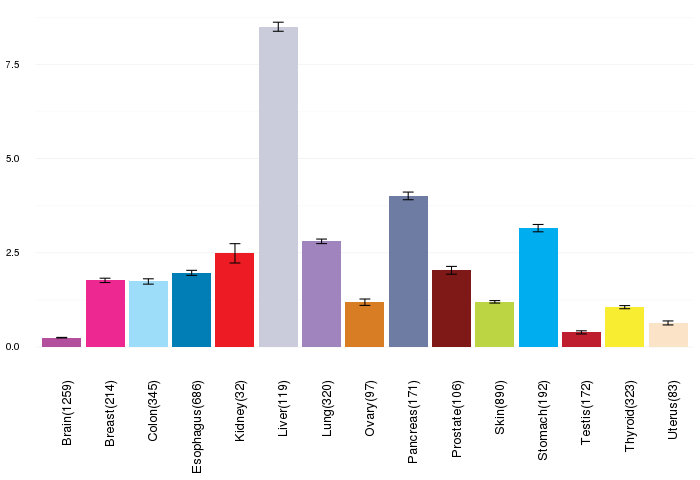
| Gene expressions across normal tissues of GTEx data (GTEx GTEx_Analysis_v6_RNA-seq_RNA-SeQCv1.1.8_gene_rpkm.gct) - Here, we shows the matched tissue types only among our 28 cancer types. |
 |
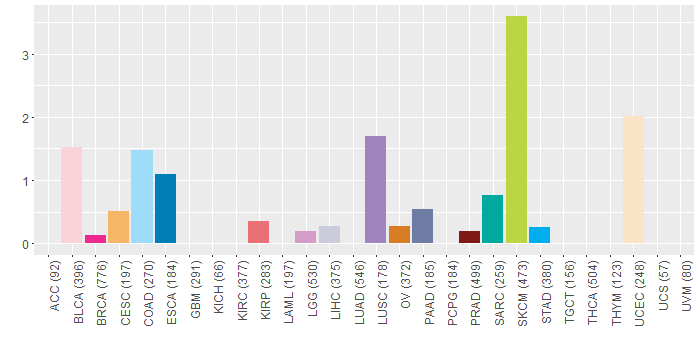
| Different expressions across 14 cancer types with more than 10 samples between matched tumors and normals (X-axis: cancer type and Y-axis: log2(norm_counts+1)) (TCGA IlluminaHiSeq_RNASeqV2, pan-cancer normalized log2(norm_counts+1) data, version 2016-08-16) |
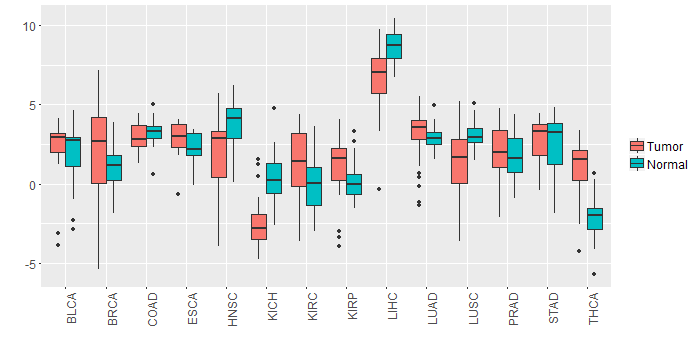 |
| - Significantly differentially expressed cancer types and information. (|Fold change|>1 and FDR<0.05) |
| Cancer type | Mean(exp) in tumor | Mean(exp) in matched normal | Log2FC | P-val. | FDR |
| THCA | 1.073652603 | -2.178915194 | 3.252567797 | 9.72E-24 | 8.97E-22 |
| KIRC | 1.351510371 | 0.026957594 | 1.324552778 | 2.45E-05 | 5.54E-05 |
| LIHC | 6.780720705 | 8.728520705 | -1.9478 | 3.85E-09 | 3.73E-08 |
| LUSC | 1.306091254 | 3.099344195 | -1.793252941 | 5.54E-07 | 1.43E-06 |
| KICH | -2.490565295 | 0.307242705 | -2.797808 | 3.14E-07 | 1.30E-06 |
| BRCA | 2.041294143 | 1.009262564 | 1.032031579 | 0.000274 | 0.000573974 |
| HNSC | 1.975407077 | 3.729681495 | -1.754274419 | 6.10E-05 | 0.000290784 |
| Top |
| TissGene-miRNA for LRG1 |
| Significantly anti-correlated miRNAs of TissGene across 28 cancer types (Gene-miRNA relations from TargetScanHuman Relsease 7.1, Conserved_Site_Context_Scores.txt.zip, 06.01.2016) (TCGA IlluminaHiSeq_miRNASeq, log2(RPM+1) data, version 2016-11-21) (TCGA IlluminaHiSeq_RNASeqV2, log2(normalized_count+1) data, version 2016-08-16) (Spearman’s Rank Correlation (p-value<0.05 and coefficient<-0.25)) |
| Cancer type | miRNA id | miRNA accession | P-val. | Coeff. | # samples |
| Top |
| TissGeneMut for LRG1 |
| TissGeneSNV for LRG1 |
| nsSNV counts per each loci. Different colors of circles represent different cancer types. Circle size denotes number of samples. (TCGA somatic mutation (SNPs and small INDELs) data, version 2016-04-25) * Click on the image to enlarge it in a new window. |
 |
 |
| Somatic nucleotide variants of TissGene across 28 cancer types (X-axis: cancer type and Y-axis: % of mutated samples) The numbers in parentheses are numbers of samples with mutation (nsSNVs). (TCGA somatic mutation (SNPs and small INDELs) data, version 2016-04-25) |
 |
| - nsSNVs sorted by frequency. |
| AAchange | Cancer type | # samples |
| p.R312C | SKCM | 3 |
| p.P133S | COAD | 3 |
| p.S3F | SKCM | 2 |
| p.G162S | ESCA | 1 |
| p.Q235* | SARC | 1 |
| p.S172Y | UCEC | 1 |
| p.A91T | COAD | 1 |
| p.S108L | SKCM | 1 |
| p.Q315E | CESC | 1 |
| p.L128M | UCEC | 1 |
| p.R328C | UCEC | 1 |
| p.P276R | BLCA | 1 |
| p.V275M | OV | 1 |
| p.G228E | SKCM | 1 |
| p.A334V | SKCM | 1 |
| p.E277Q | HNSC | 1 |
| p.Q315* | SKCM | 1 |
| p.A140G | KIRP | 1 |
| p.P181S | SKCM | 1 |
| p.R291W | UCEC | 1 |
| p.E201D | BLCA | 1 |
| p.P180H | BLCA | 1 |
| p.G134S | SKCM | 1 |
| p.L26M | UCEC | 1 |
| p.R113Q | BRCA | 1 |
| p.T188I | SKCM | 1 |
| p.R250W | LUSC | 1 |
| p.K318R | LGG | 1 |
| p.I15T | LUSC | 1 |
| p.P205S | UCEC | 1 |
| p.R191C | ESCA | 1 |
| p.W159G | LUSC | 1 |
| p.E61K | BLCA | 1 |
| p.S346F | SKCM | 1 |
| p.N174S | BLCA | 1 |
| p.L104P | SKCM | 1 |
| p.Y311C | LIHC | 1 |
| p.E110K | SKCM | 1 |
| p.E105K | SKCM | 1 |
| p.T327M | PAAD | 1 |
| p.P300S | STAD | 1 |
| p.P133L | SKCM | 1 |
| p.G254D | SKCM | 1 |
| p.R328H | BLCA | 1 |
| p.L160V | SARC | 1 |
| p.Q315X | SKCM | 1 |
| p.P276L | PRAD | 1 |
| p.T188I | HNSC | 1 |
| p.S92C | HNSC | 1 |
| Top |
| TissGeneCNV for LRG1 |
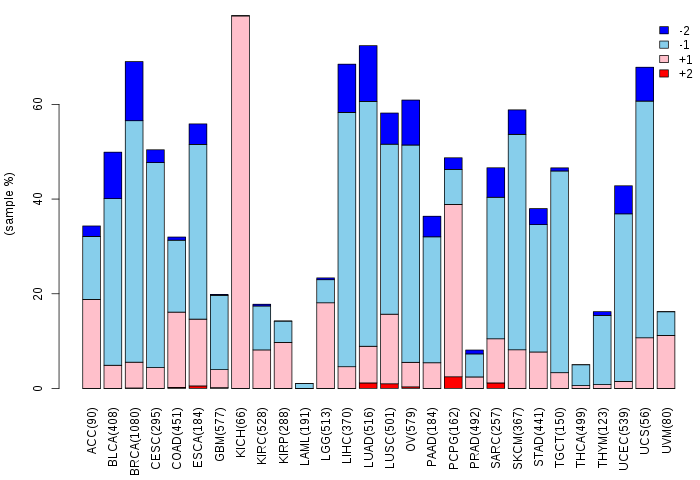
| Copy number variations of TissGene across 28 cancer types (X-axis: cancer type and Y-axis: % of CNV samples) (TCGA Gistic2_CopyNumber_Gistic2_all_data_by_genes, Gistic2 copy number data, version 2016-08-16) |
 |
| Top |
| TissGeneFusions for LRG1 |
| Fusion genes including TissGene (ChimerDB 3.0, 2016-12-01 and TCGA fusion Portal 2015-12-01) |
| Database | Src | Cancer type | Sample | Fusion gene | ORF | 5'-gene BP | 3'-gene BP |
| Top |
| TissGeneNet for LRG1 |
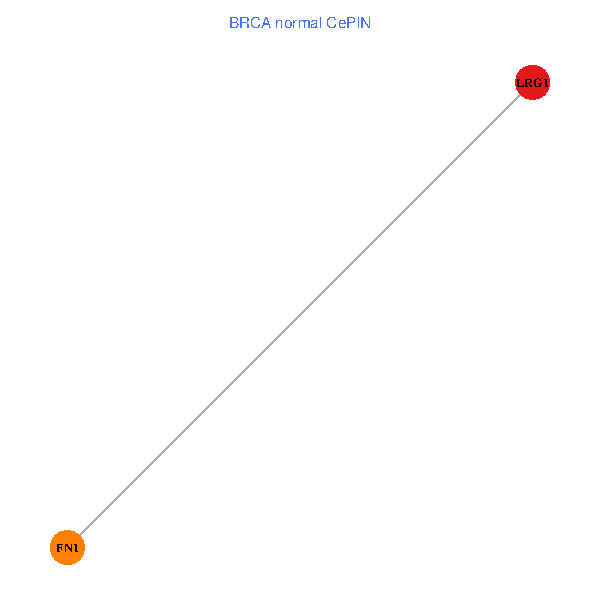
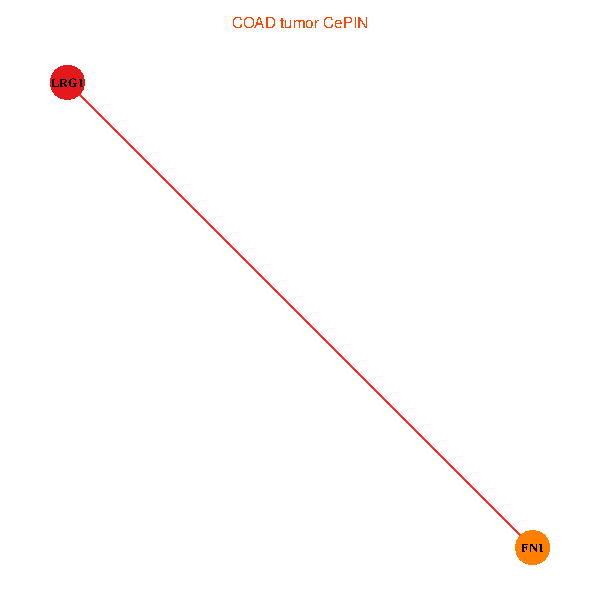
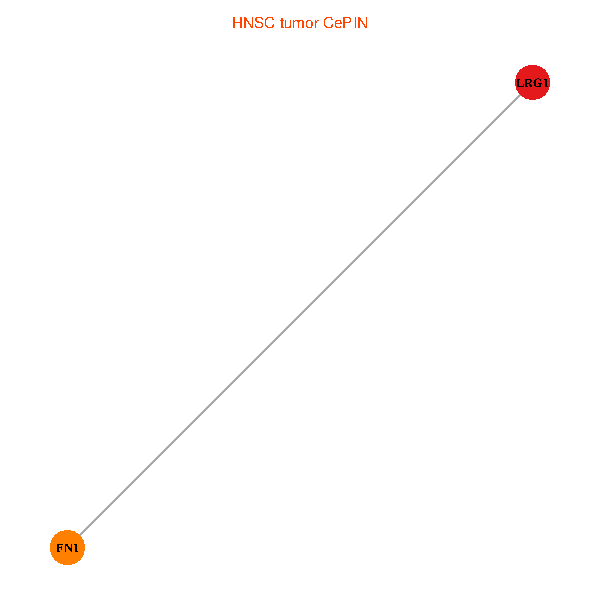
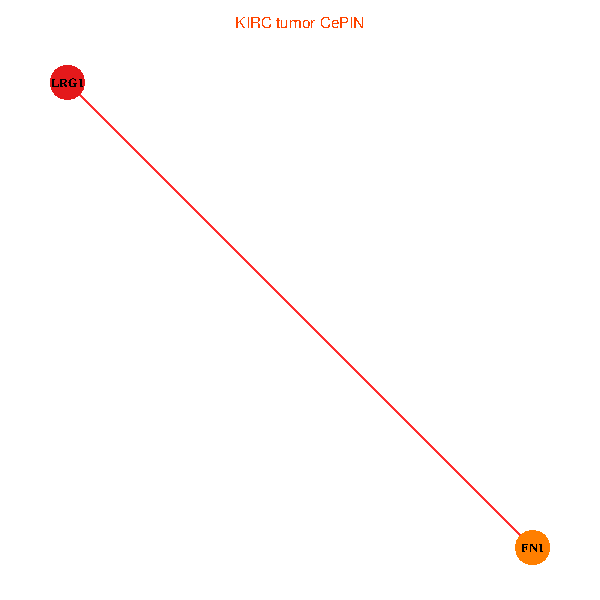
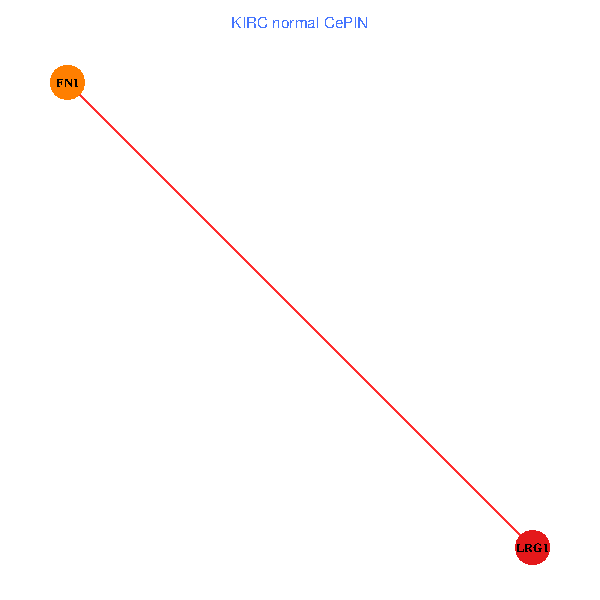
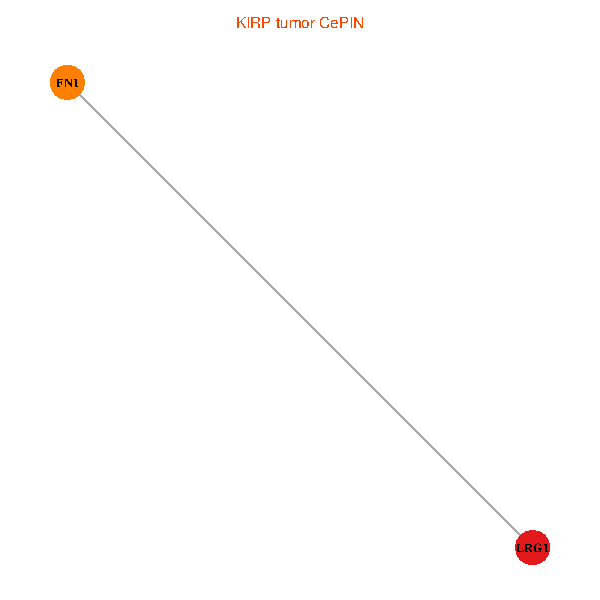
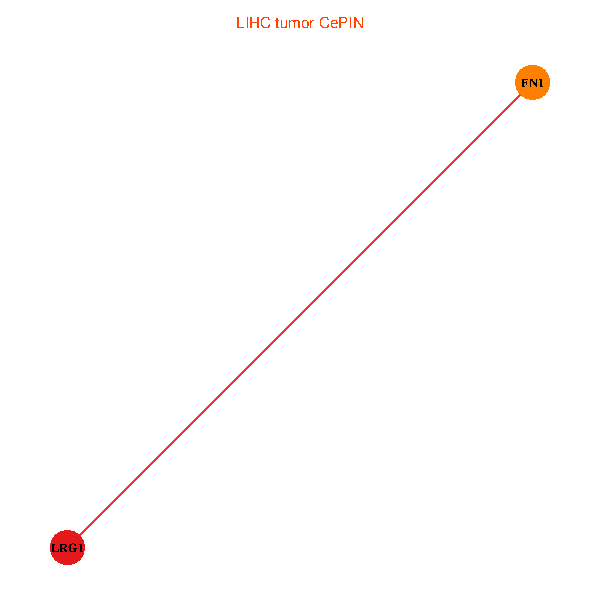
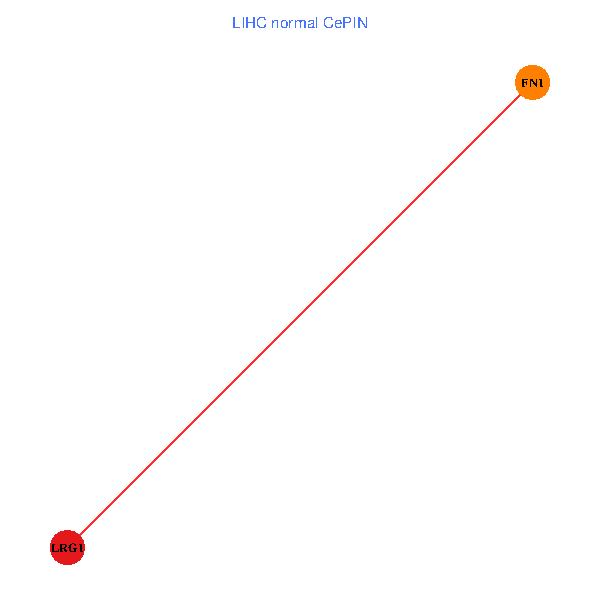
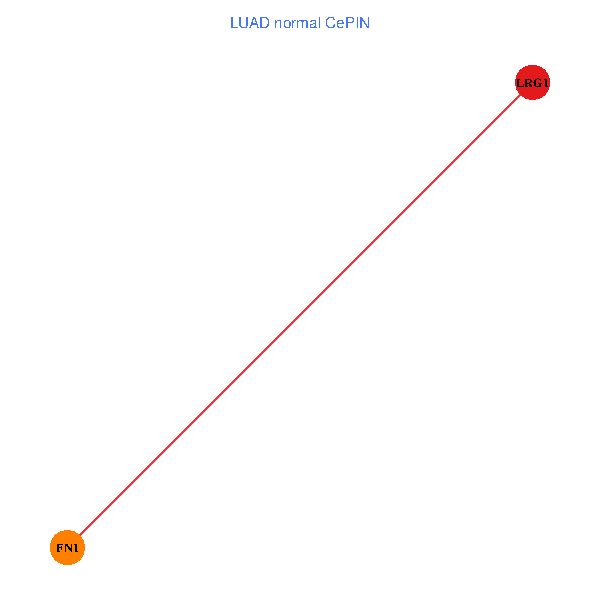
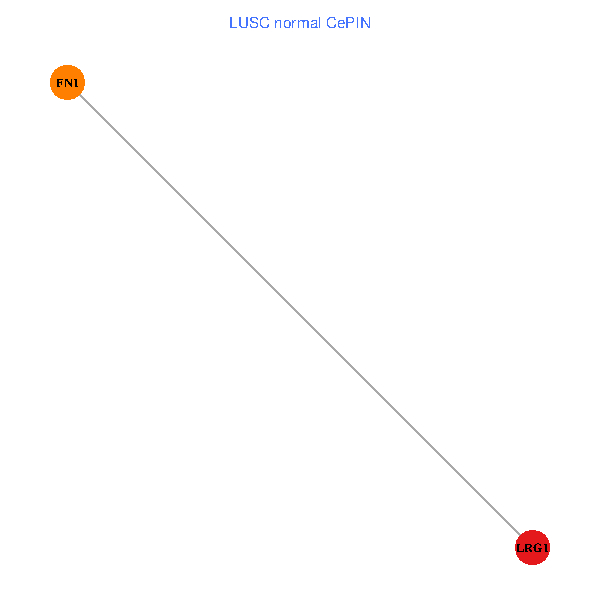
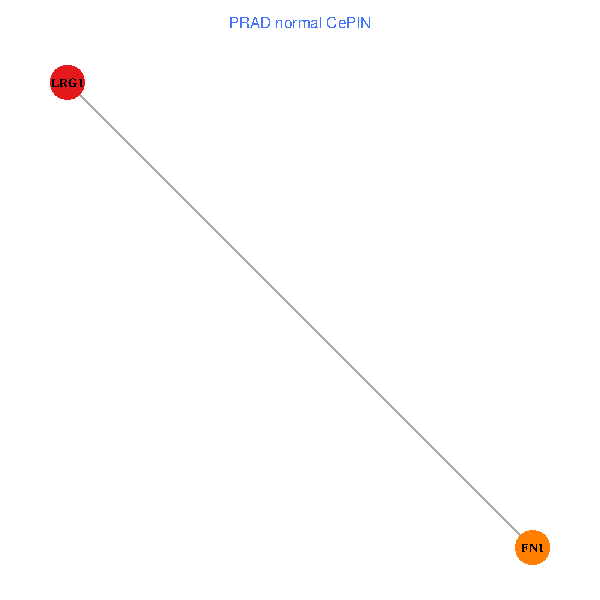
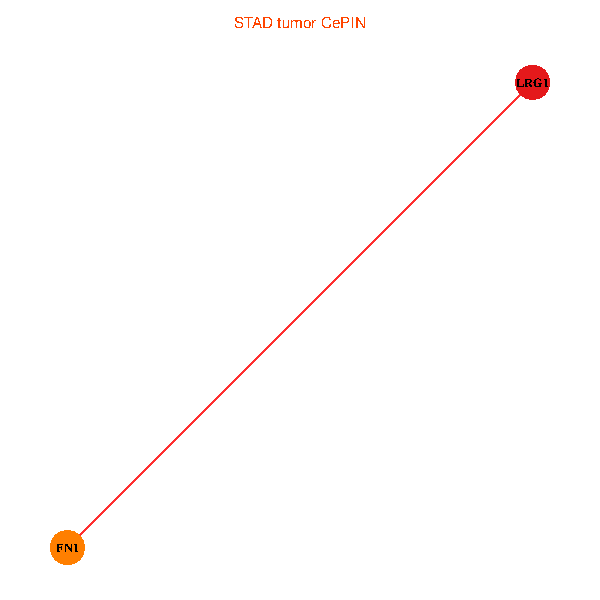
| Co-expressed gene networks based on protein-protein interaction data (CePIN) (TCGA IlluminaHiSeq_RNASeqV2, pan-cancer normalized log2(norm_counts+1) data, version 2016-08-16) (PINA2 ppi data) |
| BRCA (tumor) | BRCA (normal) |
| LRG1, FN1 (tumor) | LRG1, FN1 (normal) |
 |  |
| COAD (tumor) | COAD (normal) |
| LRG1, FN1 (tumor) | LRG1, FN1 (normal) |
 |  |
| HNSC (tumor) | HNSC (normal) |
| LRG1, FN1 (tumor) | LRG1, FN1 (normal) |
 |  |
| KICH (tumor) | KICH (normal) |
| LRG1, FN1 (tumor) | LRG1, FN1 (normal) |
 |  |
| KIRC (tumor) | KIRC (normal) |
| LRG1, FN1 (tumor) | LRG1, FN1 (normal) |
 |  |
| KIRP (tumor) | KIRP (normal) |
| LRG1, FN1 (tumor) | LRG1, FN1 (normal) |
 |  |
| LIHC (tumor) | LIHC (normal) |
| LRG1, FN1 (tumor) | LRG1, FN1 (normal) |
 |  |
| LUAD (tumor) | LUAD (normal) |
| LRG1, FN1 (tumor) | LRG1, FN1 (normal) |
 |  |
| LUSC (tumor) | LUSC (normal) |
| LRG1, FN1 (tumor) | LRG1, FN1 (normal) |
 |  |
| PRAD (tumor) | PRAD (normal) |
| LRG1, FN1 (tumor) | LRG1, FN1 (normal) |
 |  |
| STAD (tumor) | STAD (normal) |
| LRG1, FN1 (tumor) | LRG1, FN1 (normal) |
 |  |
| THCA (tumor) | THCA (normal) |
| LRG1, FN1 (tumor) | LRG1, FN1 (normal) |
 |  |
| Top |
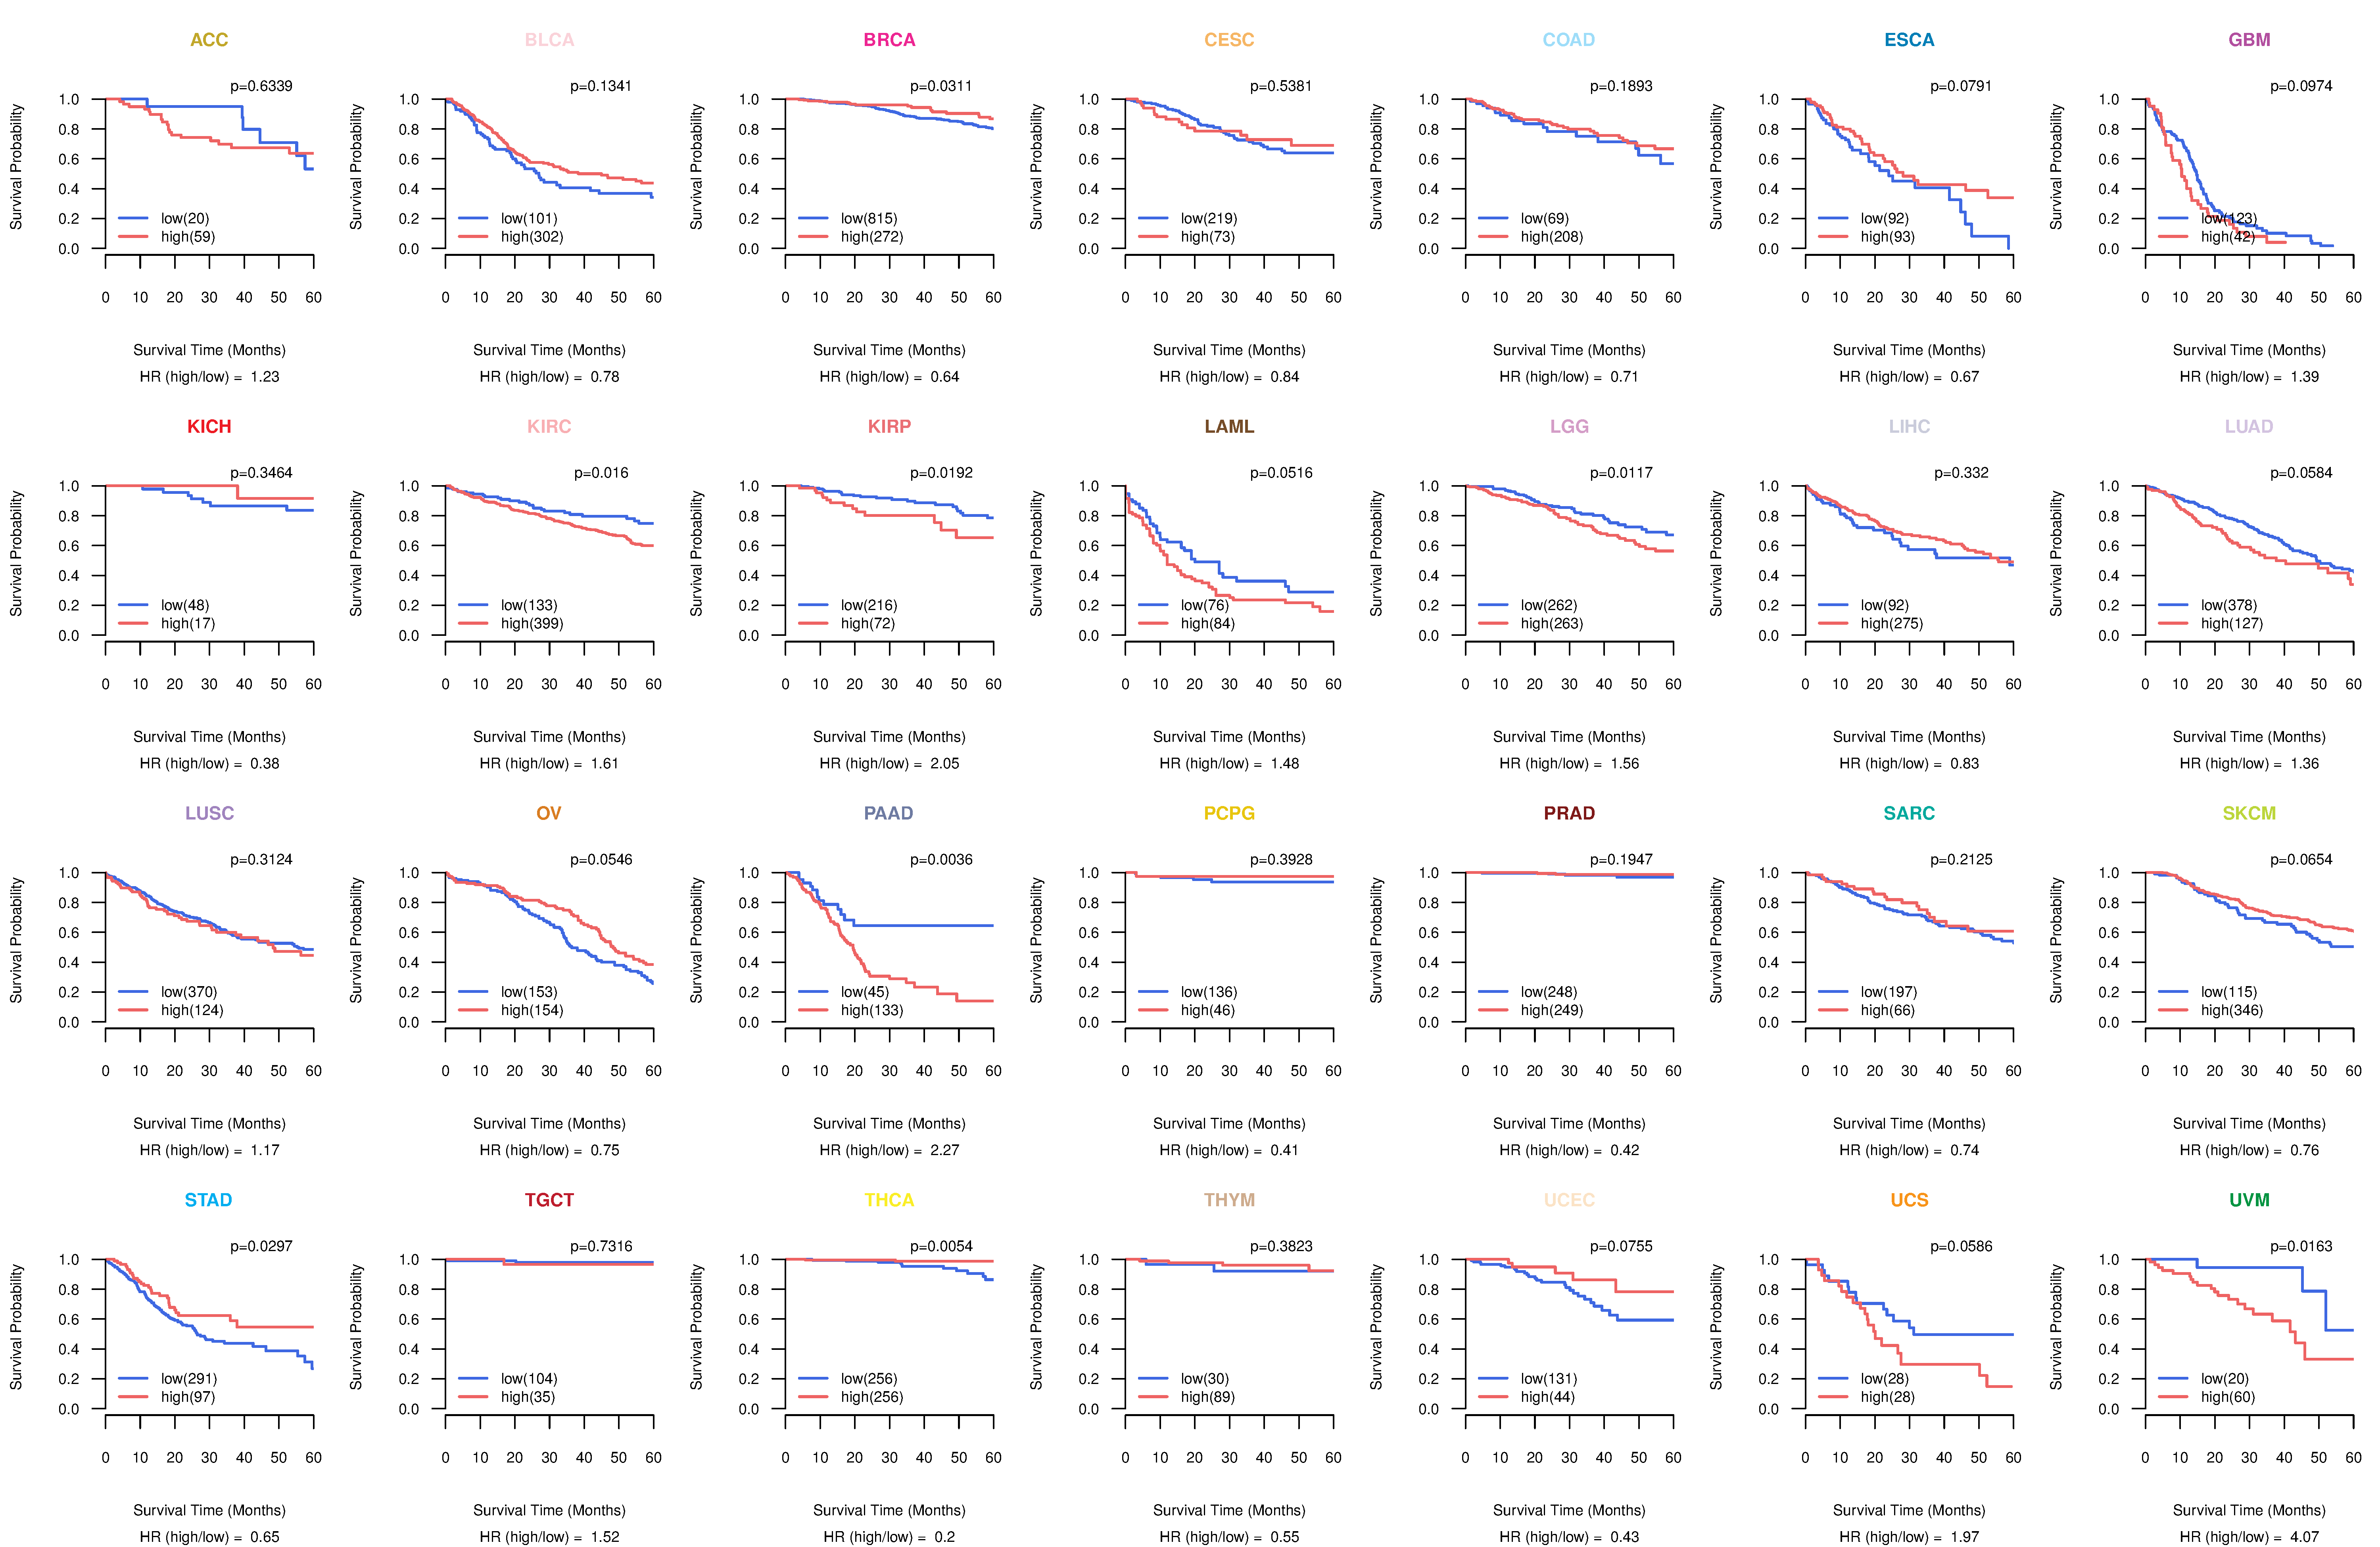
| TissGeneProg for LRG1 |
| Kaplan-Meier plots with logrank tests of overall survival (OS) using 28 cancer types (TCGA IlluminaHiSeq_RNASeqV2, pan-cancer normalized log2(norm_counts+1) data, version 2016-08-16) (TCGA clinicalMatrix, phenotype data, version 2016-04-27) * Click on the image to enlarge it in a new window. |
 |
| Kaplan-Meier plots with logrank test of relapse free survival (RFS) using 28 cancer types (TCGA IlluminaHiSeq_RNASeqV2, pan-cancer normalized log2(norm_counts+1) data, version 2016-08-16) (TCGA clinicalMatrix, phenotype data, version 2016-04-27) * Click on the image enlarge it in a new window. |
 |
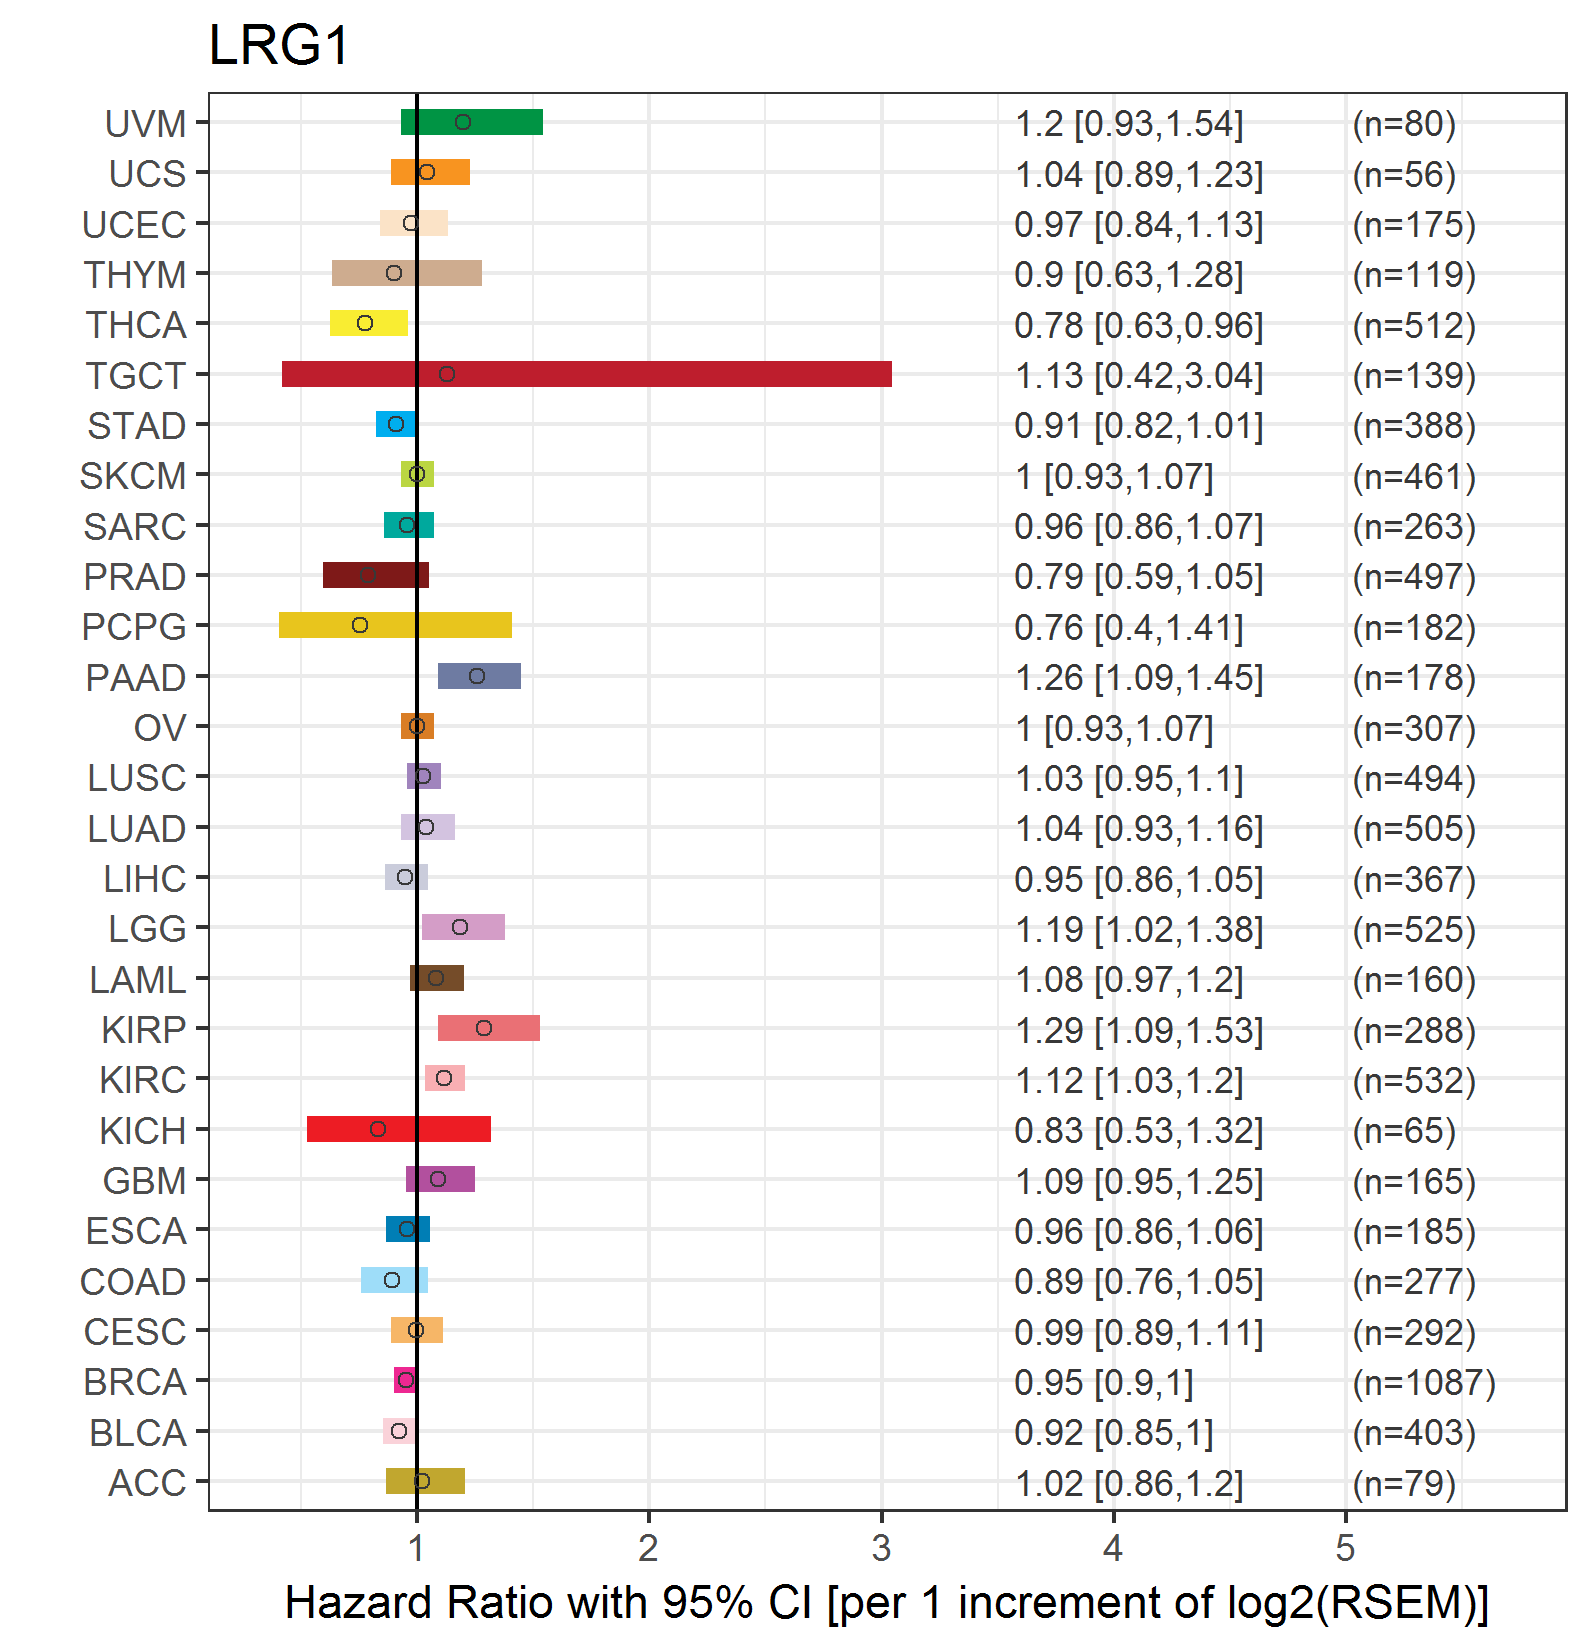
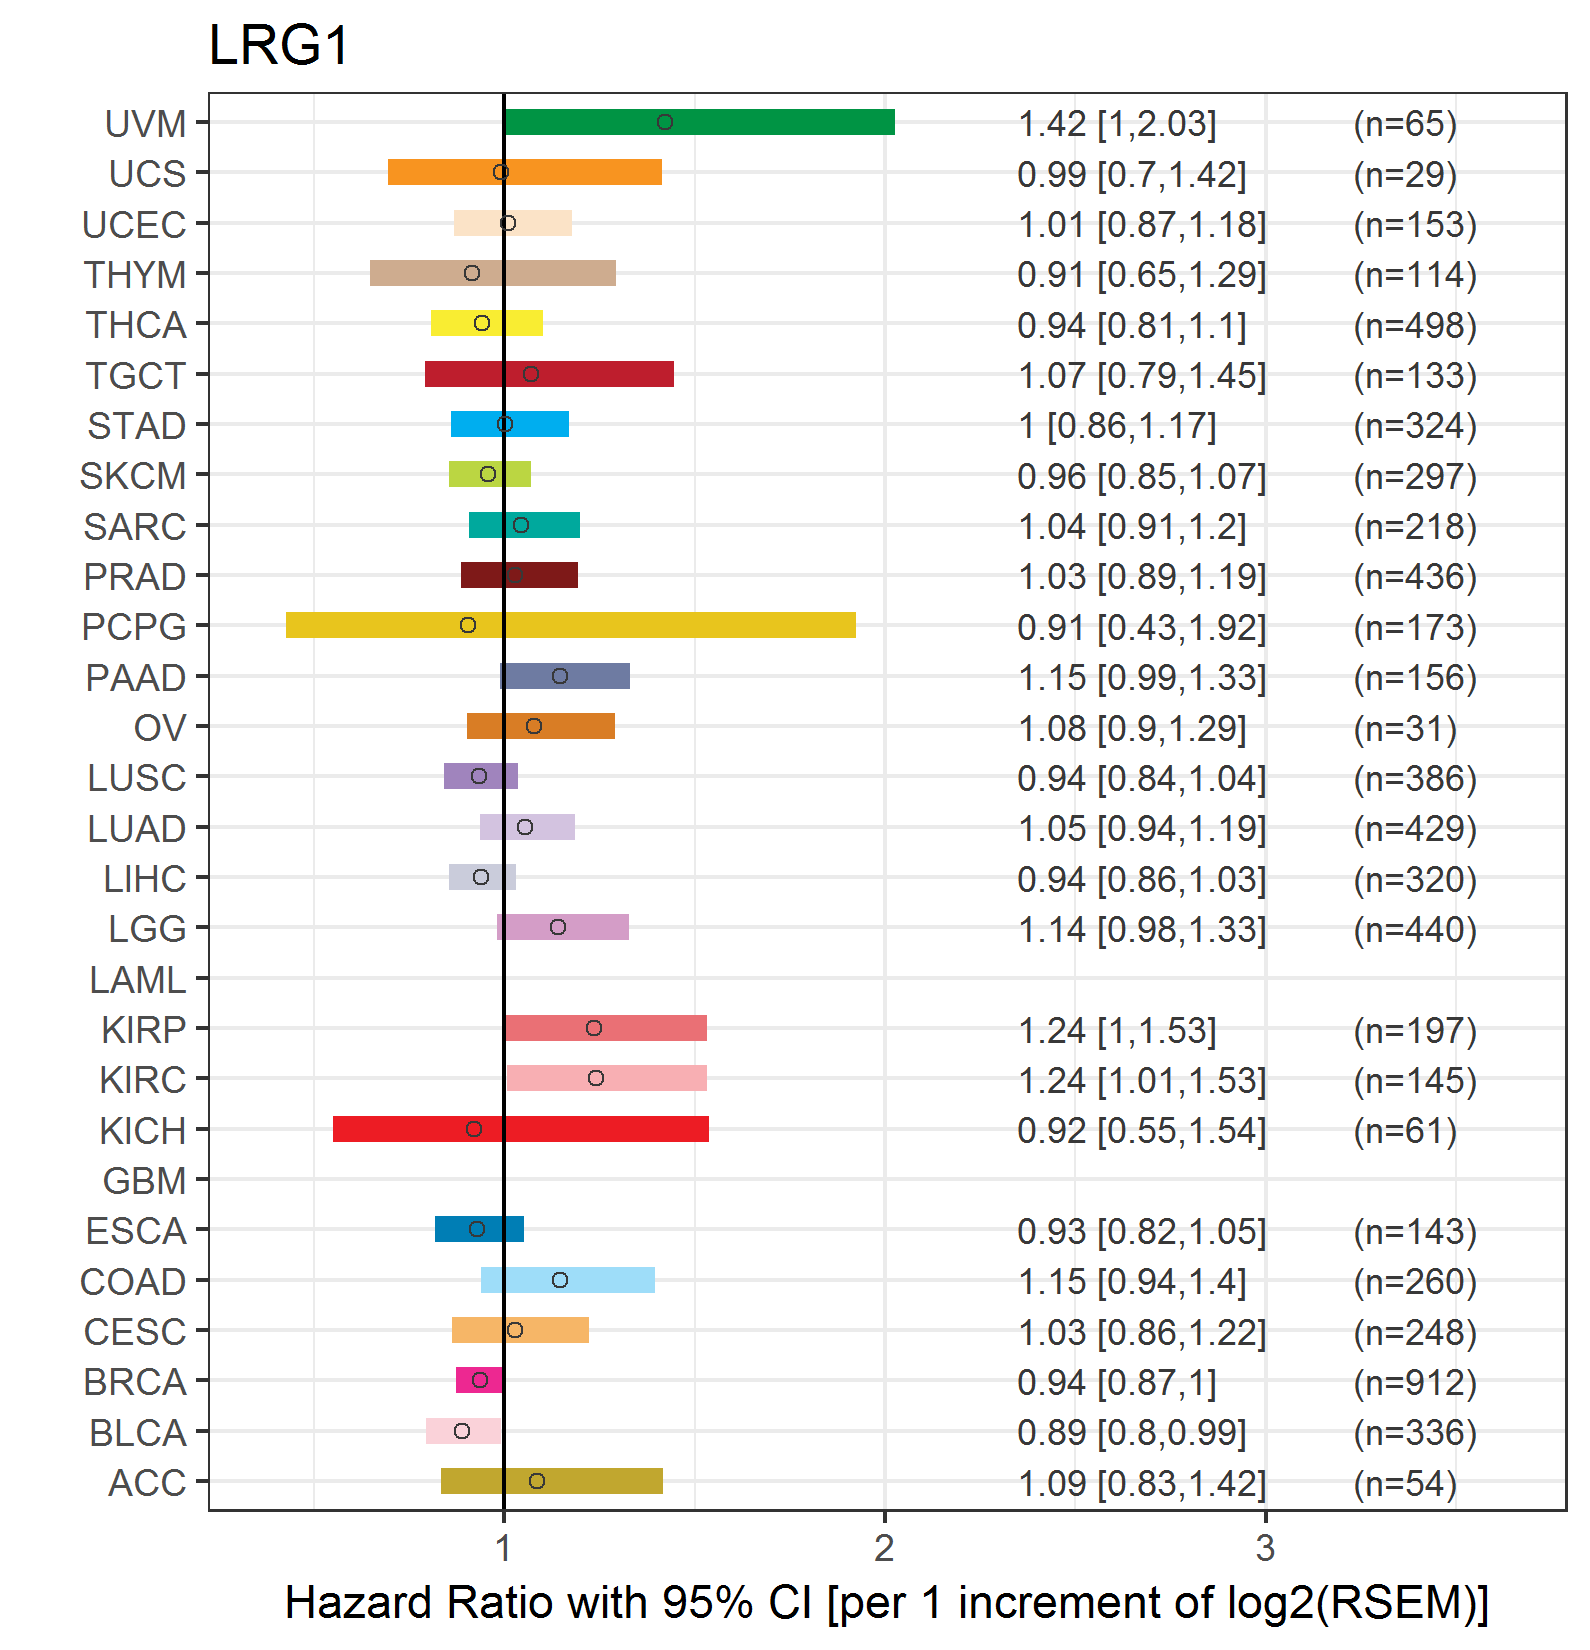
| Forest plot of Cox proportional hazard ratio (HR) and 95% CI of overall survival (OS) using 28 cancer types (TCGA IlluminaHiSeq_RNASeqV2, pan-cancer normalized log2(norm_counts+1) data, version 2016-08-16) (TCGA clinicalMatrix, phenotype data, version 2016-04-27) * Click on the image enlarge it in a new window. |
 |
| Forest plot of Cox proportional hazard ratio (HR) and 95% CI of relapse free survival (RFS) using 28 cancer types (TCGA IlluminaHiSeq_RNASeqV2, pan-cancer normalized log2(norm_counts+1) data, version 2016-08-16) (TCGA clinicalMatrix, phenotype data, version 2016-04-27) * Click on the image enlarge it in a new window. |
 |
| Top |
| TissGeneClin for LRG1 |
| TissGeneDrug for LRG1 |
| Drug information targeting TissGene (DrugBank Version 5.0.6, 2017-04-01) |
| DrugBank ID | Drug name | Drug activity | Drug type | Drug status |
| Top |
| TissGeneDisease for LRG1 |
| Disease information associated with TissGene (DisGeNet, 2016-06-01) |
| Disease ID | Disease name | # pubmeds | Source |
| umls:C0003873 | Rheumatoid Arthritis | 1 | BeFree |
| umls:C0007103 | Malignant neoplasm of endometrium | 1 | BeFree |
| umls:C0009319 | Colitis | 1 | BeFree |
| umls:C0009324 | Ulcerative Colitis | 1 | BeFree |
| umls:C0010346 | Crohn Disease | 1 | BeFree |
| umls:C0017636 | Glioblastoma | 1 | BeFree |
| umls:C0024232 | Lymphatic Metastasis | 1 | BeFree |
| umls:C0027819 | Neuroblastoma | 1 | BeFree |
| umls:C0476089 | Endometrial Carcinoma | 1 | BeFree |
| umls:C0596263 | Carcinogenesis | 1 | BeFree |
| umls:C0700095 | Central neuroblastoma | 1 | BeFree |
| umls:C1883486 | Uterine Corpus Cancer | 1 | BeFree |
|
Copyright 2016-Present - The University of Texas Health Science Center at Houston (UTHealth) Web File Viewing | How to Report, Fraud, Waste and Abuse | State of Texas | Statewide Search | Texas Homeland Security | Site Policies |