 |
| |
| |
| |
| |
| |
| |
|

| TissGeneSummary for GTSF1 |
 Gene summary Gene summary |
| Basic gene information | Gene symbol | GTSF1 |
| Gene name | gametocyte specific factor 1 | |
| Synonyms | FAM112B | |
| Cytomap | UCSC genome browser: 12q13.13 | |
| Type of gene | protein-coding | |
| RefGenes | NM_144594.2, | |
| Description | family with sequence similarity 112, member Bgametocyte-specific factor 1 | |
| Modification date | 20141207 | |
| dbXrefs | HGNC : HGNC | |
| Ensembl : ENSG00000170627 | ||
| HPRD : 08150 | ||
| Vega : OTTHUMG00000169842 | ||
| Protein | UniProt: go to UniProt's Cross Reference DB Table | |
| Expression | CleanEX: HS_GTSF1 | |
| BioGPS: 121355 | ||
| Pathway | NCI Pathway Interaction Database: GTSF1 | |
| KEGG: GTSF1 | ||
| REACTOME: GTSF1 | ||
| Pathway Commons: GTSF1 | ||
| Context | iHOP: GTSF1 | |
| ligand binding site mutation search in PubMed: GTSF1 | ||
| UCL Cancer Institute: GTSF1 | ||
| Assigned class in TissGDB* | B | |
| Included tissue-specific gene expression resources | HPA,TiGER,GTEx | |
| Specific-tissues in normal samples (assigned by TissGDB using HPA, TiGER, and GTEx) | Bone marrowTestis | |
| Cancer types related to the specific-tissues in cancer samples (assigned by TissGDB using TCGA) | LAMLTGCT | |
| Reference showing the relevant tissue of GTSF1 | ||
| Description by TissGene annotations | Have significant anti-correlated miRNA Fused withTSGene | |
| * Class A consists of genes with literature evidence and is part of the cTissGenes. Class B consists of only cTissGenes without additional evidence. The remaining genes belong to Class C. |
| Gene ontology having evidence of Inferred from Direct Assay (IDA) from Entrez |
| GO ID | GO term | PubMed ID |
| Top |
| TissGeneExp for GTSF1 |
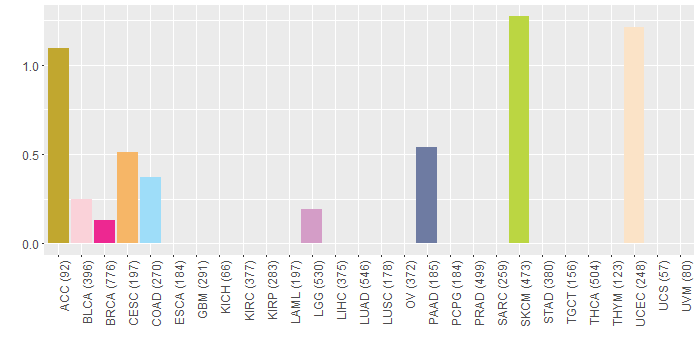
| Gene expressions across 28 cancer types (X-axis: cancer type and Y-axis: log2(norm_counts+1)) (TCGA IlluminaHiSeq_RNASeqV2, pan-cancer normalized log2(norm_counts+1) data, version 2016-08-16) |
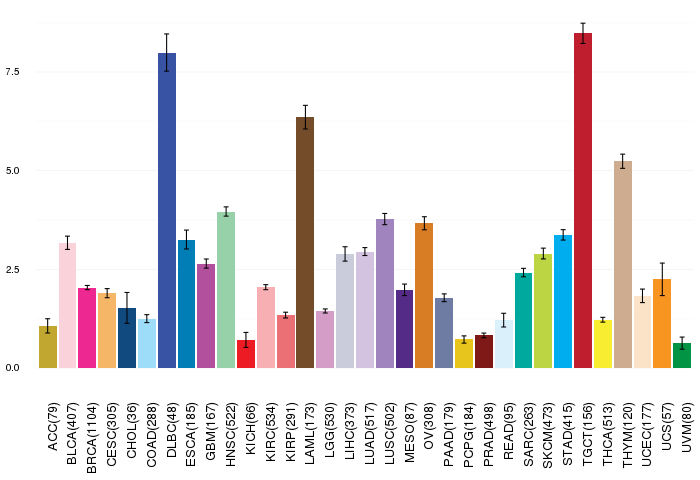 |
| Gene isoform expressions across 28 cancer types (X-axis: cancer type and Y-axis: log2(norm_counts+1)) (TCGA pan-cancer tcga_rsem_isoform_tpm, version 2016-09-01) |
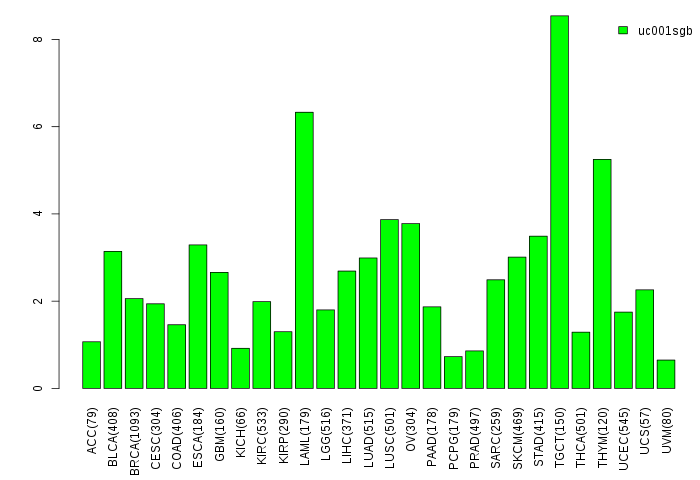 |
| Gene expressions across normal tissues of GTEx data (GTEx GTEx_Analysis_v6_RNA-seq_RNA-SeQCv1.1.8_gene_rpkm.gct) - Here, we shows the matched tissue types only among our 28 cancer types. |
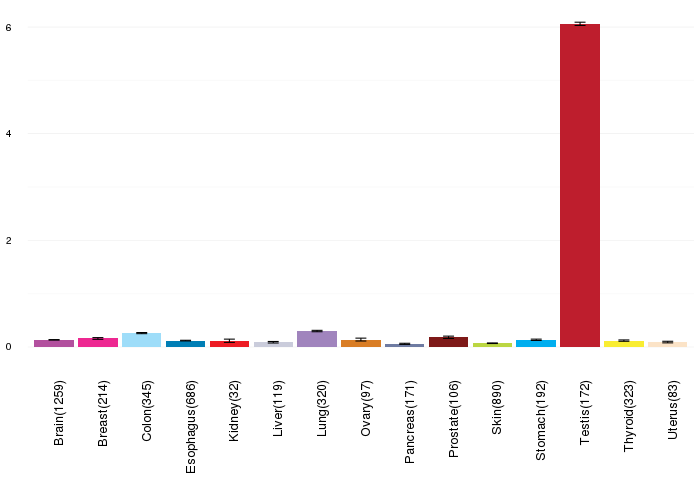 |
| Different expressions across 14 cancer types with more than 10 samples between matched tumors and normals (X-axis: cancer type and Y-axis: log2(norm_counts+1)) (TCGA IlluminaHiSeq_RNASeqV2, pan-cancer normalized log2(norm_counts+1) data, version 2016-08-16) |
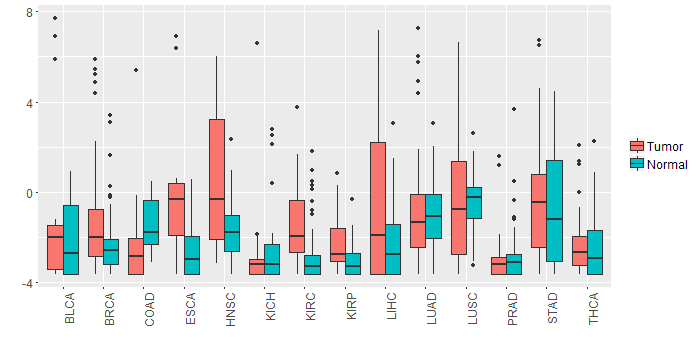 |
| - Significantly differentially expressed cancer types and information. (|Fold change|>1 and FDR<0.05) |
| Cancer type | Mean(exp) in tumor | Mean(exp) in matched normal | Log2FC | P-val. | FDR |
| HNSC | 0.621103693 | -1.724719563 | 2.345823256 | 1.66E-05 | 8.96E-05 |
| KIRC | -1.528637166 | -2.840688555 | 1.312051389 | 2.14E-07 | 5.80E-07 |
| LIHC | -0.444331888 | -2.434641888 | 1.99031 | 0.000458 | 0.001345526 |
| Top |
| TissGene-miRNA for GTSF1 |
| Significantly anti-correlated miRNAs of TissGene across 28 cancer types (Gene-miRNA relations from TargetScanHuman Relsease 7.1, Conserved_Site_Context_Scores.txt.zip, 06.01.2016) (TCGA IlluminaHiSeq_miRNASeq, log2(RPM+1) data, version 2016-11-21) (TCGA IlluminaHiSeq_RNASeqV2, log2(normalized_count+1) data, version 2016-08-16) (Spearman’s Rank Correlation (p-value<0.05 and coefficient<-0.25)) |
| Cancer type | miRNA id | miRNA accession | P-val. | Coeff. | # samples |
| UCS | hsa-miR-223-3p | MIMAT0000280 | 0.013 | -0.33 | 56 |
| Top |
| TissGeneMut for GTSF1 |
| TissGeneSNV for GTSF1 |
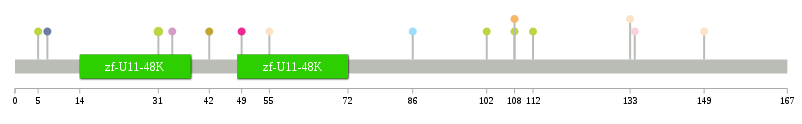
| nsSNV counts per each loci. Different colors of circles represent different cancer types. Circle size denotes number of samples. (TCGA somatic mutation (SNPs and small INDELs) data, version 2016-04-25) * Click on the image to enlarge it in a new window. |
 |
 |
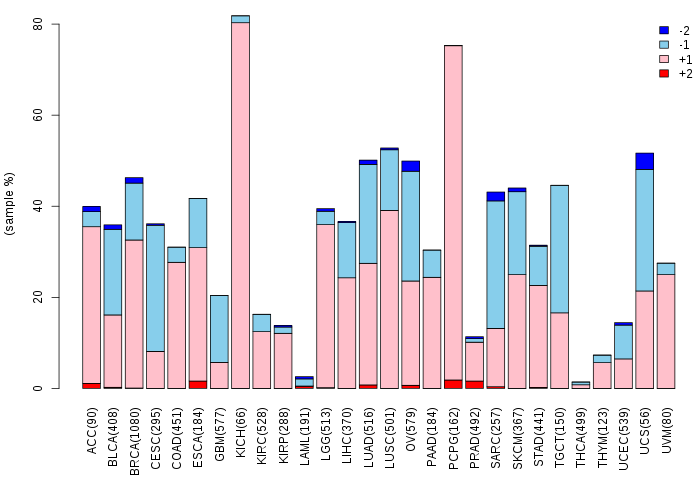
| Somatic nucleotide variants of TissGene across 28 cancer types (X-axis: cancer type and Y-axis: % of mutated samples) The numbers in parentheses are numbers of samples with mutation (nsSNVs). (TCGA somatic mutation (SNPs and small INDELs) data, version 2016-04-25) |
 |
| - nsSNVs sorted by frequency. |
| AAchange | Cancer type | # samples |
| p.P31S | SKCM | 2 |
| p.A49T | BRCA | 1 |
| p.A133V | UCEC | 1 |
| p.R86S | COAD | 1 |
| p.Y5H | SKCM | 1 |
| p.D7N | PAAD | 1 |
| p.D108N | SKCM | 1 |
| p.F53L | READ | 1 |
| p.W112* | SKCM | 1 |
| p.A55D | UCEC | 1 |
| p.S134G | BLCA | 1 |
| p.D108E | CESC | 1 |
| p.P52L | HNSC | 1 |
| p.P102S | SKCM | 1 |
| p.R149* | UCEC | 1 |
| p.P42H | ACC | 1 |
| p.L34I | LGG | 1 |
| Top |
| TissGeneCNV for GTSF1 |
| Copy number variations of TissGene across 28 cancer types (X-axis: cancer type and Y-axis: % of CNV samples) (TCGA Gistic2_CopyNumber_Gistic2_all_data_by_genes, Gistic2 copy number data, version 2016-08-16) |
 |
| Top |
| TissGeneFusions for GTSF1 |
| Fusion genes including TissGene (ChimerDB 3.0, 2016-12-01 and TCGA fusion Portal 2015-12-01) |
| Database | Src | Cancer type | Sample | Fusion gene | ORF | 5'-gene BP | 3'-gene BP |
| Chimerdb3.0 | ChimerDB 2.0 | NA | NA | ARL2-GTSF1 | chr11:64542710 | chr12:53142225 | |
| Chimerdb3.0 | ChiTaRs | NA | BU620280 | GTSF1-TGOLN2 | chr12:54856468 | chr2:85549255 | |
| TCGAfusionPortal | PRADA | LUSC | TCGA-39-5035-01A | ITGA5-GTSF1 | Out-of-frame | Chr12:54795157 | Chr12:54858951 |
| Top |
| TissGeneNet for GTSF1 |
| Co-expressed gene networks based on protein-protein interaction data (CePIN) (TCGA IlluminaHiSeq_RNASeqV2, pan-cancer normalized log2(norm_counts+1) data, version 2016-08-16) (PINA2 ppi data) |
| Top |
| TissGeneProg for GTSF1 |
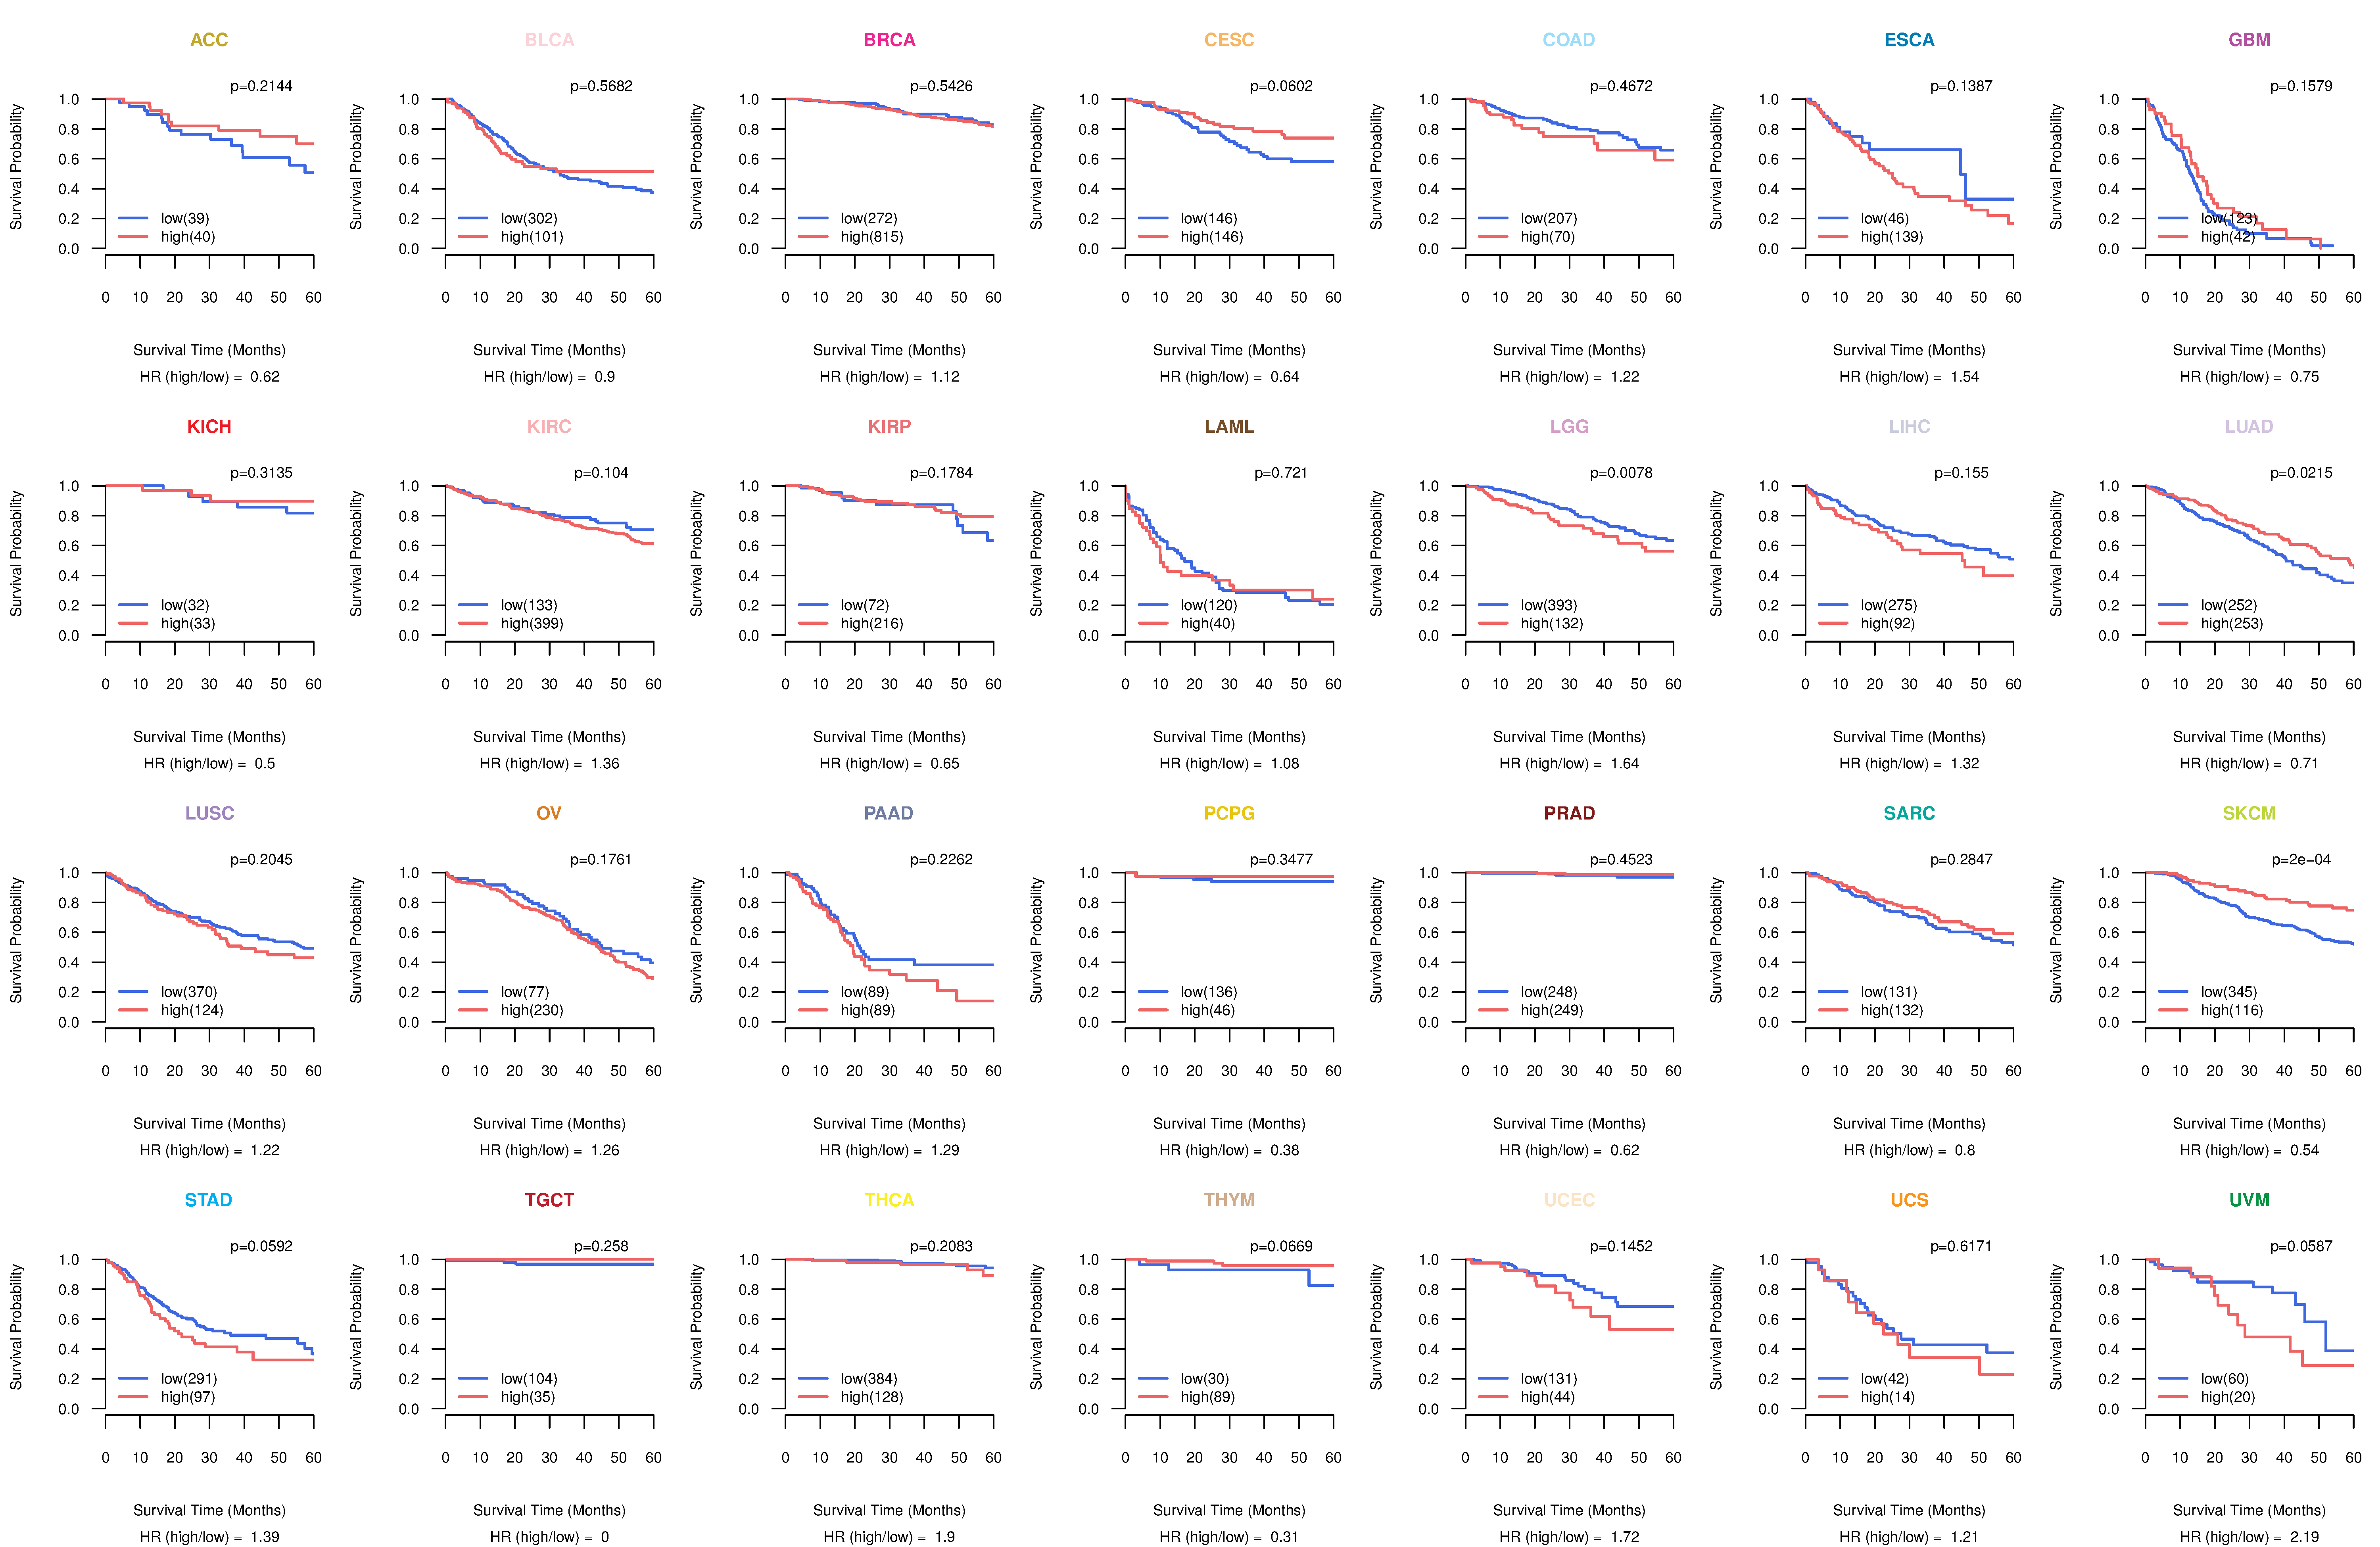
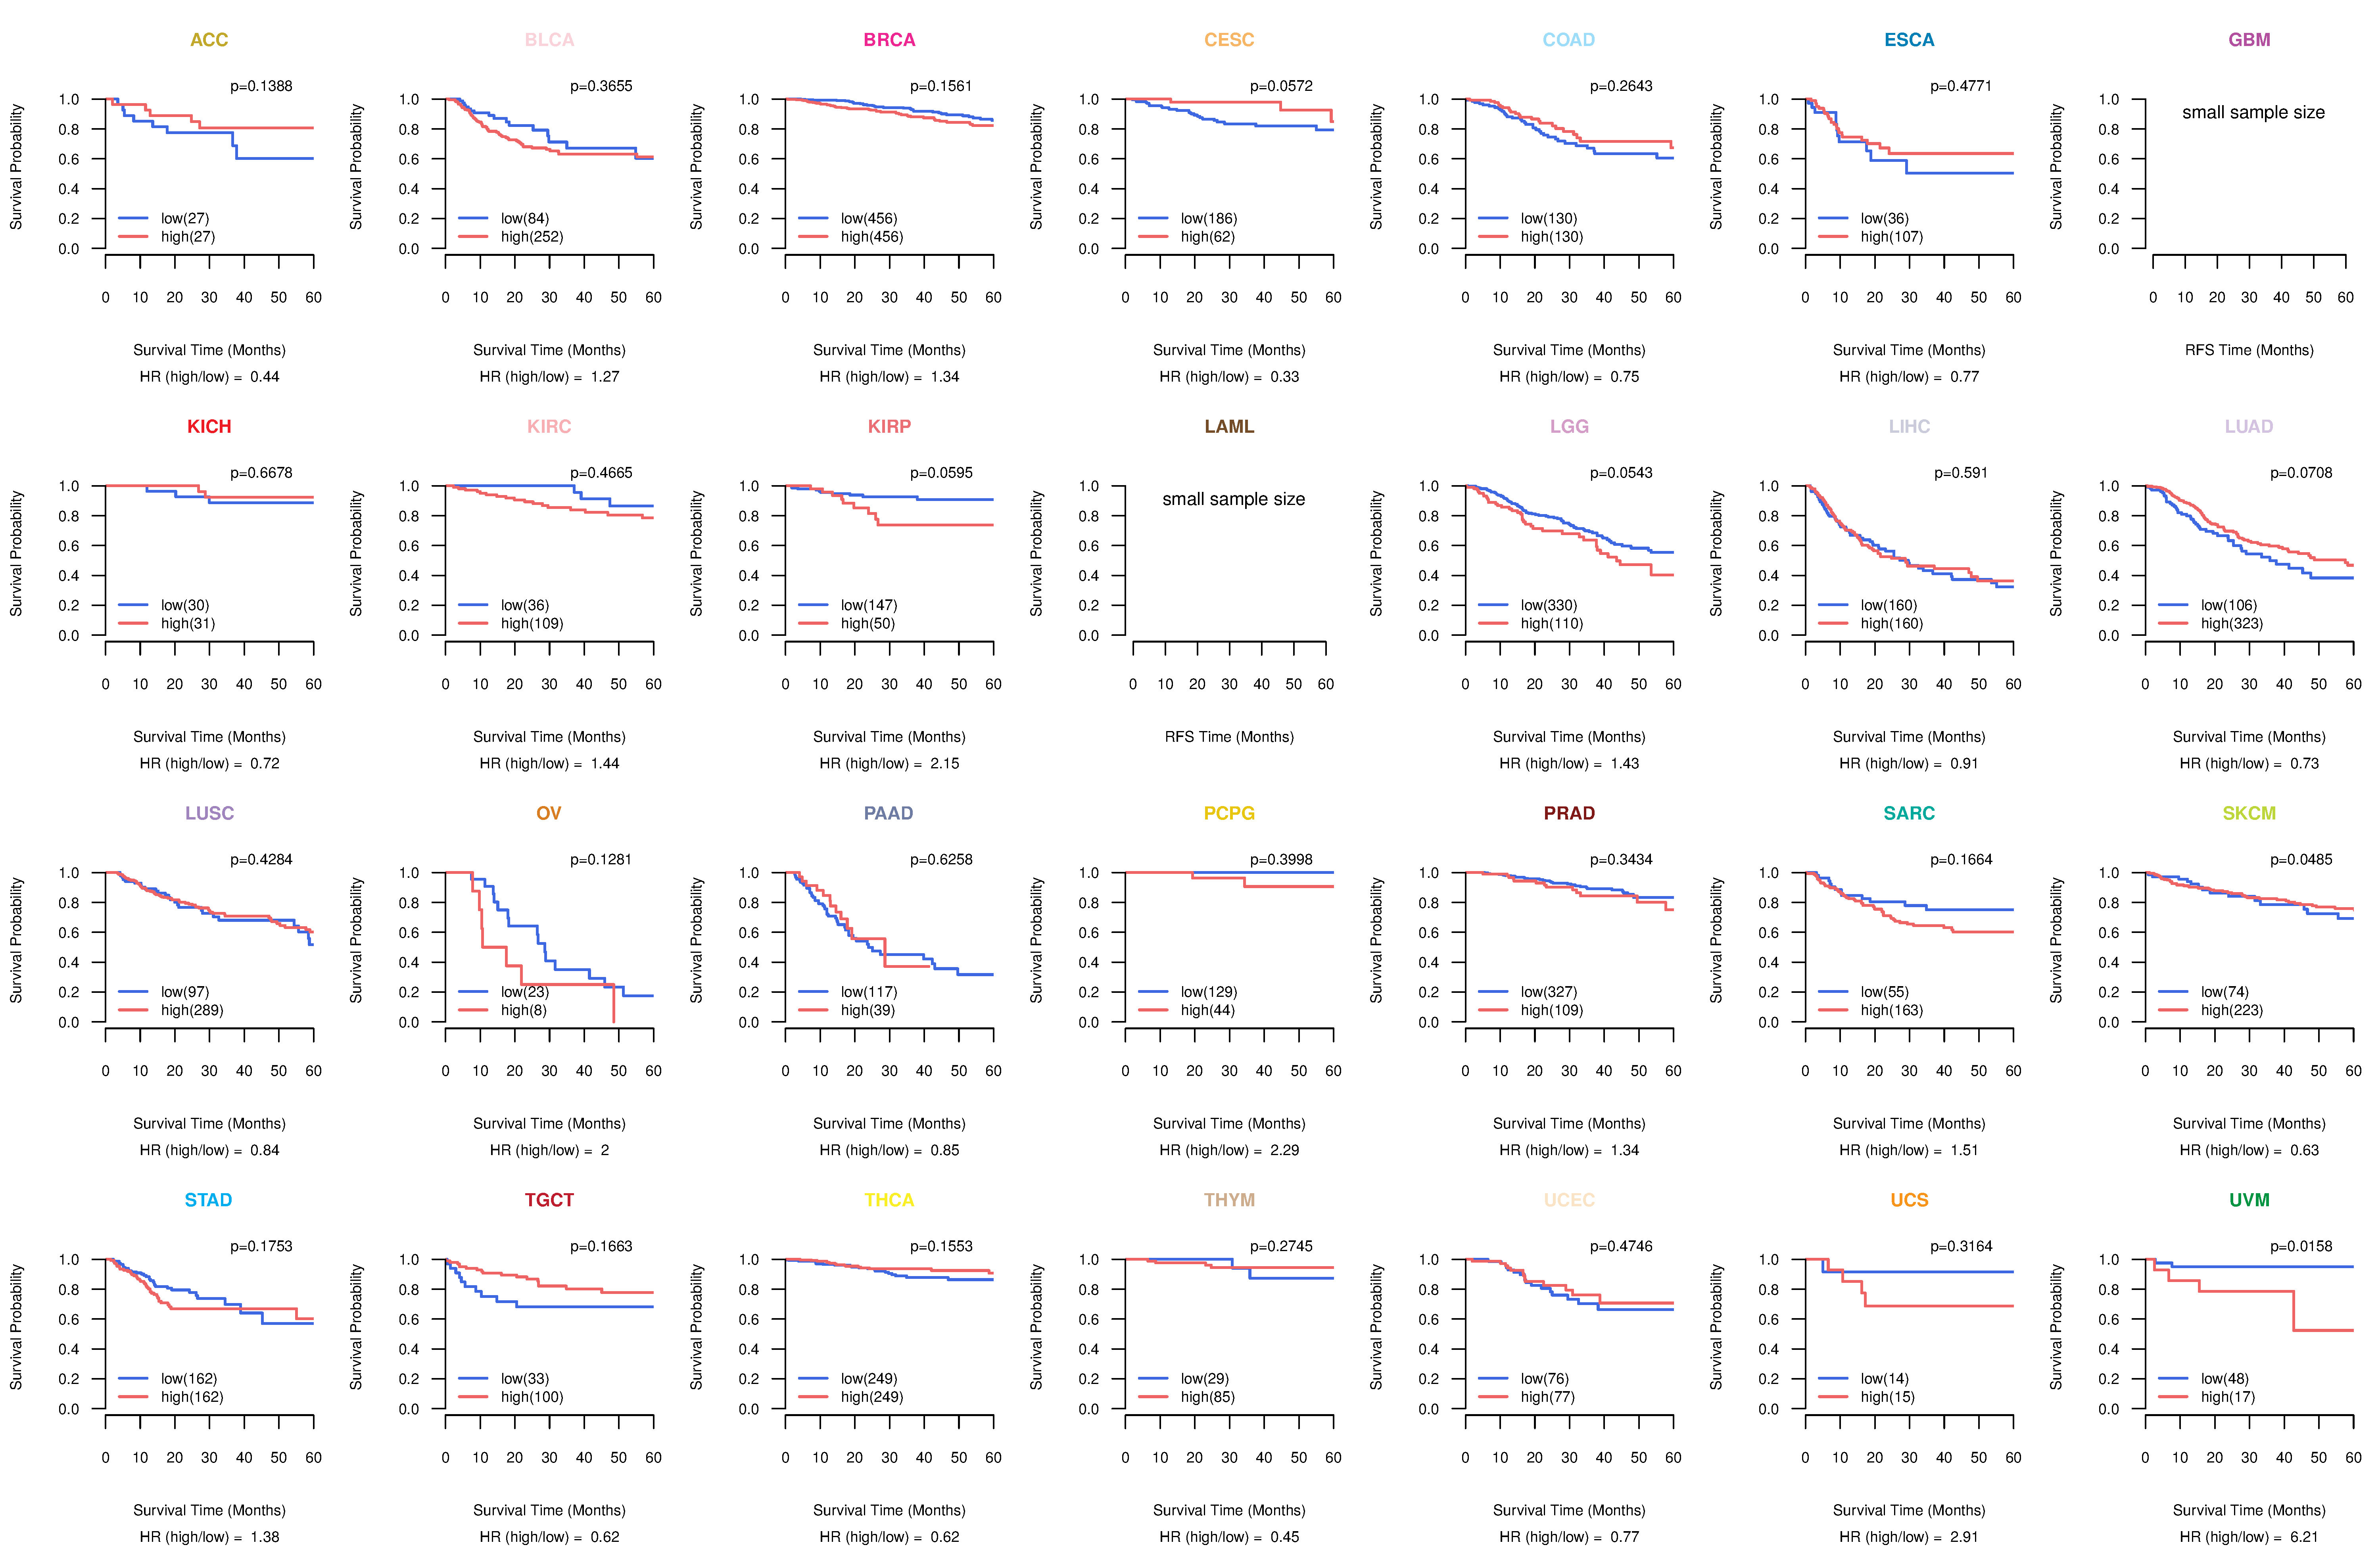
| Kaplan-Meier plots with logrank tests of overall survival (OS) using 28 cancer types (TCGA IlluminaHiSeq_RNASeqV2, pan-cancer normalized log2(norm_counts+1) data, version 2016-08-16) (TCGA clinicalMatrix, phenotype data, version 2016-04-27) * Click on the image to enlarge it in a new window. |
 |
| Kaplan-Meier plots with logrank test of relapse free survival (RFS) using 28 cancer types (TCGA IlluminaHiSeq_RNASeqV2, pan-cancer normalized log2(norm_counts+1) data, version 2016-08-16) (TCGA clinicalMatrix, phenotype data, version 2016-04-27) * Click on the image enlarge it in a new window. |
 |
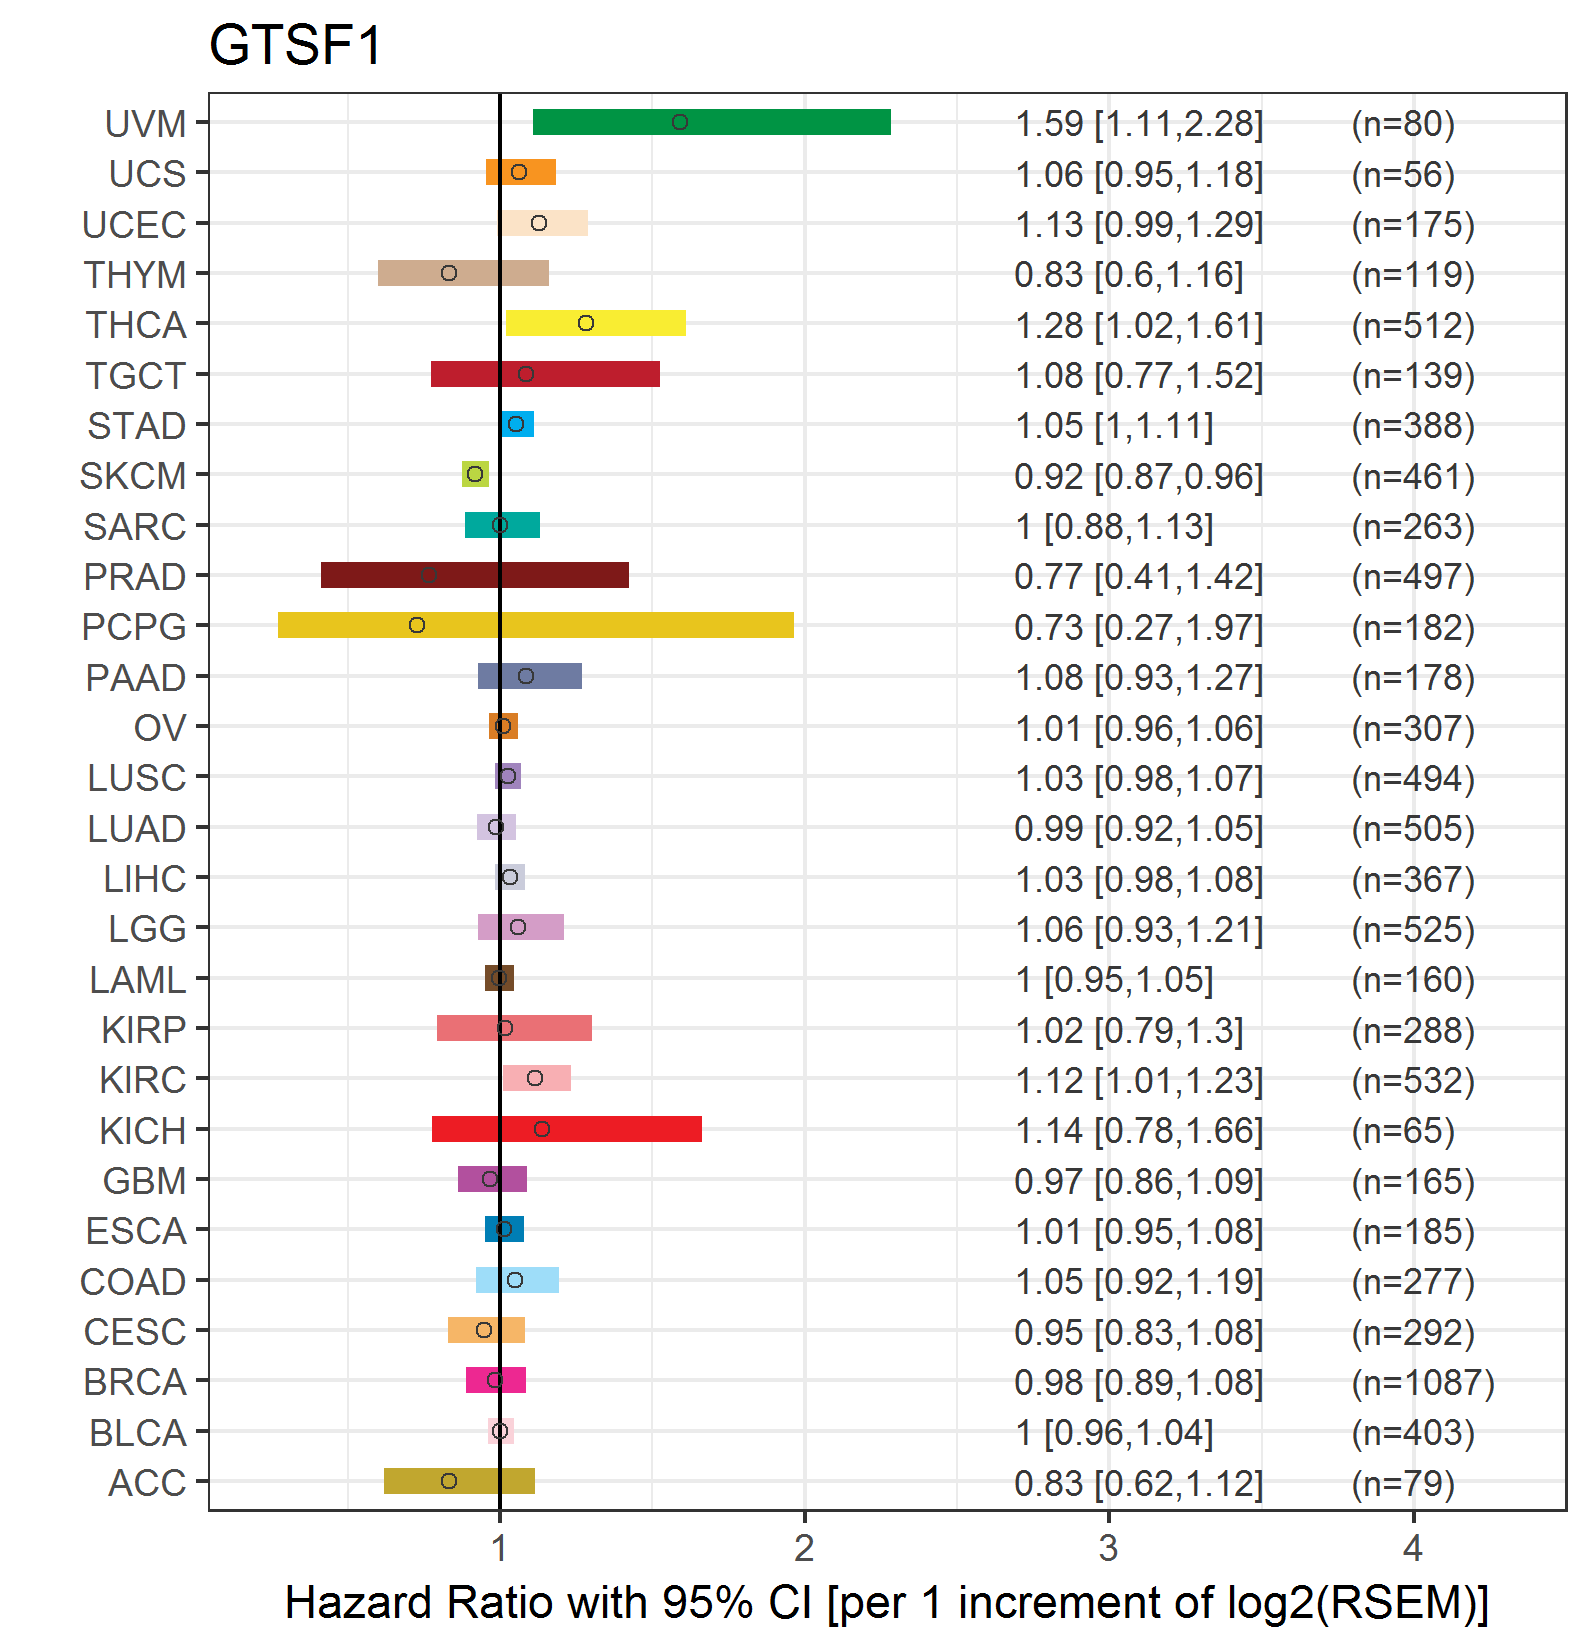
| Forest plot of Cox proportional hazard ratio (HR) and 95% CI of overall survival (OS) using 28 cancer types (TCGA IlluminaHiSeq_RNASeqV2, pan-cancer normalized log2(norm_counts+1) data, version 2016-08-16) (TCGA clinicalMatrix, phenotype data, version 2016-04-27) * Click on the image enlarge it in a new window. |
 |
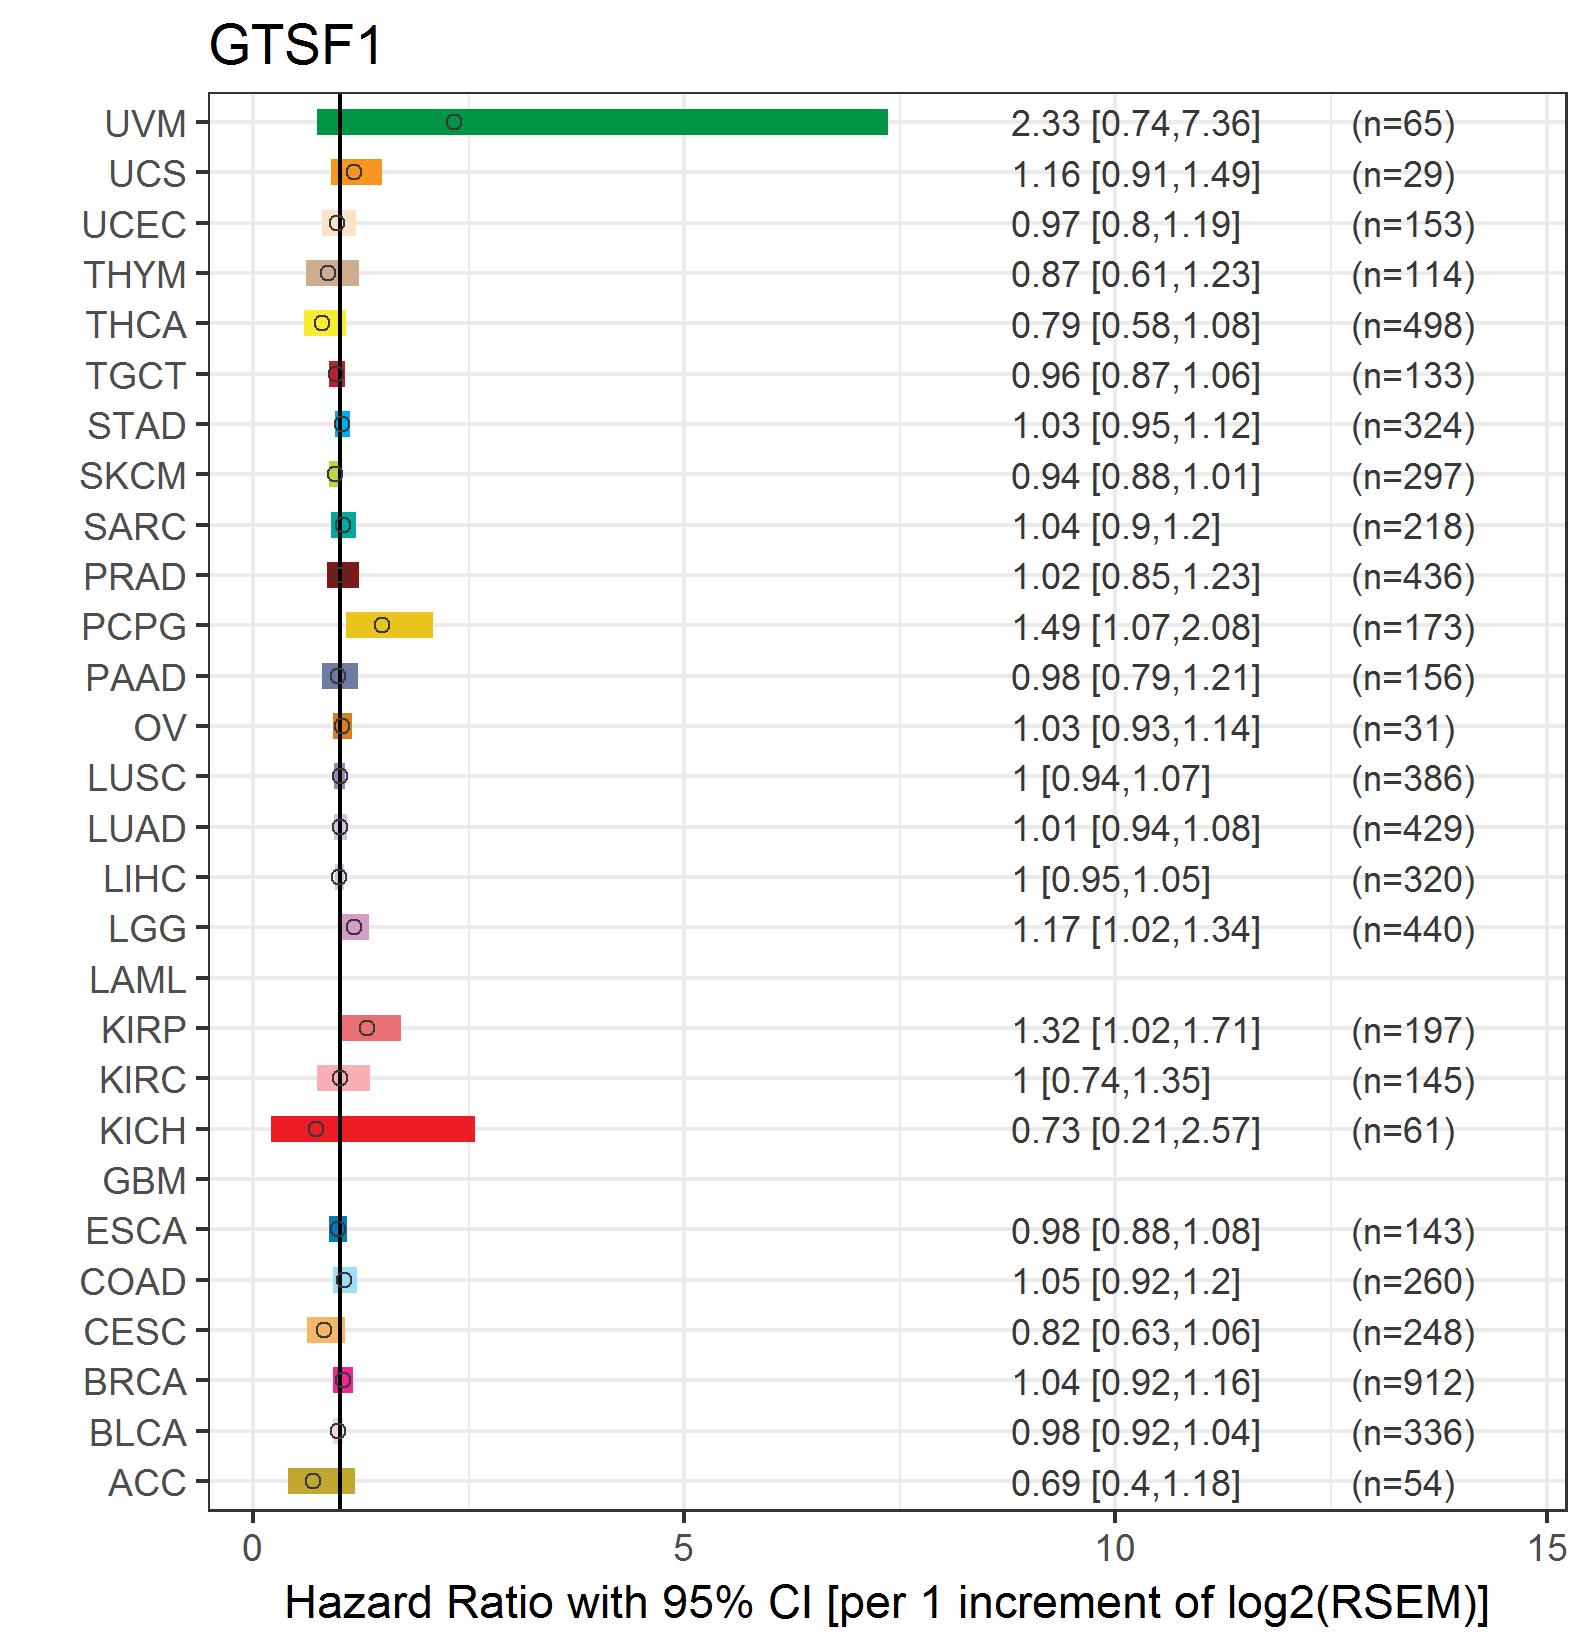
| Forest plot of Cox proportional hazard ratio (HR) and 95% CI of relapse free survival (RFS) using 28 cancer types (TCGA IlluminaHiSeq_RNASeqV2, pan-cancer normalized log2(norm_counts+1) data, version 2016-08-16) (TCGA clinicalMatrix, phenotype data, version 2016-04-27) * Click on the image enlarge it in a new window. |
 |
| Top |
| TissGeneClin for GTSF1 |
| TissGeneDrug for GTSF1 |
| Drug information targeting TissGene (DrugBank Version 5.0.6, 2017-04-01) |
| DrugBank ID | Drug name | Drug activity | Drug type | Drug status |
| Top |
| TissGeneDisease for GTSF1 |
| Disease information associated with TissGene (DisGeNet, 2016-06-01) |
| Disease ID | Disease name | # pubmeds | Source |
| umls:C0026948 | Mycosis Fungoides | 1 | BeFree |
| umls:C0079773 | Lymphoma, T-Cell, Cutaneous | 1 | BeFree |
|
Copyright 2016-Present - The University of Texas Health Science Center at Houston (UTHealth) Web File Viewing | How to Report, Fraud, Waste and Abuse | State of Texas | Statewide Search | Texas Homeland Security | Site Policies |