 |
| |
| |
| |
| |
| |
| |
|

| TissGeneSummary for ACOT4 |
 Gene summary Gene summary |
| Basic gene information | Gene symbol | ACOT4 |
| Gene name | acyl-CoA thioesterase 4 | |
| Synonyms | PTE-Ib|PTE1B|PTE2B | |
| Cytomap | UCSC genome browser: 14q24.3 | |
| Type of gene | protein-coding | |
| RefGenes | NM_152331.3, | |
| Description | PTE-2bacyl-coenzyme A thioesterase 4peroxisomal acyl coenzyme A thioester hydrolase Ibperoxisomal acyl-CoA thioesterase 2Bperoxisomal long-chain acyl-CoA thioesterase Ib | |
| Modification date | 20141207 | |
| dbXrefs | MIM : 614314 | |
| HGNC : HGNC | ||
| HPRD : 17928 | ||
| Protein | UniProt: go to UniProt's Cross Reference DB Table | |
| Expression | CleanEX: HS_ACOT4 | |
| BioGPS: 122970 | ||
| Pathway | NCI Pathway Interaction Database: ACOT4 | |
| KEGG: ACOT4 | ||
| REACTOME: ACOT4 | ||
| Pathway Commons: ACOT4 | ||
| Context | iHOP: ACOT4 | |
| ligand binding site mutation search in PubMed: ACOT4 | ||
| UCL Cancer Institute: ACOT4 | ||
| Assigned class in TissGDB* | C | |
| Included tissue-specific gene expression resources | TiGER,GTEx | |
| Specific-tissues in normal samples (assigned by TissGDB using HPA, TiGER, and GTEx) | LiverSoft tissue | |
| Cancer types related to the specific-tissues in cancer samples (assigned by TissGDB using TCGA) | LIHCSARC | |
| Reference showing the relevant tissue of ACOT4 | ||
| Description by TissGene annotations | ||
| * Class A consists of genes with literature evidence and is part of the cTissGenes. Class B consists of only cTissGenes without additional evidence. The remaining genes belong to Class C. |
| Gene ontology having evidence of Inferred from Direct Assay (IDA) from Entrez |
| GO ID | GO term | PubMed ID | GO:0000038 | very long-chain fatty acid metabolic process | 16940157 | GO:0001676 | long-chain fatty acid metabolic process | 16940157 | GO:0006104 | succinyl-CoA metabolic process | 16940157 | GO:0006637 | acyl-CoA metabolic process | 16940157 | GO:0019605 | butyrate metabolic process | 16940157 | GO:0032788 | saturated monocarboxylic acid metabolic process | 16940157 | GO:0032789 | unsaturated monocarboxylic acid metabolic process | 16940157 | GO:0043648 | dicarboxylic acid metabolic process | 16940157 | GO:0043649 | dicarboxylic acid catabolic process | 16141203 | GO:0046459 | short-chain fatty acid metabolic process | 16940157 | GO:0000038 | very long-chain fatty acid metabolic process | 16940157 | GO:0001676 | long-chain fatty acid metabolic process | 16940157 | GO:0006104 | succinyl-CoA metabolic process | 16940157 | GO:0006637 | acyl-CoA metabolic process | 16940157 | GO:0019605 | butyrate metabolic process | 16940157 | GO:0032788 | saturated monocarboxylic acid metabolic process | 16940157 | GO:0032789 | unsaturated monocarboxylic acid metabolic process | 16940157 | GO:0043648 | dicarboxylic acid metabolic process | 16940157 | GO:0043649 | dicarboxylic acid catabolic process | 16141203 | GO:0046459 | short-chain fatty acid metabolic process | 16940157 |
| Top |
| TissGeneExp for ACOT4 |
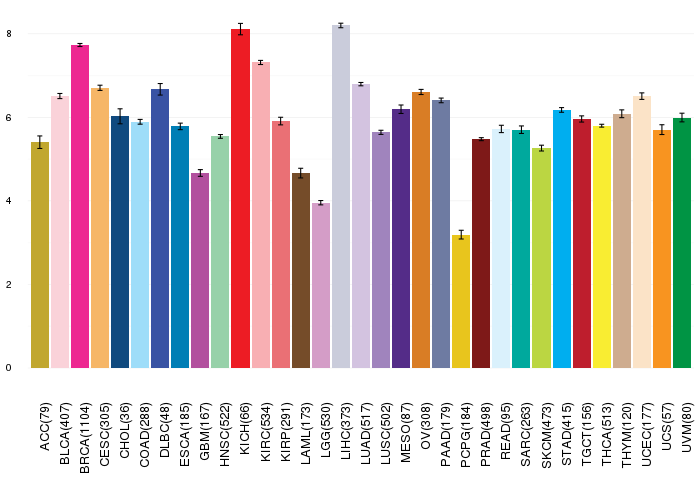
| Gene expressions across 28 cancer types (X-axis: cancer type and Y-axis: log2(norm_counts+1)) (TCGA IlluminaHiSeq_RNASeqV2, pan-cancer normalized log2(norm_counts+1) data, version 2016-08-16) |
 |
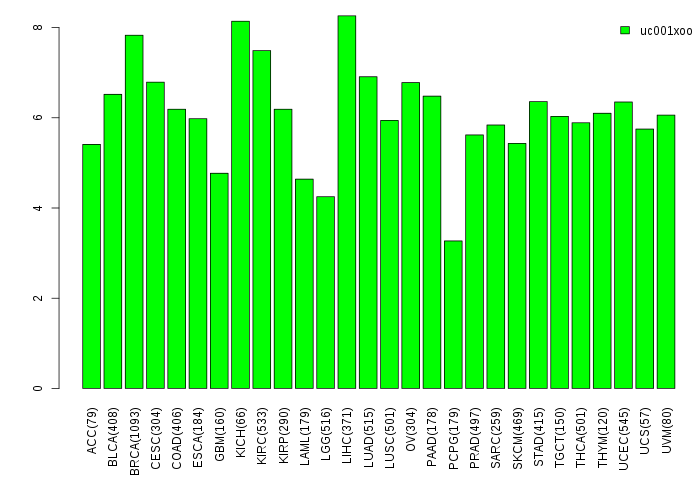
| Gene isoform expressions across 28 cancer types (X-axis: cancer type and Y-axis: log2(norm_counts+1)) (TCGA pan-cancer tcga_rsem_isoform_tpm, version 2016-09-01) |
 |
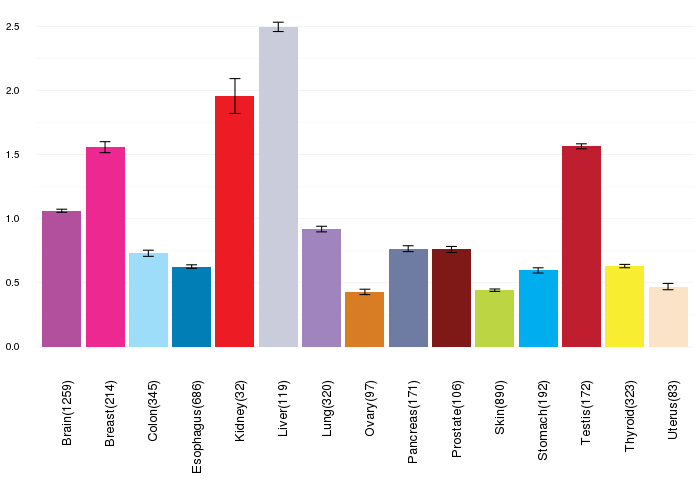
| Gene expressions across normal tissues of GTEx data (GTEx GTEx_Analysis_v6_RNA-seq_RNA-SeQCv1.1.8_gene_rpkm.gct) - Here, we shows the matched tissue types only among our 28 cancer types. |
 |
| Different expressions across 14 cancer types with more than 10 samples between matched tumors and normals (X-axis: cancer type and Y-axis: log2(norm_counts+1)) (TCGA IlluminaHiSeq_RNASeqV2, pan-cancer normalized log2(norm_counts+1) data, version 2016-08-16) |
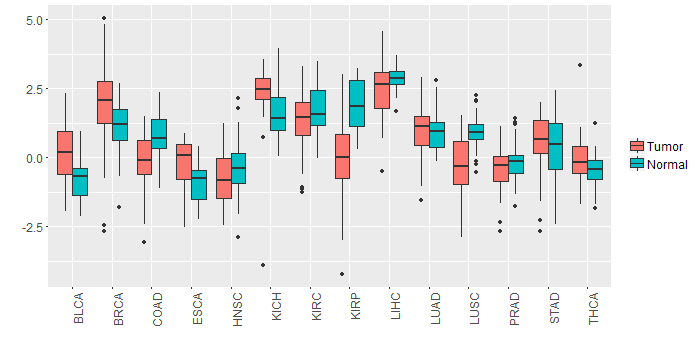 |
| - Significantly differentially expressed cancer types and information. (|Fold change|>1 and FDR<0.05) |
| Cancer type | Mean(exp) in tumor | Mean(exp) in matched normal | Log2FC | P-val. | FDR |
| LUSC | -0.232609913 | 0.916270479 | -1.148880392 | 8.43E-10 | 2.91E-09 |
| KIRP | -0.088041347 | 1.912111778 | -2.000153125 | 1.90E-07 | 1.11E-06 |
| COAD | -0.150026203 | 0.851558412 | -1.001584615 | 0.00055 | 0.001676008 |
| Top |
| TissGene-miRNA for ACOT4 |
| Significantly anti-correlated miRNAs of TissGene across 28 cancer types (Gene-miRNA relations from TargetScanHuman Relsease 7.1, Conserved_Site_Context_Scores.txt.zip, 06.01.2016) (TCGA IlluminaHiSeq_miRNASeq, log2(RPM+1) data, version 2016-11-21) (TCGA IlluminaHiSeq_RNASeqV2, log2(normalized_count+1) data, version 2016-08-16) (Spearman’s Rank Correlation (p-value<0.05 and coefficient<-0.25)) |
| Cancer type | miRNA id | miRNA accession | P-val. | Coeff. | # samples |
| Top |
| TissGeneMut for ACOT4 |
| TissGeneSNV for ACOT4 |
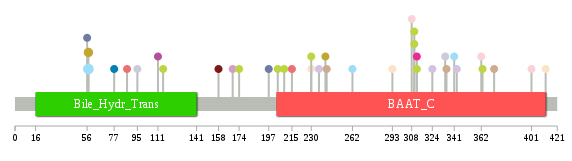
| nsSNV counts per each loci. Different colors of circles represent different cancer types. Circle size denotes number of samples. (TCGA somatic mutation (SNPs and small INDELs) data, version 2016-04-25) * Click on the image to enlarge it in a new window. |
 |
 |
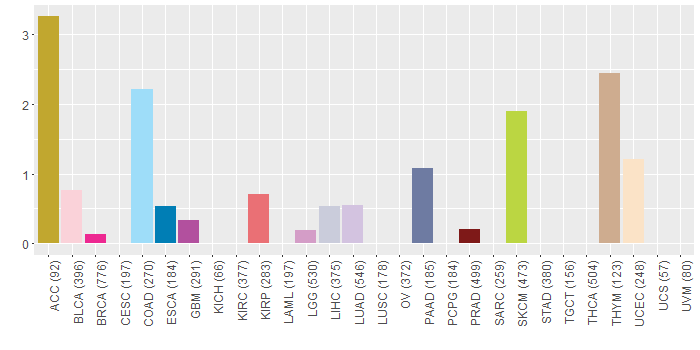
| Somatic nucleotide variants of TissGene across 28 cancer types (X-axis: cancer type and Y-axis: % of mutated samples) The numbers in parentheses are numbers of samples with mutation (nsSNVs). (TCGA somatic mutation (SNPs and small INDELs) data, version 2016-04-25) |
 |
| - nsSNVs sorted by frequency. |
| AAchange | Cancer type | # samples |
| p.R57C | COAD | 4 |
| p.R57C | ACC | 2 |
| p.A56T | PAAD | 1 |
| p.G230D | UCEC | 1 |
| p.A242S | THYM | 1 |
| p.N262T | COAD | 1 |
| p.P158Q | PRAD | 1 |
| p.K95R | LIHC | 1 |
| p.R174* | SKCM | 1 |
| p.P310S | SKCM | 1 |
| p.M215I | KIRP | 1 |
| p.G111D | GBM | 1 |
| p.E115G | SKCM | 1 |
| p.Q401R | BLCA | 1 |
| p.S204F | SKCM | 1 |
| p.E312K | SKCM | 1 |
| p.A335V | THYM | 1 |
| p.V293M | UCEC | 1 |
| p.P310L | SKCM | 1 |
| p.G412C | UCEC | 1 |
| p.Q343H | LUAD | 1 |
| p.E312Q | BRCA | 1 |
| p.D236H | LUAD | 1 |
| p.E363K | SKCM | 1 |
| p.A372T | THYM | 1 |
| p.I362M | BLCA | 1 |
| p.M241L | ACC | 1 |
| p.R341Q | HNSC | 1 |
| p.M308I | BLCA | 1 |
| p.P197H | PAAD | 1 |
| p.G230S | SKCM | 1 |
| p.P77A | ESCA | 1 |
| p.R341W | COAD | 1 |
| p.E209K | SKCM | 1 |
| p.S176R | DLBC | 1 |
| p.Q324H | LUAD | 1 |
| p.K222R | DLBC | 1 |
| p.R57C | READ | 1 |
| p.G169S | LGG | 1 |
| p.E87X | KIRP | 1 |
| p.Y334H | LIHC | 1 |
| Top |
| TissGeneCNV for ACOT4 |
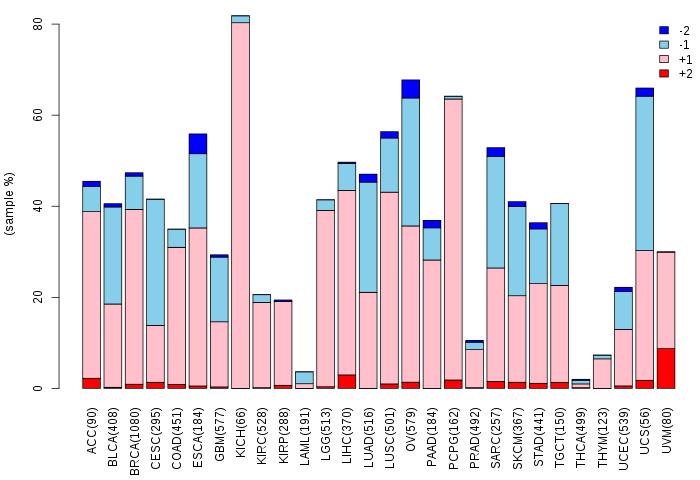
| Copy number variations of TissGene across 28 cancer types (X-axis: cancer type and Y-axis: % of CNV samples) (TCGA Gistic2_CopyNumber_Gistic2_all_data_by_genes, Gistic2 copy number data, version 2016-08-16) |
 |
| Top |
| TissGeneFusions for ACOT4 |
| Fusion genes including TissGene (ChimerDB 3.0, 2016-12-01 and TCGA fusion Portal 2015-12-01) |
| Database | Src | Cancer type | Sample | Fusion gene | ORF | 5'-gene BP | 3'-gene BP |
| TCGAfusionPortal | PRADA | LUAD | TCGA-05-4382-01A | COQ6-ACOT4 | In-frame | Chr14:74428606 | Chr14:74061753 |
| Top |
| TissGeneNet for ACOT4 |
| Co-expressed gene networks based on protein-protein interaction data (CePIN) (TCGA IlluminaHiSeq_RNASeqV2, pan-cancer normalized log2(norm_counts+1) data, version 2016-08-16) (PINA2 ppi data) |
| Top |
| TissGeneProg for ACOT4 |
| Kaplan-Meier plots with logrank tests of overall survival (OS) using 28 cancer types (TCGA IlluminaHiSeq_RNASeqV2, pan-cancer normalized log2(norm_counts+1) data, version 2016-08-16) (TCGA clinicalMatrix, phenotype data, version 2016-04-27) * Click on the image to enlarge it in a new window. |
 |
| Kaplan-Meier plots with logrank test of relapse free survival (RFS) using 28 cancer types (TCGA IlluminaHiSeq_RNASeqV2, pan-cancer normalized log2(norm_counts+1) data, version 2016-08-16) (TCGA clinicalMatrix, phenotype data, version 2016-04-27) * Click on the image enlarge it in a new window. |
 |
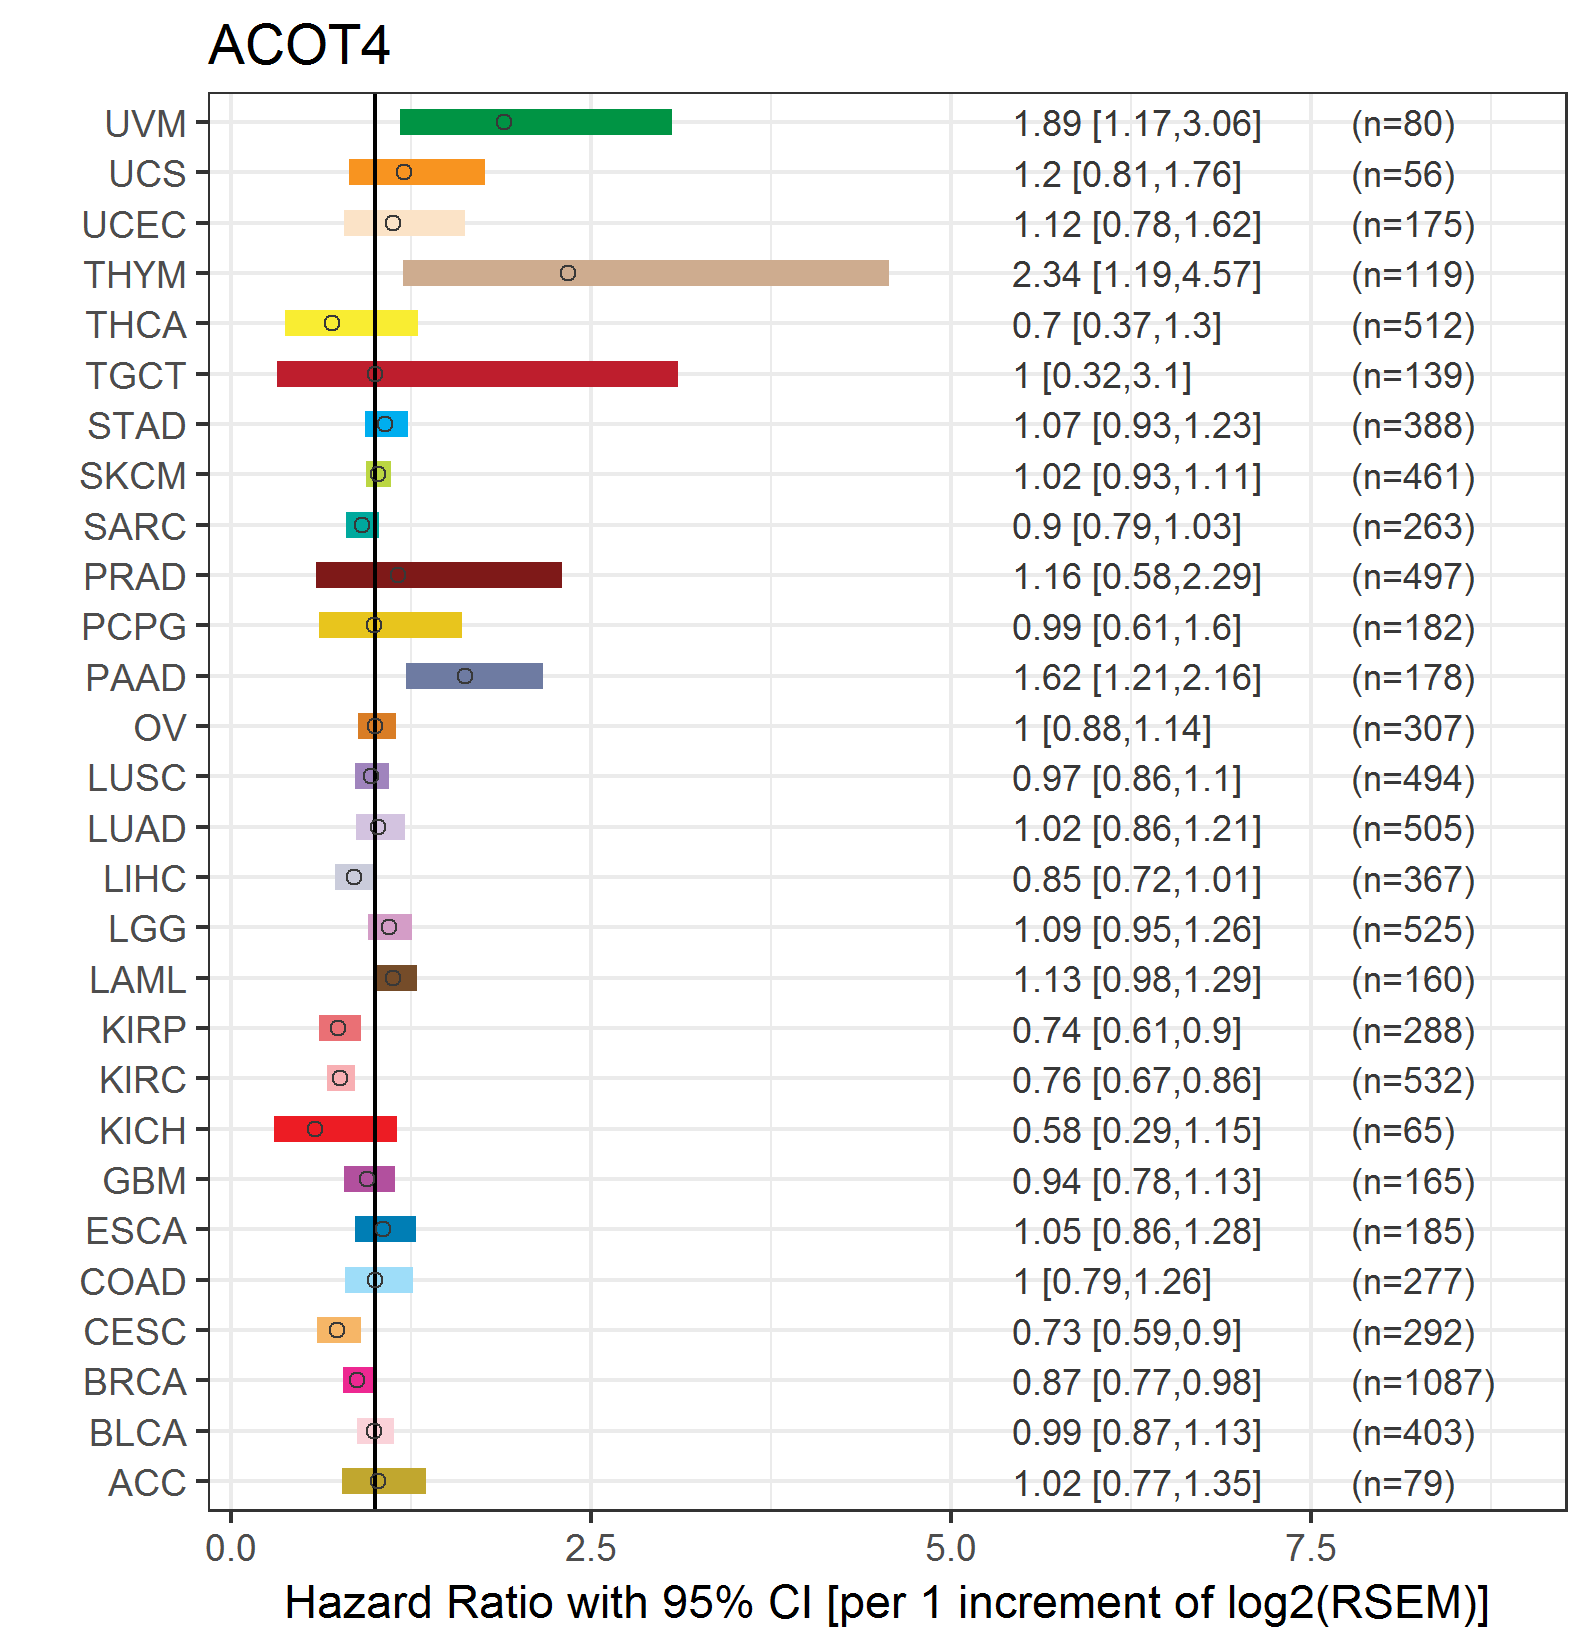
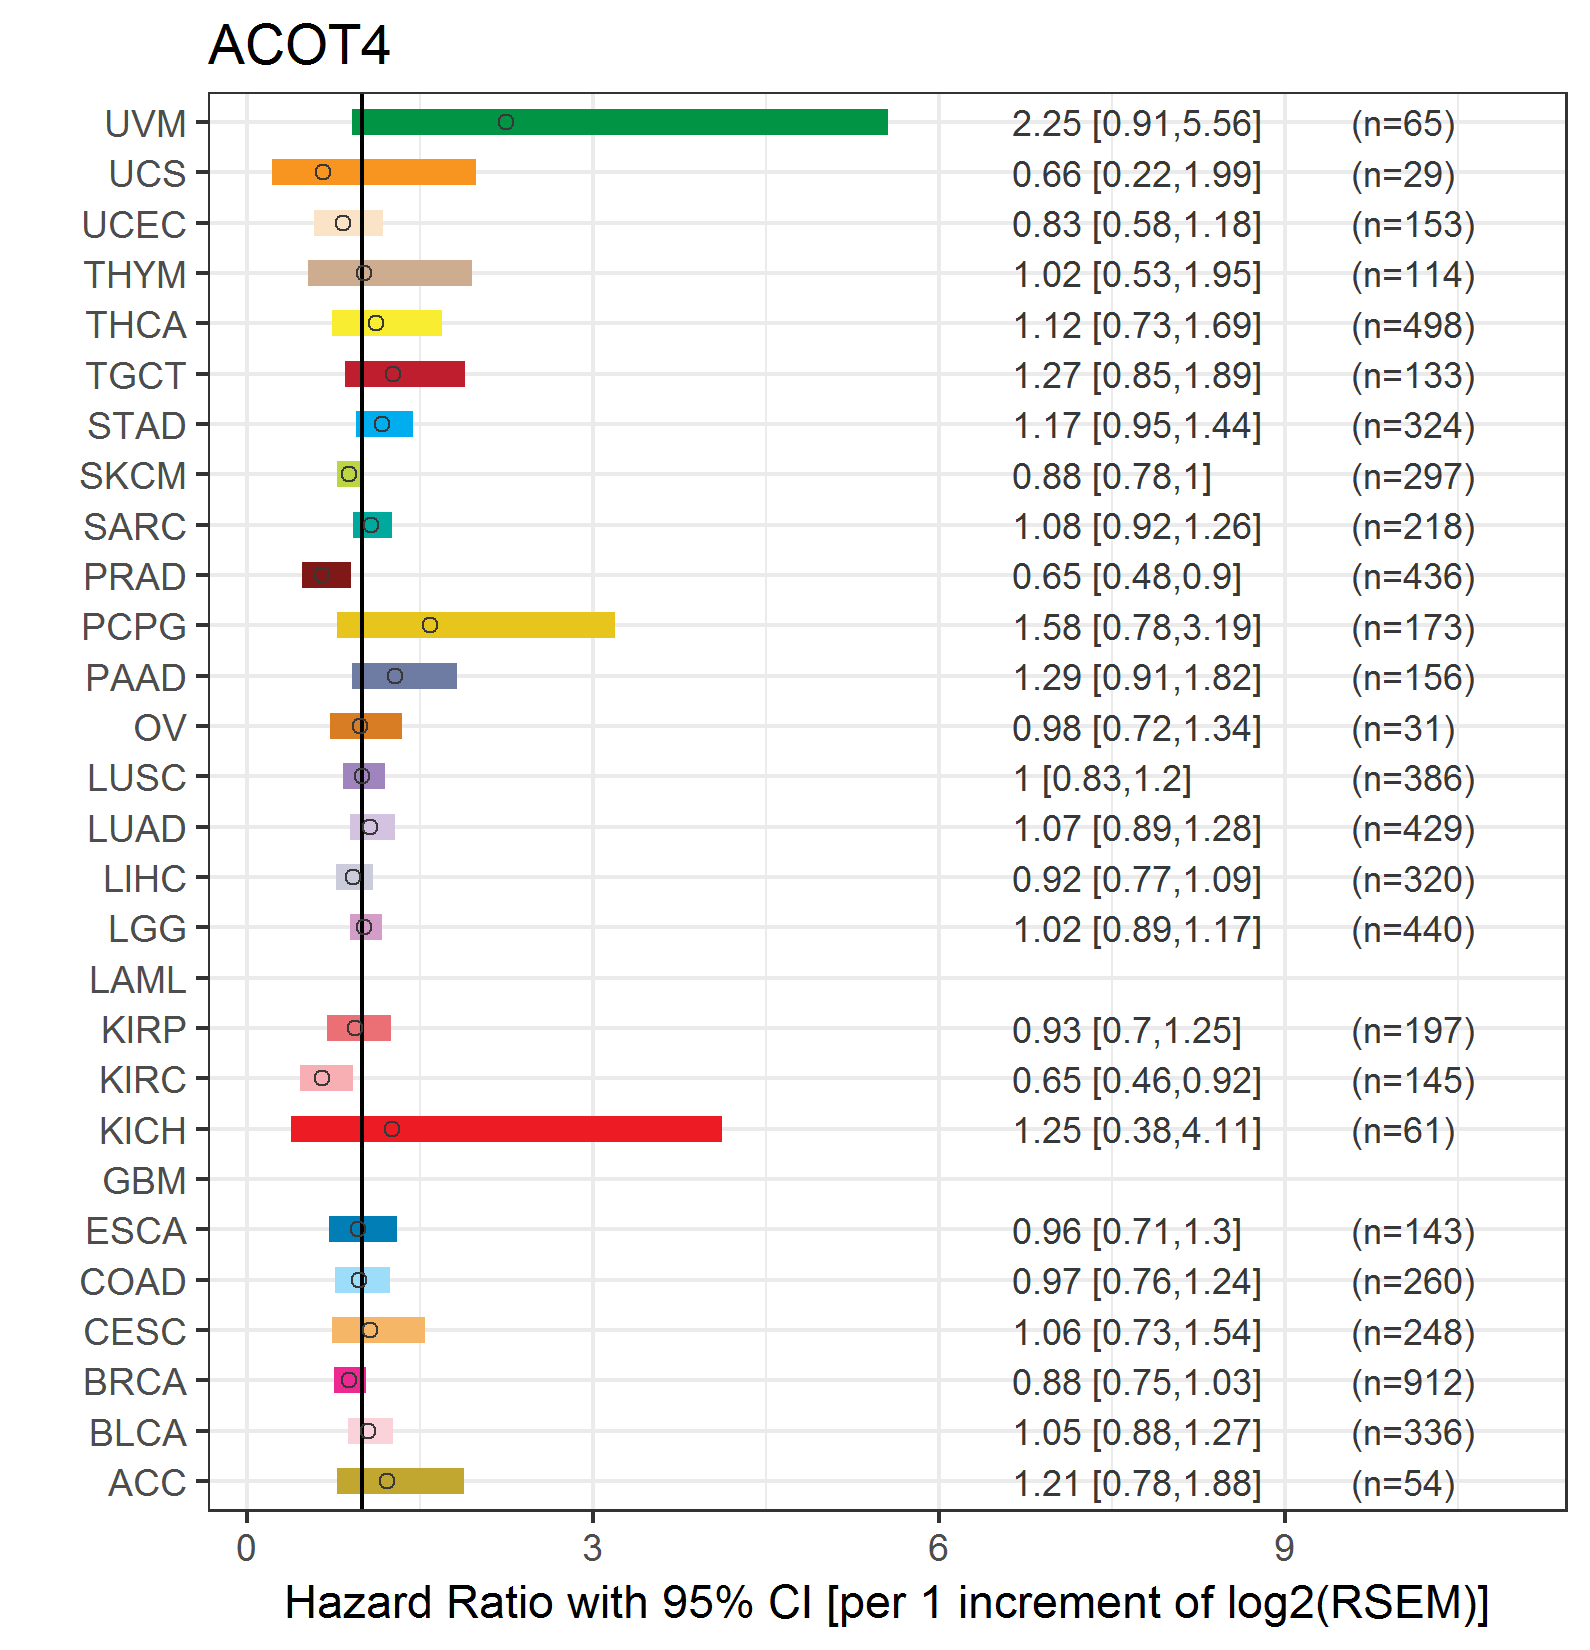
| Forest plot of Cox proportional hazard ratio (HR) and 95% CI of overall survival (OS) using 28 cancer types (TCGA IlluminaHiSeq_RNASeqV2, pan-cancer normalized log2(norm_counts+1) data, version 2016-08-16) (TCGA clinicalMatrix, phenotype data, version 2016-04-27) * Click on the image enlarge it in a new window. |
 |
| Forest plot of Cox proportional hazard ratio (HR) and 95% CI of relapse free survival (RFS) using 28 cancer types (TCGA IlluminaHiSeq_RNASeqV2, pan-cancer normalized log2(norm_counts+1) data, version 2016-08-16) (TCGA clinicalMatrix, phenotype data, version 2016-04-27) * Click on the image enlarge it in a new window. |
 |
| Top |
| TissGeneClin for ACOT4 |
| TissGeneDrug for ACOT4 |
| Drug information targeting TissGene (DrugBank Version 5.0.6, 2017-04-01) |
| DrugBank ID | Drug name | Drug activity | Drug type | Drug status |
| Top |
| TissGeneDisease for ACOT4 |
| Disease information associated with TissGene (DisGeNet, 2016-06-01) |
| Disease ID | Disease name | # pubmeds | Source |
| umls:C0038454 | Cerebrovascular accident | 1 | BeFree |
| umls:C0948008 | Ischemic stroke | 1 | BeFree |
| umls:C3272363 | Ischemic Cerebrovascular Accident | 1 | BeFree |
|
Copyright 2016-Present - The University of Texas Health Science Center at Houston (UTHealth) Web File Viewing | How to Report, Fraud, Waste and Abuse | State of Texas | Statewide Search | Texas Homeland Security | Site Policies |