 |
| |
| |
| |
| |
| |
| |
|

| TissGeneSummary for TTC8 |
 Gene summary Gene summary |
| Basic gene information | Gene symbol | TTC8 |
| Gene name | tetratricopeptide repeat domain 8 | |
| Synonyms | BBS8|RP51 | |
| Cytomap | UCSC genome browser: 14q31.3 | |
| Type of gene | protein-coding | |
| RefGenes | NM_001288781.1, NM_001288782.1,NM_001288783.1,NM_144596.3,NM_198309.3, NM_198310.3, | |
| Description | Bardet-Biedl syndrome type 8TPR repeat protein 8tetratricopeptide repeat protein 8 | |
| Modification date | 20141219 | |
| dbXrefs | MIM : 608132 | |
| HGNC : HGNC | ||
| Ensembl : ENSG00000165533 | ||
| Vega : OTTHUMG00000170884 | ||
| Protein | UniProt: go to UniProt's Cross Reference DB Table | |
| Expression | CleanEX: HS_TTC8 | |
| BioGPS: 123016 | ||
| Pathway | NCI Pathway Interaction Database: TTC8 | |
| KEGG: TTC8 | ||
| REACTOME: TTC8 | ||
| Pathway Commons: TTC8 | ||
| Context | iHOP: TTC8 | |
| ligand binding site mutation search in PubMed: TTC8 | ||
| UCL Cancer Institute: TTC8 | ||
| Assigned class in TissGDB* | C | |
| Included tissue-specific gene expression resources | TiGER,GTEx | |
| Specific-tissues in normal samples (assigned by TissGDB using HPA, TiGER, and GTEx) | OvaryProstate | |
| Cancer types related to the specific-tissues in cancer samples (assigned by TissGDB using TCGA) | OVPRAD | |
| Reference showing the relevant tissue of TTC8 | ||
| Description by TissGene annotations | ||
| * Class A consists of genes with literature evidence and is part of the cTissGenes. Class B consists of only cTissGenes without additional evidence. The remaining genes belong to Class C. |
| Gene ontology having evidence of Inferred from Direct Assay (IDA) from Entrez |
| GO ID | GO term | PubMed ID |
| Top |
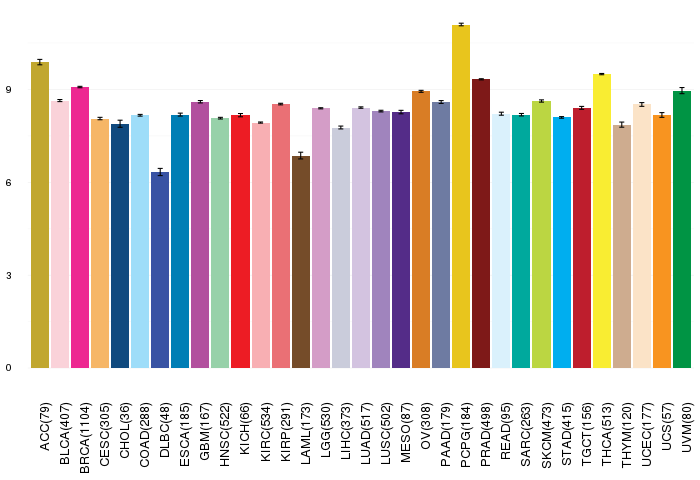
| TissGeneExp for TTC8 |
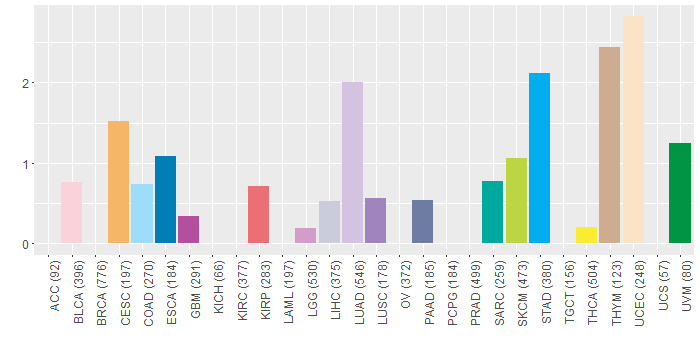
| Gene expressions across 28 cancer types (X-axis: cancer type and Y-axis: log2(norm_counts+1)) (TCGA IlluminaHiSeq_RNASeqV2, pan-cancer normalized log2(norm_counts+1) data, version 2016-08-16) |
 |
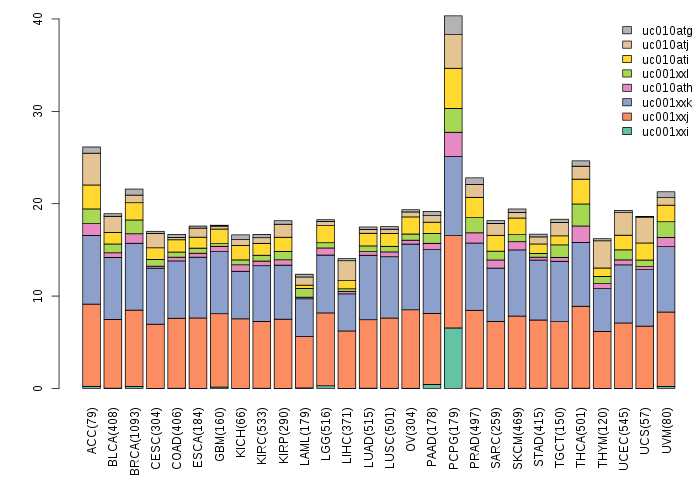
| Gene isoform expressions across 28 cancer types (X-axis: cancer type and Y-axis: log2(norm_counts+1)) (TCGA pan-cancer tcga_rsem_isoform_tpm, version 2016-09-01) |
 |
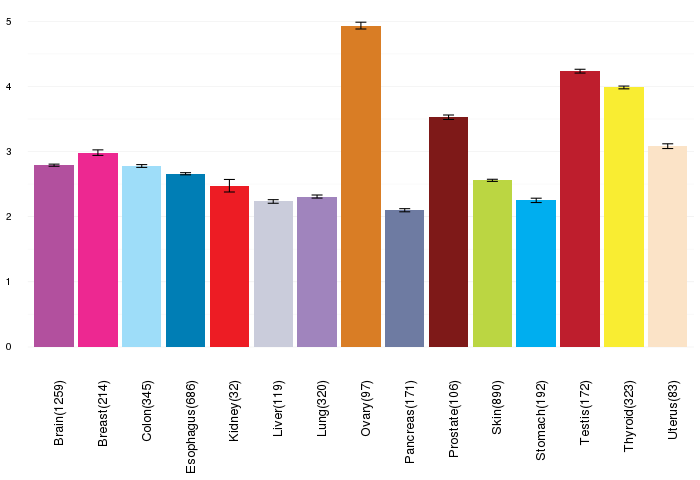
| Gene expressions across normal tissues of GTEx data (GTEx GTEx_Analysis_v6_RNA-seq_RNA-SeQCv1.1.8_gene_rpkm.gct) - Here, we shows the matched tissue types only among our 28 cancer types. |
 |
| Different expressions across 14 cancer types with more than 10 samples between matched tumors and normals (X-axis: cancer type and Y-axis: log2(norm_counts+1)) (TCGA IlluminaHiSeq_RNASeqV2, pan-cancer normalized log2(norm_counts+1) data, version 2016-08-16) |
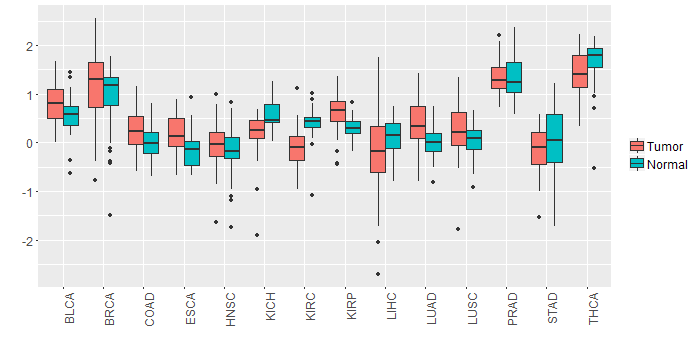 |
| - Significantly differentially expressed cancer types and information. (|Fold change|>1 and FDR<0.05) |
| Cancer type | Mean(exp) in tumor | Mean(exp) in matched normal | Log2FC | P-val. | FDR |
| Top |
| TissGene-miRNA for TTC8 |
| Significantly anti-correlated miRNAs of TissGene across 28 cancer types (Gene-miRNA relations from TargetScanHuman Relsease 7.1, Conserved_Site_Context_Scores.txt.zip, 06.01.2016) (TCGA IlluminaHiSeq_miRNASeq, log2(RPM+1) data, version 2016-11-21) (TCGA IlluminaHiSeq_RNASeqV2, log2(normalized_count+1) data, version 2016-08-16) (Spearman’s Rank Correlation (p-value<0.05 and coefficient<-0.25)) |
| Cancer type | miRNA id | miRNA accession | P-val. | Coeff. | # samples |
| Top |
| TissGeneMut for TTC8 |
| TissGeneSNV for TTC8 |
| nsSNV counts per each loci. Different colors of circles represent different cancer types. Circle size denotes number of samples. (TCGA somatic mutation (SNPs and small INDELs) data, version 2016-04-25) * Click on the image to enlarge it in a new window. |
 |
 |
| Somatic nucleotide variants of TissGene across 28 cancer types (X-axis: cancer type and Y-axis: % of mutated samples) The numbers in parentheses are numbers of samples with mutation (nsSNVs). (TCGA somatic mutation (SNPs and small INDELs) data, version 2016-04-25) |
 |
| - nsSNVs sorted by frequency. |
| AAchange | Cancer type | # samples |
| p.A439V | SKCM | 1 |
| p.I139S | STAD | 1 |
| p.D500G | STAD | 1 |
| p.W416L | LUAD | 1 |
| p.I329M | LIHC | 1 |
| p.N322S | LUSC | 1 |
| p.Q86H | STAD | 1 |
| p.A431T | UCEC | 1 |
| p.A468T | STAD | 1 |
| p.A447T | STAD | 1 |
| p.A413V | SKCM | 1 |
| p.D516G | STAD | 1 |
| p.A504S | UCEC | 1 |
| p.D393V | SKCM | 1 |
| p.N452I | SARC | 1 |
| p.R17L | LUAD | 1 |
| p.E393X | ESCA | 1 |
| p.Q498H | CESC | 1 |
| p.R367Q | HNSC | 1 |
| p.E43K | CESC | 1 |
| p.I129S | STAD | 1 |
| p.D490G | PAAD | 1 |
| p.Y236H | STAD | 1 |
| p.R363L | GBM | 1 |
| p.P95L | LGG | 1 |
| p.E307Q | HNSC | 1 |
| p.D55H | SKCM | 1 |
| p.I129V | BLCA | 1 |
| p.A452T | STAD | 1 |
| p.D367V | SKCM | 1 |
| p.T134I | SKCM | 1 |
| p.P483S | LUAD | 1 |
| p.L362I | SKCM | 1 |
| p.S210C | THCA | 1 |
| p.S378Y | COAD | 1 |
| p.N443K | HNSC | 1 |
| p.Q76H | STAD | 1 |
| p.R401C | UVM | 1 |
| p.A447T | UCEC | 1 |
| p.R133S | PAAD | 1 |
| p.E66D | UCEC | 1 |
| p.L296P | LUAD | 1 |
| p.H446R | DLBC | 1 |
| p.Q471* | CESC | 1 |
| p.P87H | BLCA | 1 |
| p.V46M | PAAD | 1 |
| p.C435F | SARC | 1 |
| p.R237M | STAD | 1 |
| p.L161P | UCEC | 1 |
| p.A439V | KIRP | 1 |
| p.A182S | CHOL | 1 |
| p.F353L | BLCA | 1 |
| p.S236C | THCA | 1 |
| p.V326L | THYM | 1 |
| p.A431T | STAD | 1 |
| p.K444N | CHOL | 1 |
| p.K223N | THYM | 1 |
| p.A311T | UCEC | 1 |
| p.R367L | LUAD | 1 |
| p.A330T | UCEC | 1 |
| p.E409K | LUAD | 1 |
| p.A461S | THYM | 1 |
| p.Y388C | LUAD | 1 |
| p.K444N | LIHC | 1 |
| p.V46L | STAD | 1 |
| p.R385C | UVM | 1 |
| p.G93V | LUAD | 1 |
| p.H341N | LUAD | 1 |
| p.G372C | LUAD | 1 |
| p.M458I | LUAD | 1 |
| p.S129R | KIRP | 1 |
| p.Y252H | STAD | 1 |
| p.A192S | CHOL | 1 |
| p.A423V | KIRP | 1 |
| p.E50X | COAD | 1 |
| p.R89C | ESCA | 1 |
| p.R232H | COAD | 1 |
| p.S119R | KIRP | 1 |
| p.A202T | UCEC | 1 |
| p.R143S | PAAD | 1 |
| p.P40R | HNSC | 1 |
| Top |
| TissGeneCNV for TTC8 |
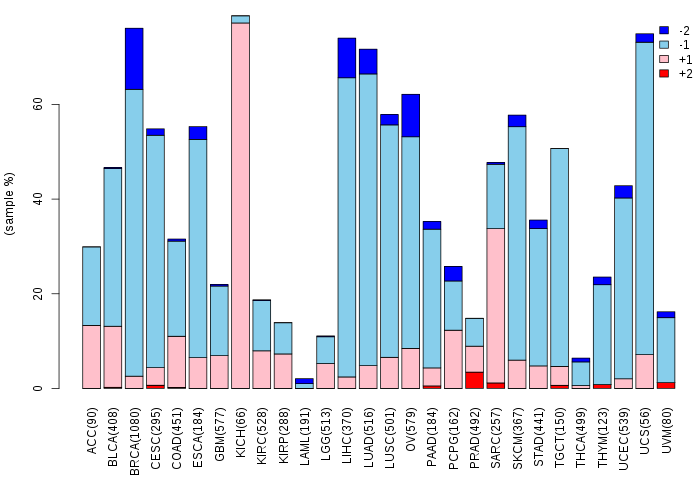
| Copy number variations of TissGene across 28 cancer types (X-axis: cancer type and Y-axis: % of CNV samples) (TCGA Gistic2_CopyNumber_Gistic2_all_data_by_genes, Gistic2 copy number data, version 2016-08-16) |
 |
| Top |
| TissGeneFusions for TTC8 |
| Fusion genes including TissGene (ChimerDB 3.0, 2016-12-01 and TCGA fusion Portal 2015-12-01) |
| Database | Src | Cancer type | Sample | Fusion gene | ORF | 5'-gene BP | 3'-gene BP |
| Chimerdb3.0 | FusionScan | PCPG | TCGA-TT-A6YN-01A | GFRA3-TTC8 | In-Frame | chr5:137588975 | chr14:89341369 |
| Chimerdb3.0 | FusionScan | PCPG | TCGA-TT-A6YN-01A | GFRA3-TTC8 | Out-of-Frame | chr5:137589454 | chr14:89341369 |
| Chimerdb3.0 | FusionScan | PCPG | TCGA-TT-A6YN-01A | GFRA3-TTC8 | Out-of-Frame | chr5:137593327 | chr14:89341369 |
| Chimerdb3.0 | FusionScan | PCPG | TCGA-TT-A6YN-01A | GFRA3-TTC8 | In-Frame | chr5:137588975 | chr14:89343637 |
| Chimerdb3.0 | TopHat-Fusion | PCPG | TCGA-TT-A6YN-01A | GFRA3-TTC8 | In-Frame | chr5:137588975 | chr14:89341369 |
| Chimerdb3.0 | TopHat-Fusion | PCPG | TCGA-TT-A6YN-01A | GFRA3-TTC8 | Out-of-Frame | chr5:137589454 | chr14:89341369 |
| Top |
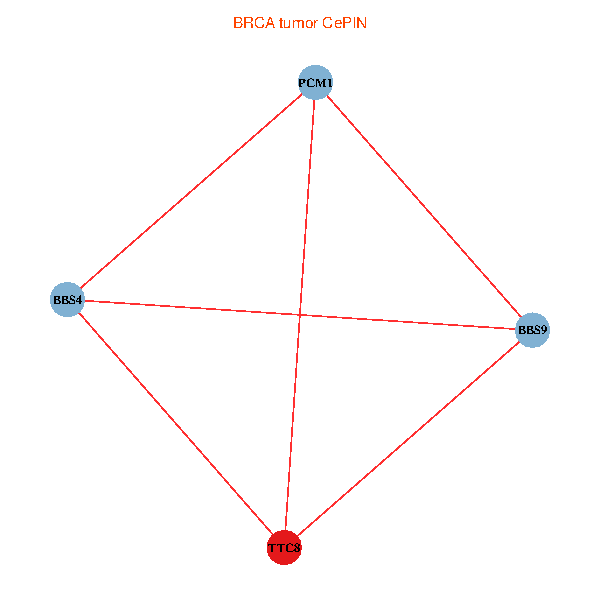
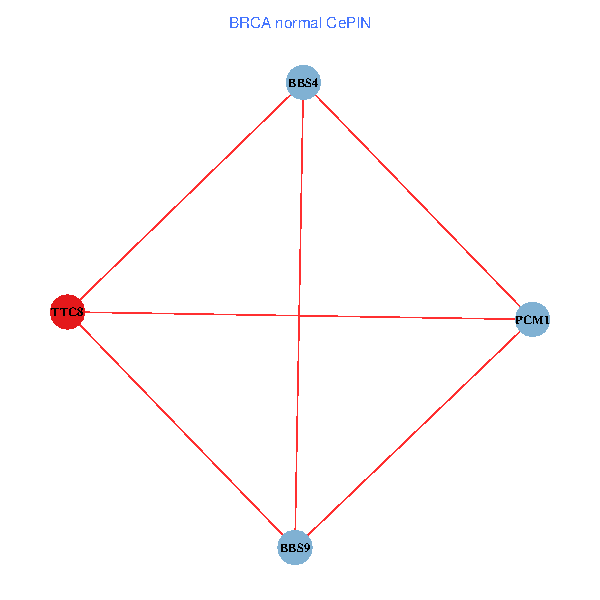
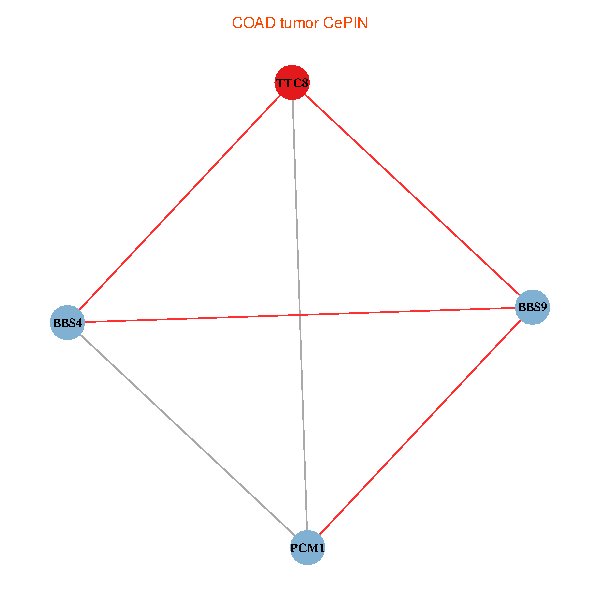
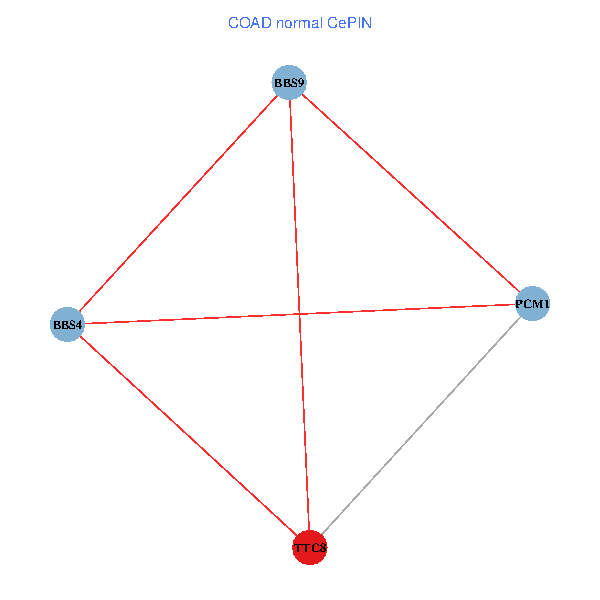
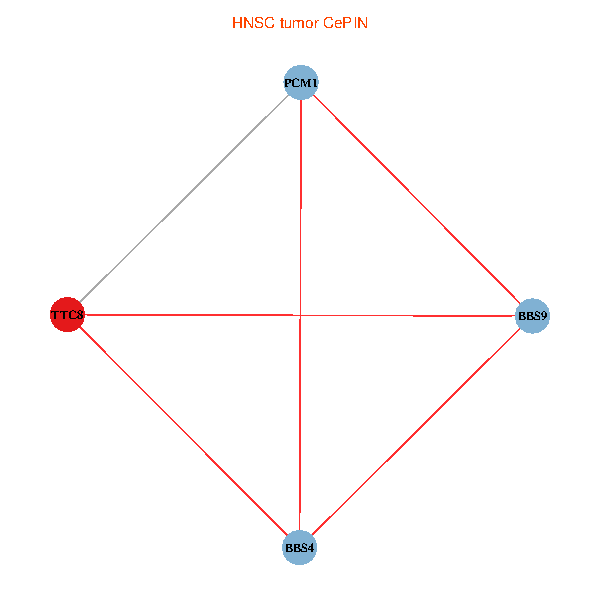
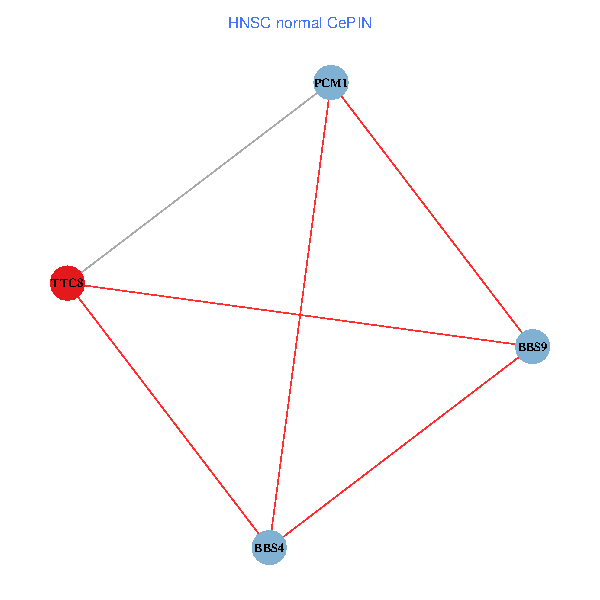
| TissGeneNet for TTC8 |
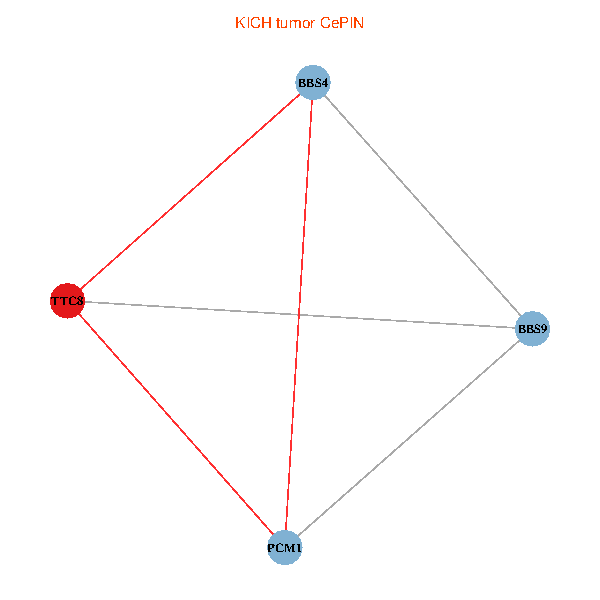
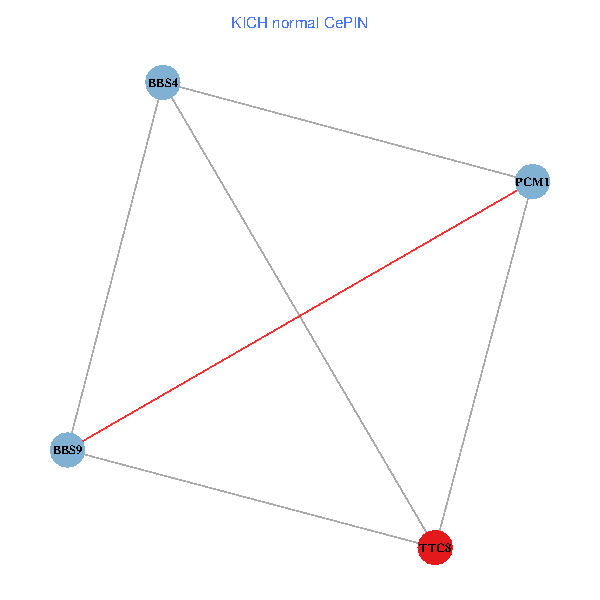
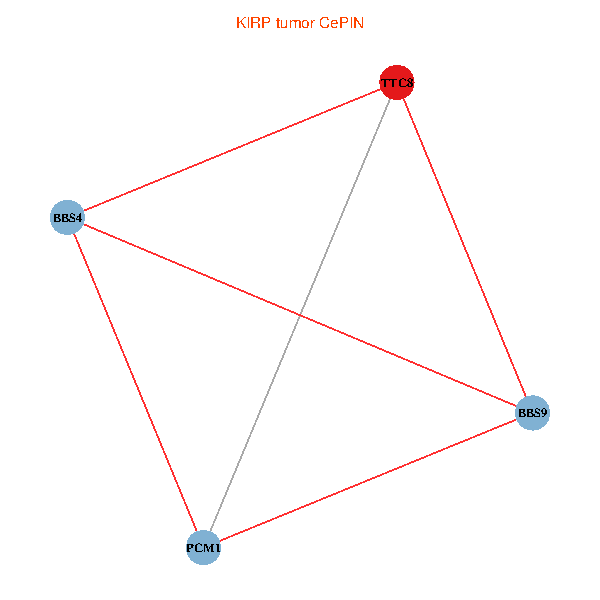
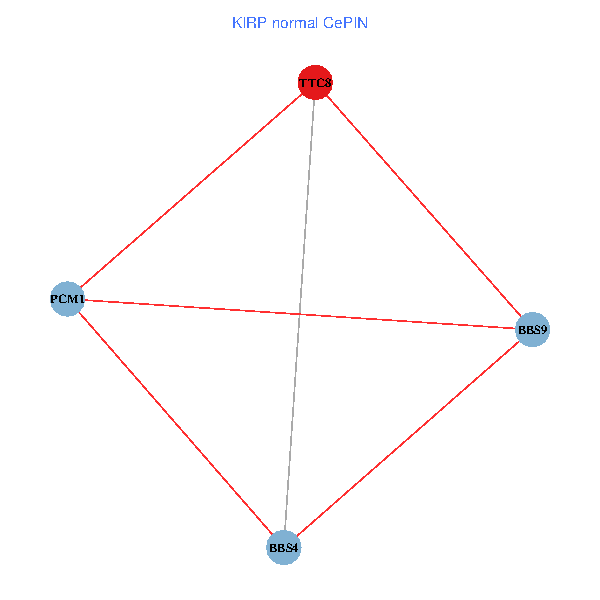
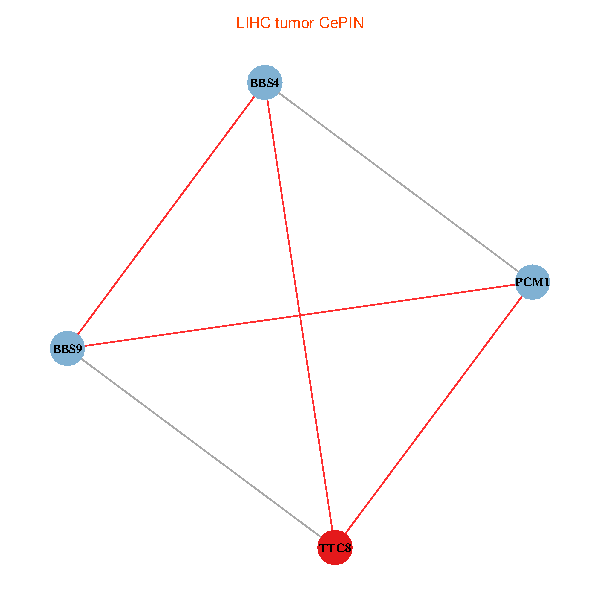
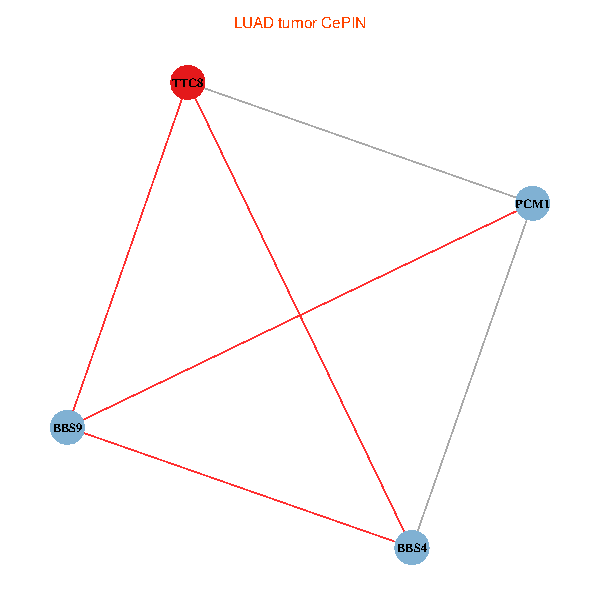
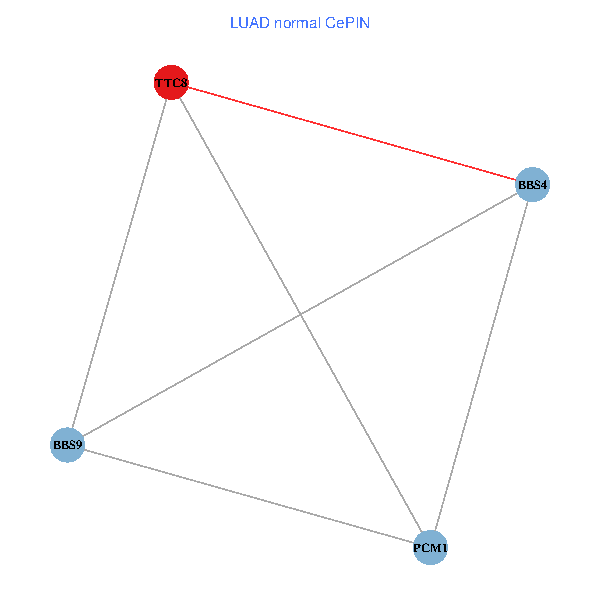
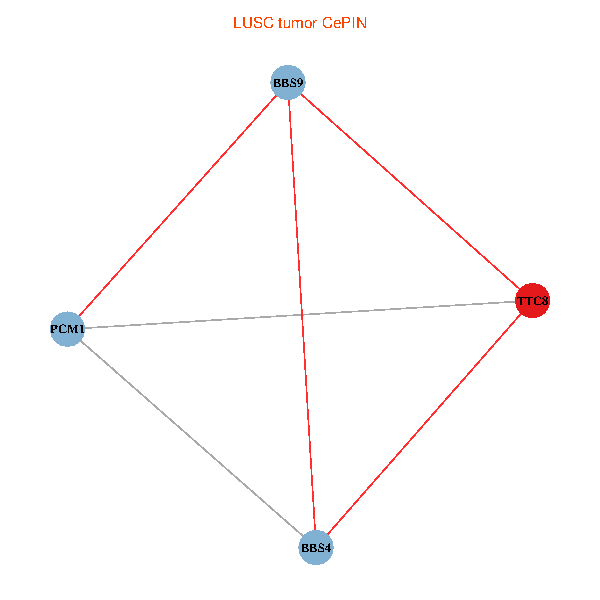
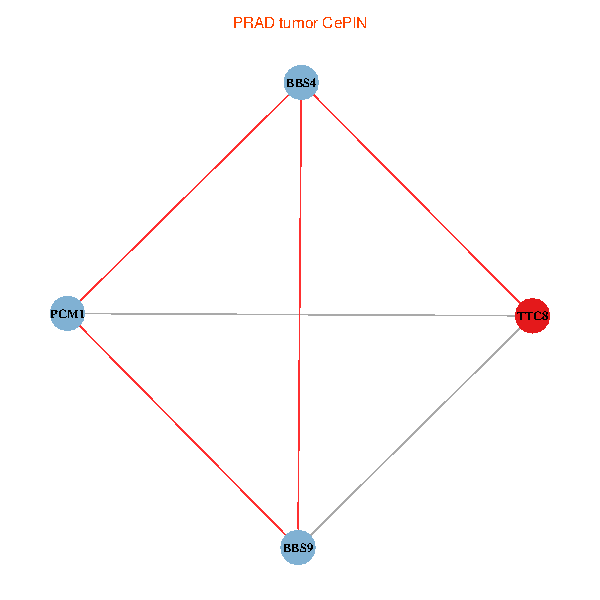
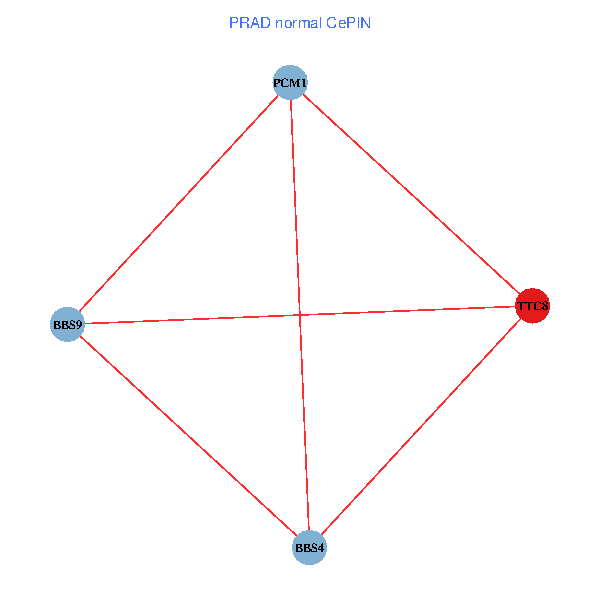
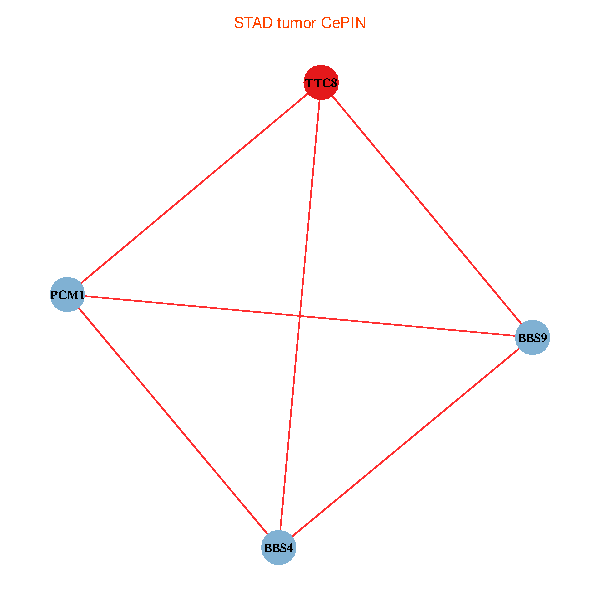
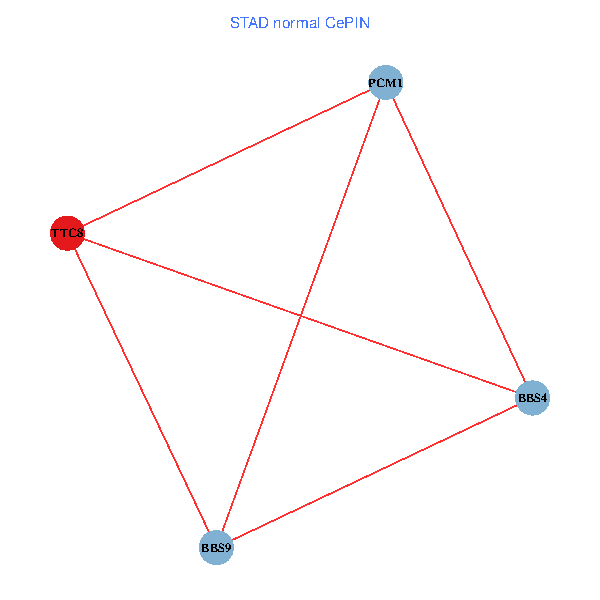
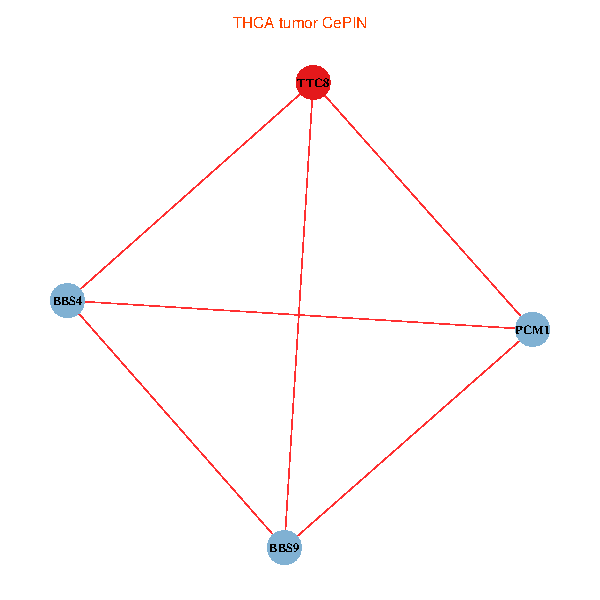
| Co-expressed gene networks based on protein-protein interaction data (CePIN) (TCGA IlluminaHiSeq_RNASeqV2, pan-cancer normalized log2(norm_counts+1) data, version 2016-08-16) (PINA2 ppi data) |
| BRCA (tumor) | BRCA (normal) |
| TTC8, PCM1, BBS4, BBS9 (tumor) | TTC8, PCM1, BBS4, BBS9 (normal) |
 |  |
| COAD (tumor) | COAD (normal) |
| TTC8, PCM1, BBS4, BBS9 (tumor) | TTC8, PCM1, BBS4, BBS9 (normal) |
 |  |
| HNSC (tumor) | HNSC (normal) |
| TTC8, PCM1, BBS4, BBS9 (tumor) | TTC8, PCM1, BBS4, BBS9 (normal) |
 |  |
| KICH (tumor) | KICH (normal) |
| TTC8, PCM1, BBS4, BBS9 (tumor) | TTC8, PCM1, BBS4, BBS9 (normal) |
 |  |
| KIRC (tumor) | KIRC (normal) |
| TTC8, PCM1, BBS4, BBS9 (tumor) | TTC8, PCM1, BBS4, BBS9 (normal) |
 |  |
| KIRP (tumor) | KIRP (normal) |
| TTC8, PCM1, BBS4, BBS9 (tumor) | TTC8, PCM1, BBS4, BBS9 (normal) |
 |  |
| LIHC (tumor) | LIHC (normal) |
| TTC8, PCM1, BBS4, BBS9 (tumor) | TTC8, PCM1, BBS4, BBS9 (normal) |
 |  |
| LUAD (tumor) | LUAD (normal) |
| TTC8, PCM1, BBS4, BBS9 (tumor) | TTC8, PCM1, BBS4, BBS9 (normal) |
 |  |
| LUSC (tumor) | LUSC (normal) |
| TTC8, PCM1, BBS4, BBS9 (tumor) | TTC8, PCM1, BBS4, BBS9 (normal) |
 |  |
| PRAD (tumor) | PRAD (normal) |
| TTC8, PCM1, BBS4, BBS9 (tumor) | TTC8, PCM1, BBS4, BBS9 (normal) |
 |  |
| STAD (tumor) | STAD (normal) |
| TTC8, PCM1, BBS4, BBS9 (tumor) | TTC8, PCM1, BBS4, BBS9 (normal) |
 |  |
| THCA (tumor) | THCA (normal) |
| TTC8, PCM1, BBS4, BBS9 (tumor) | TTC8, PCM1, BBS4, BBS9 (normal) |
 |  |
| Top |
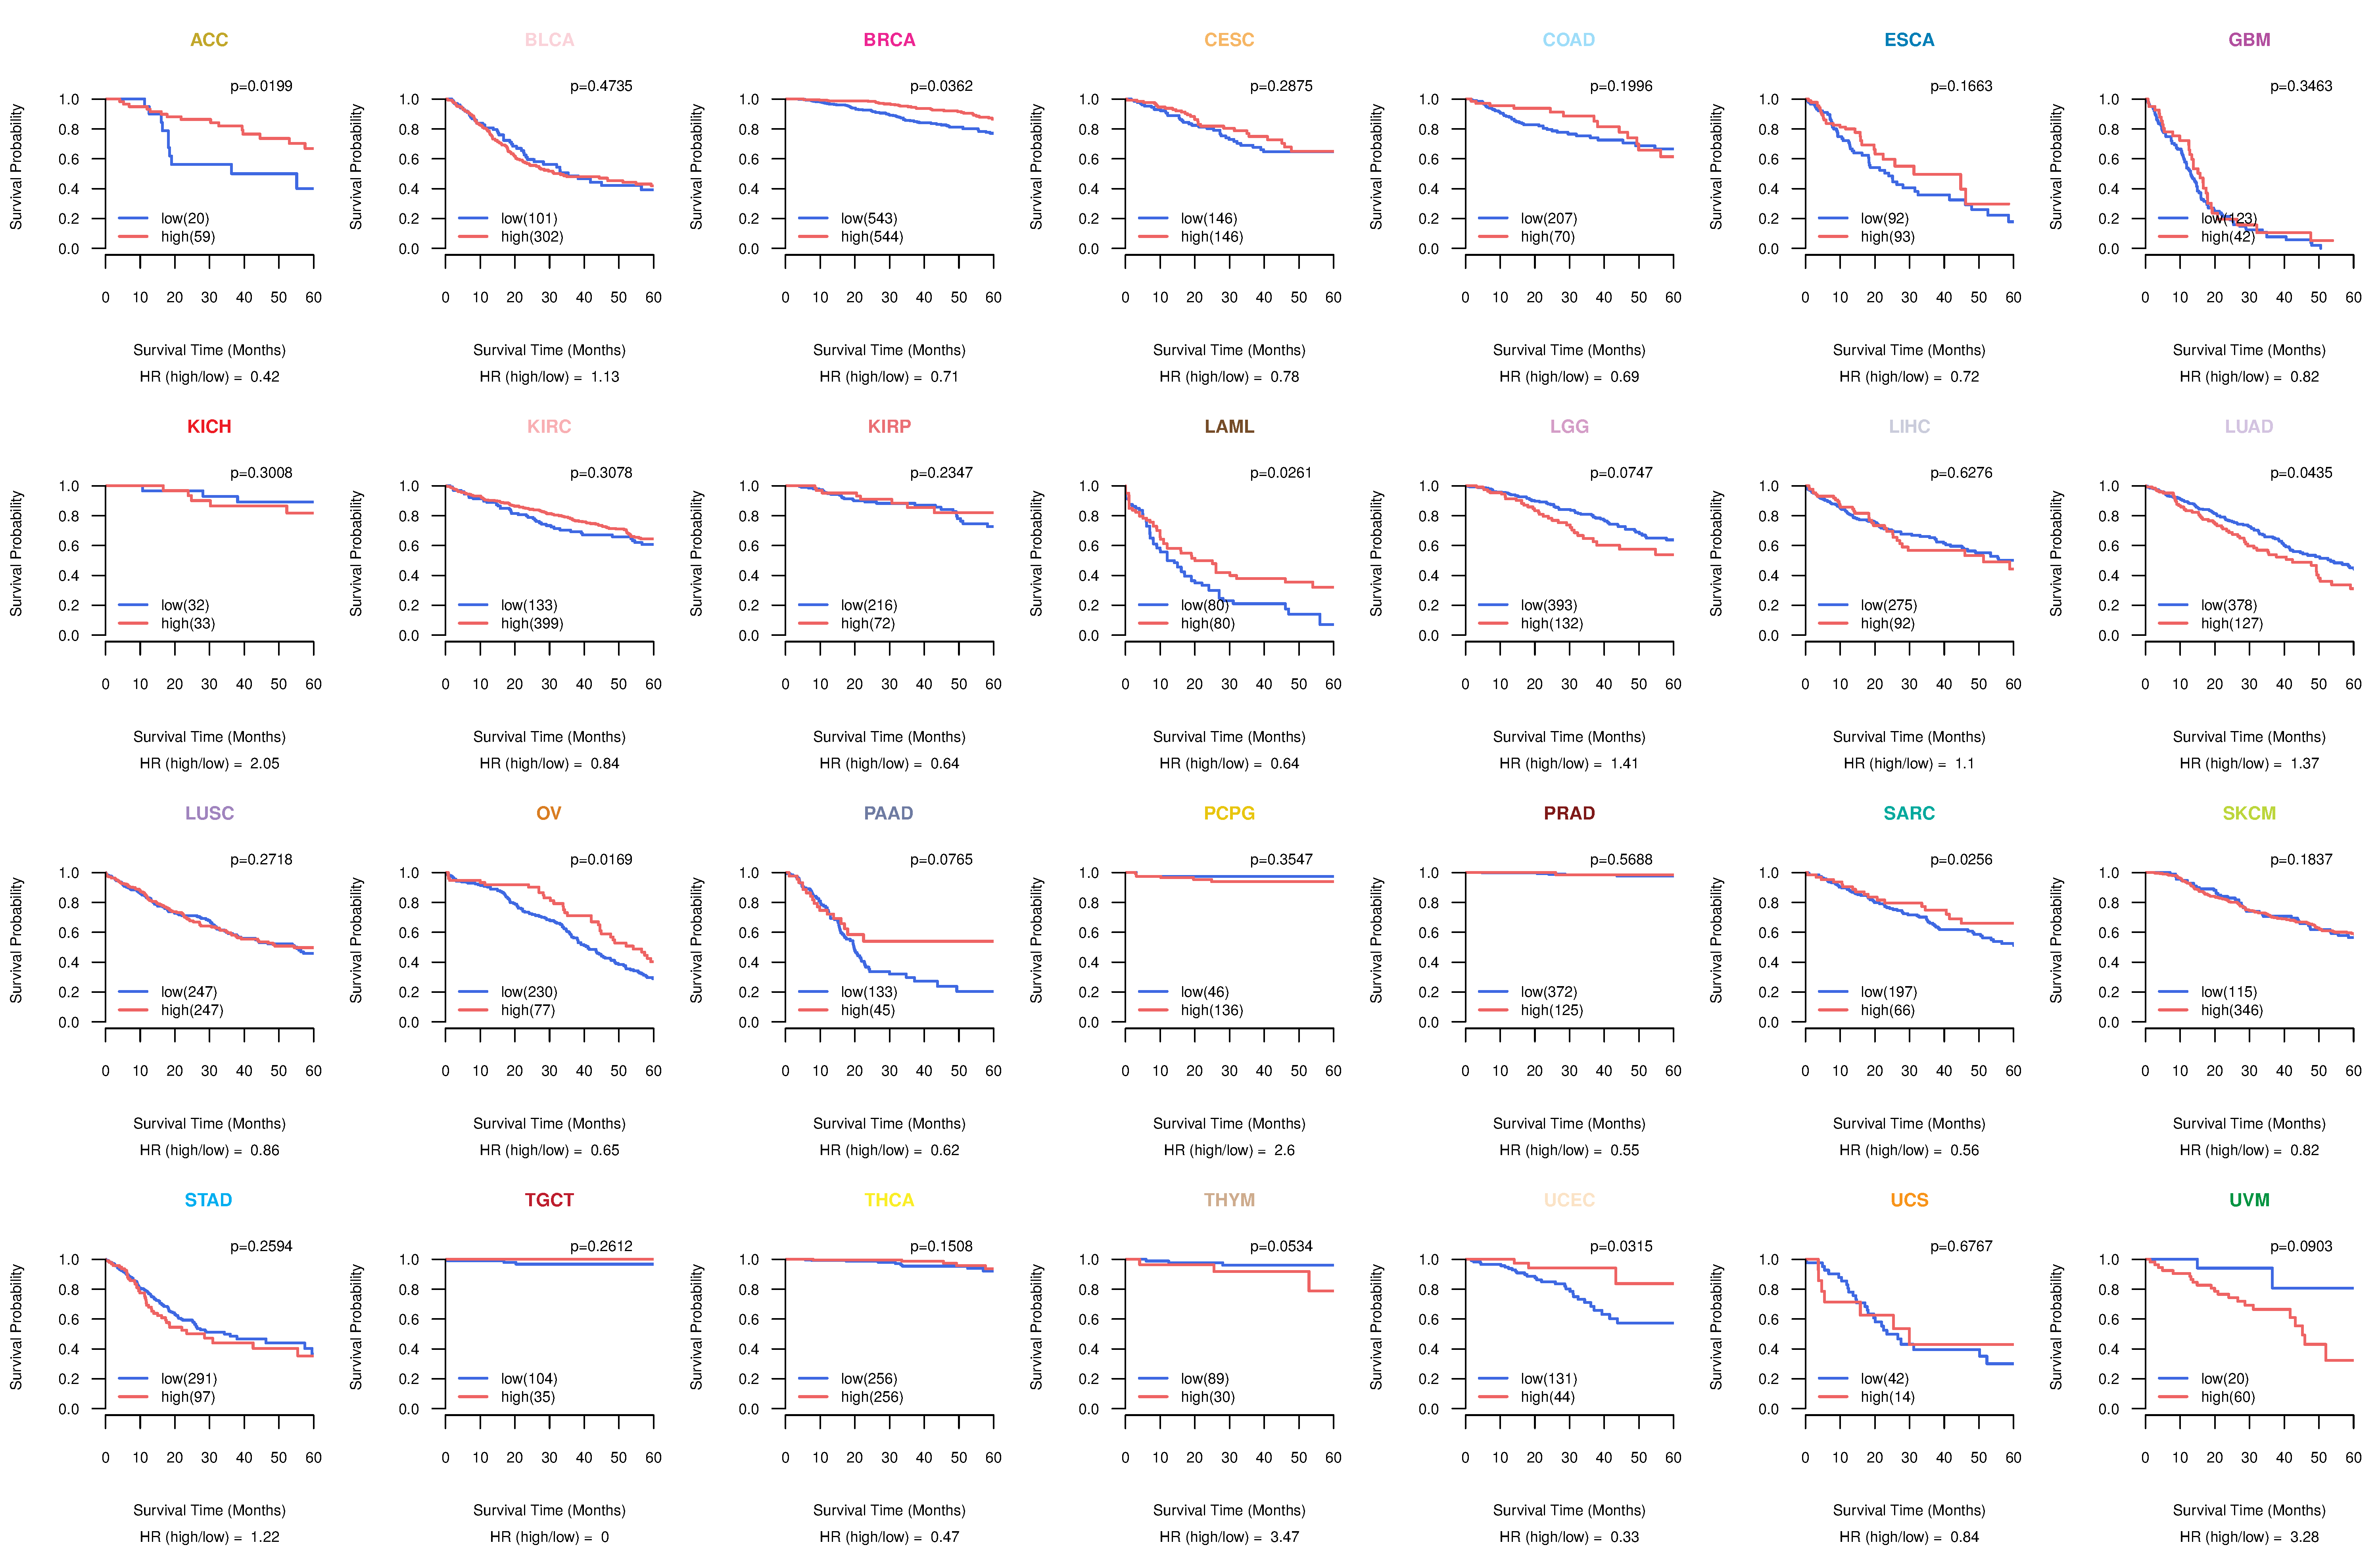
| TissGeneProg for TTC8 |
| Kaplan-Meier plots with logrank tests of overall survival (OS) using 28 cancer types (TCGA IlluminaHiSeq_RNASeqV2, pan-cancer normalized log2(norm_counts+1) data, version 2016-08-16) (TCGA clinicalMatrix, phenotype data, version 2016-04-27) * Click on the image to enlarge it in a new window. |
 |
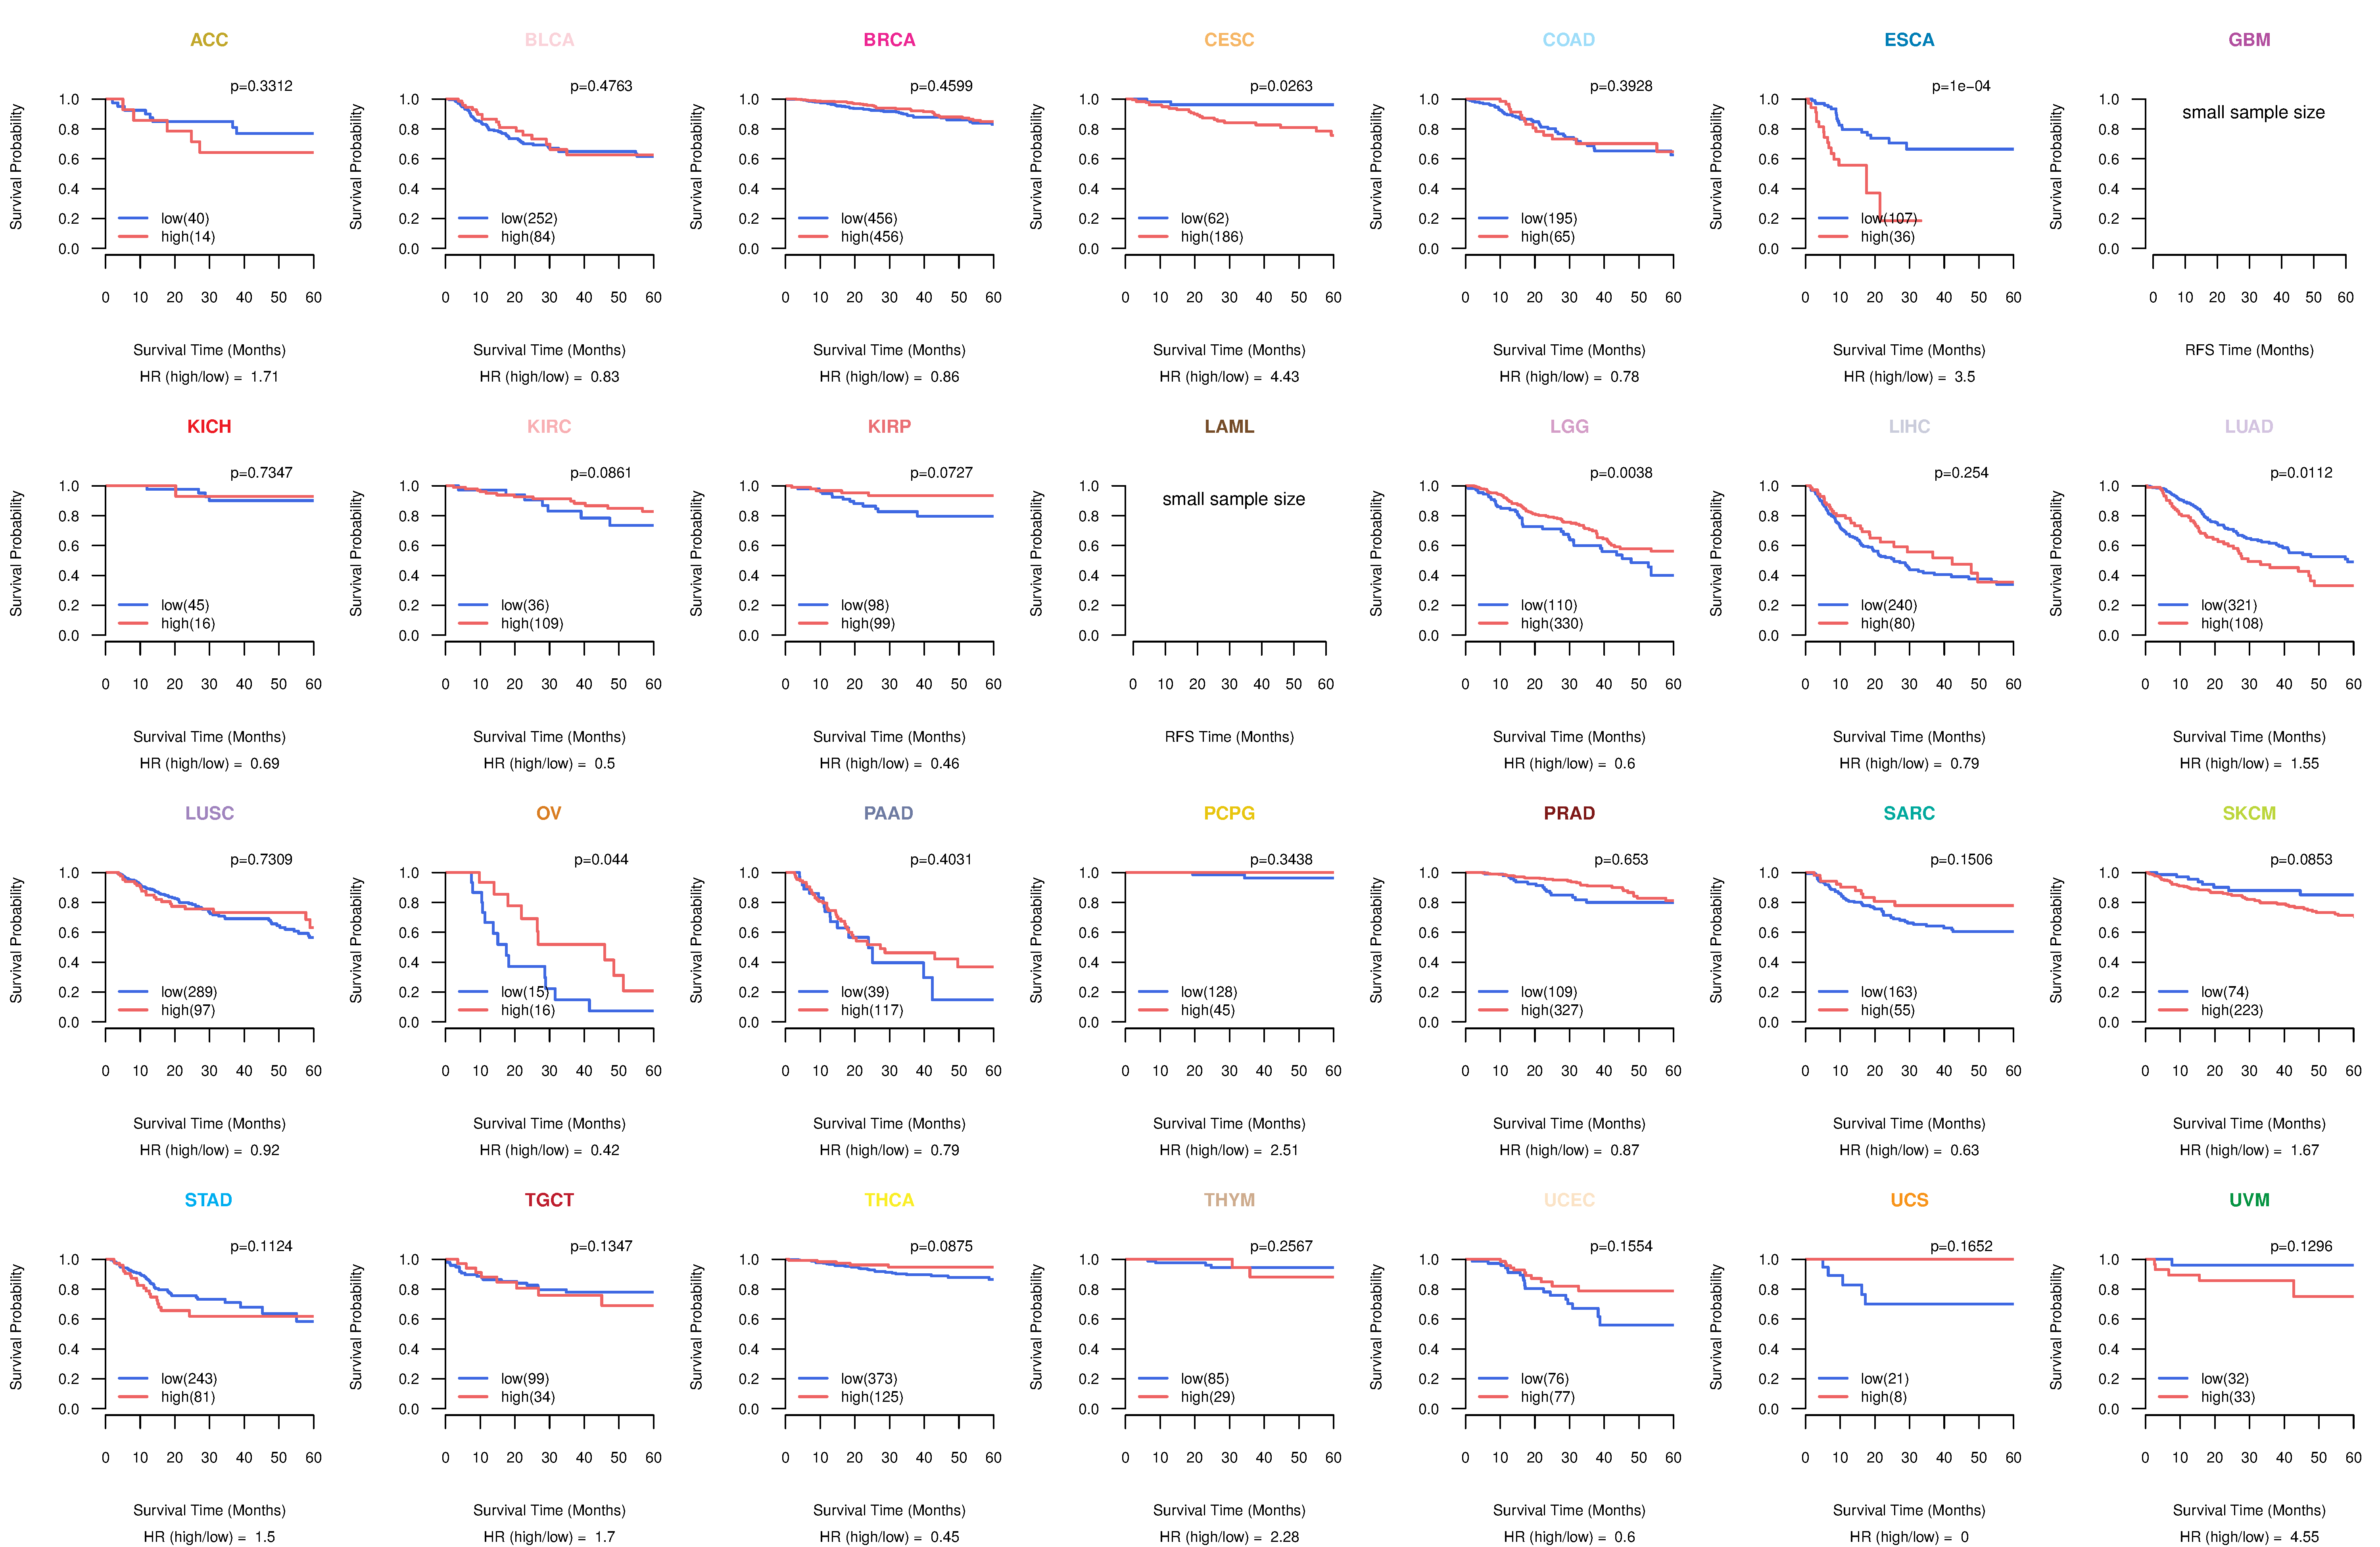
| Kaplan-Meier plots with logrank test of relapse free survival (RFS) using 28 cancer types (TCGA IlluminaHiSeq_RNASeqV2, pan-cancer normalized log2(norm_counts+1) data, version 2016-08-16) (TCGA clinicalMatrix, phenotype data, version 2016-04-27) * Click on the image enlarge it in a new window. |
 |
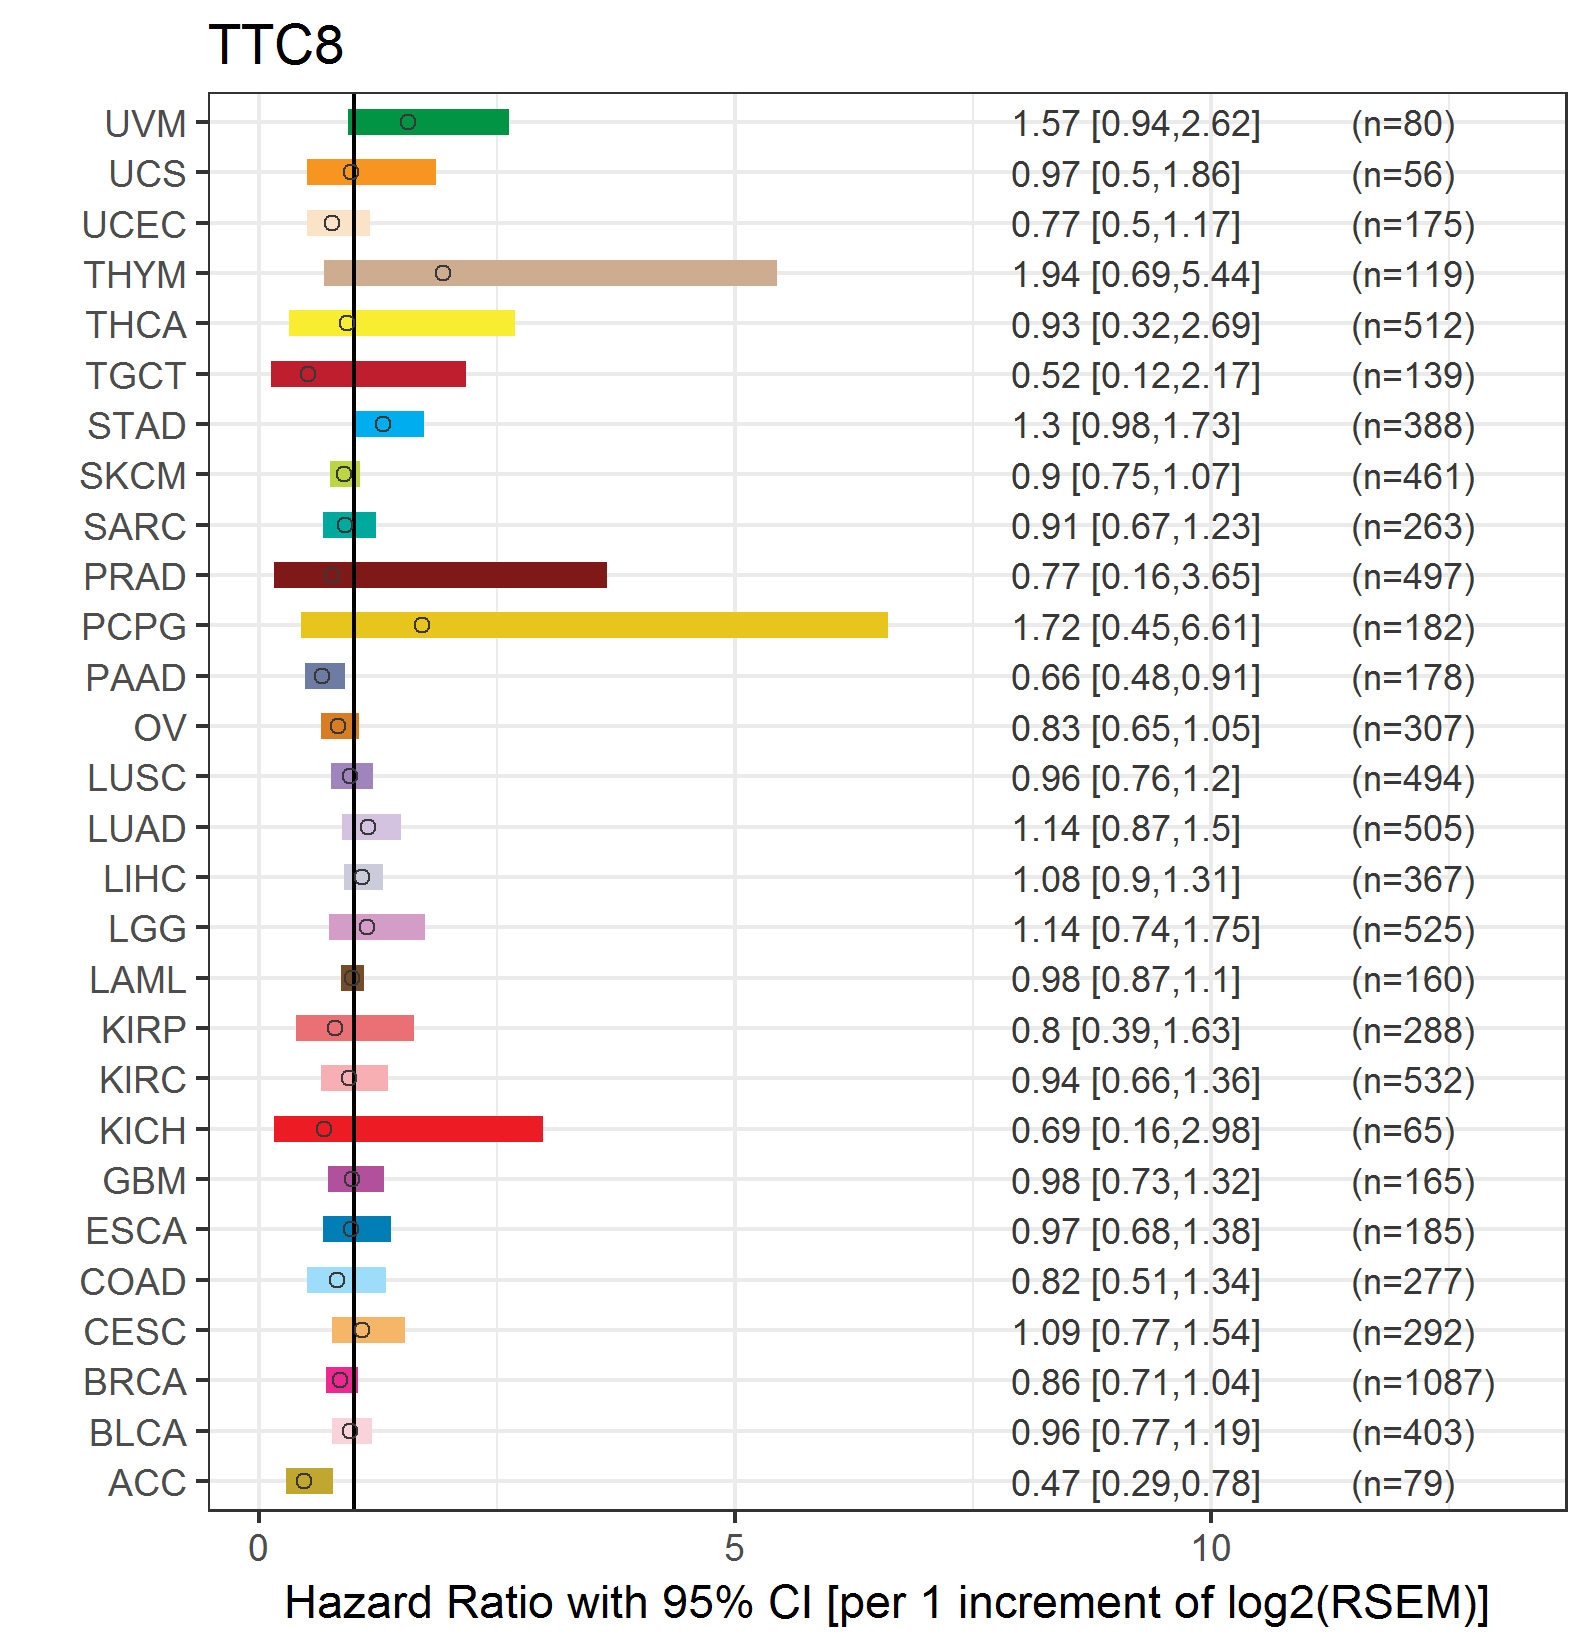
| Forest plot of Cox proportional hazard ratio (HR) and 95% CI of overall survival (OS) using 28 cancer types (TCGA IlluminaHiSeq_RNASeqV2, pan-cancer normalized log2(norm_counts+1) data, version 2016-08-16) (TCGA clinicalMatrix, phenotype data, version 2016-04-27) * Click on the image enlarge it in a new window. |
 |
| Forest plot of Cox proportional hazard ratio (HR) and 95% CI of relapse free survival (RFS) using 28 cancer types (TCGA IlluminaHiSeq_RNASeqV2, pan-cancer normalized log2(norm_counts+1) data, version 2016-08-16) (TCGA clinicalMatrix, phenotype data, version 2016-04-27) * Click on the image enlarge it in a new window. |
 |
| Top |
| TissGeneClin for TTC8 |
| TissGeneDrug for TTC8 |
| Drug information targeting TissGene (DrugBank Version 5.0.6, 2017-04-01) |
| DrugBank ID | Drug name | Drug activity | Drug type | Drug status |
| Top |
| TissGeneDisease for TTC8 |
| Disease information associated with TissGene (DisGeNet, 2016-06-01) |
| Disease ID | Disease name | # pubmeds | Source |
| umls:C0752166 | Bardet-Biedl Syndrome | 5 | BeFree,CTD_human,GAD,LHGDN,ORPHANET |
| umls:C0028754 | Obesity | 1 | GAD |
| umls:C0035309 | Retinal Diseases | 1 | GAD |
| umls:C0035334 | Retinitis Pigmentosa | 1 | BeFree,ORPHANET |
| umls:C0231530 | Muscle twitch | 1 | BeFree |
| umls:C1859566 | BARDET-BIEDL SYNDROME 8 | 0 | CLINVAR,MGD |
| umls:C3150715 | RETINITIS PIGMENTOSA 51 | 0 | CLINVAR,CTD_human |
|
Copyright 2016-Present - The University of Texas Health Science Center at Houston (UTHealth) Web File Viewing | How to Report, Fraud, Waste and Abuse | State of Texas | Statewide Search | Texas Homeland Security | Site Policies |