 |
| |
| |
| |
| |
| |
| |
|

| TissGeneSummary for KLHDC7A |
 Gene summary Gene summary |
| Basic gene information | Gene symbol | KLHDC7A |
| Gene name | kelch domain containing 7A | |
| Synonyms | - | |
| Cytomap | UCSC genome browser: 1p36.13 | |
| Type of gene | protein-coding | |
| RefGenes | NM_152375.2, | |
| Description | kelch domain-containing protein 7A | |
| Modification date | 20141207 | |
| dbXrefs | HGNC : HGNC | |
| Ensembl : ENSG00000179023 | ||
| HPRD : 08246 | ||
| Vega : OTTHUMG00000002431 | ||
| Protein | UniProt: go to UniProt's Cross Reference DB Table | |
| Expression | CleanEX: HS_KLHDC7A | |
| BioGPS: 127707 | ||
| Pathway | NCI Pathway Interaction Database: KLHDC7A | |
| KEGG: KLHDC7A | ||
| REACTOME: KLHDC7A | ||
| Pathway Commons: KLHDC7A | ||
| Context | iHOP: KLHDC7A | |
| ligand binding site mutation search in PubMed: KLHDC7A | ||
| UCL Cancer Institute: KLHDC7A | ||
| Assigned class in TissGDB* | C | |
| Included tissue-specific gene expression resources | TiGER,GTEx | |
| Specific-tissues in normal samples (assigned by TissGDB using HPA, TiGER, and GTEx) | Kidney | |
| Cancer types related to the specific-tissues in cancer samples (assigned by TissGDB using TCGA) | KIRC,KIRP,KICH | |
| Reference showing the relevant tissue of KLHDC7A | ||
| Description by TissGene annotations | Protective TissGene in OS Protective TissGene in RFS | |
| * Class A consists of genes with literature evidence and is part of the cTissGenes. Class B consists of only cTissGenes without additional evidence. The remaining genes belong to Class C. |
| Gene ontology having evidence of Inferred from Direct Assay (IDA) from Entrez |
| GO ID | GO term | PubMed ID |
| Top |
| TissGeneExp for KLHDC7A |
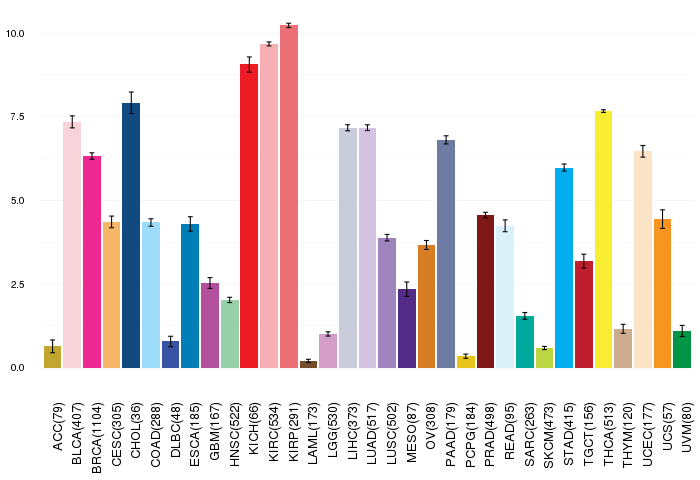
| Gene expressions across 28 cancer types (X-axis: cancer type and Y-axis: log2(norm_counts+1)) (TCGA IlluminaHiSeq_RNASeqV2, pan-cancer normalized log2(norm_counts+1) data, version 2016-08-16) |
 |
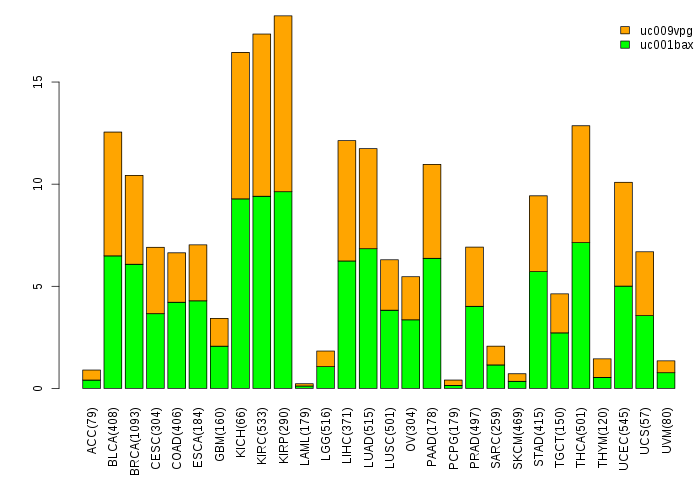
| Gene isoform expressions across 28 cancer types (X-axis: cancer type and Y-axis: log2(norm_counts+1)) (TCGA pan-cancer tcga_rsem_isoform_tpm, version 2016-09-01) |
 |
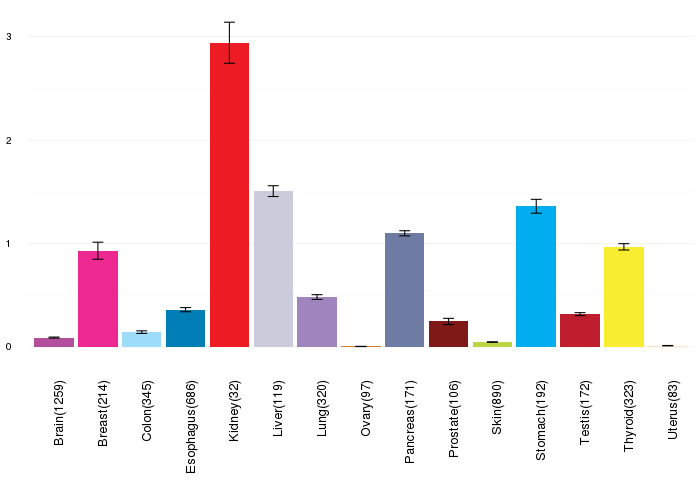
| Gene expressions across normal tissues of GTEx data (GTEx GTEx_Analysis_v6_RNA-seq_RNA-SeQCv1.1.8_gene_rpkm.gct) - Here, we shows the matched tissue types only among our 28 cancer types. |
 |
| Different expressions across 14 cancer types with more than 10 samples between matched tumors and normals (X-axis: cancer type and Y-axis: log2(norm_counts+1)) (TCGA IlluminaHiSeq_RNASeqV2, pan-cancer normalized log2(norm_counts+1) data, version 2016-08-16) |
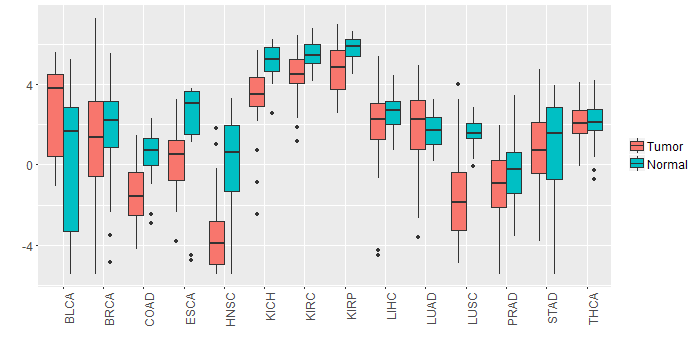 |
| - Significantly differentially expressed cancer types and information. (|Fold change|>1 and FDR<0.05) |
| Cancer type | Mean(exp) in tumor | Mean(exp) in matched normal | Log2FC | P-val. | FDR |
| KIRP | 4.690340225 | 5.762421475 | -1.07208125 | 1.79E-05 | 7.14E-05 |
| KIRC | 4.4591871 | 5.516096822 | -1.056909722 | 5.23E-11 | 1.92E-10 |
| LUSC | -1.584864616 | 1.624568718 | -3.209433333 | 3.29E-14 | 1.79E-13 |
| HNSC | -3.525883539 | 0.248107158 | -3.773990698 | 3.10E-13 | 1.34E-11 |
| COAD | -1.398694631 | 0.371155369 | -1.76985 | 6.08E-05 | 0.000235358 |
| KICH | 3.2616146 | 5.1390626 | -1.877448 | 6.56E-05 | 0.000178277 |
| Top |
| TissGene-miRNA for KLHDC7A |
| Significantly anti-correlated miRNAs of TissGene across 28 cancer types (Gene-miRNA relations from TargetScanHuman Relsease 7.1, Conserved_Site_Context_Scores.txt.zip, 06.01.2016) (TCGA IlluminaHiSeq_miRNASeq, log2(RPM+1) data, version 2016-11-21) (TCGA IlluminaHiSeq_RNASeqV2, log2(normalized_count+1) data, version 2016-08-16) (Spearman’s Rank Correlation (p-value<0.05 and coefficient<-0.25)) |
| Cancer type | miRNA id | miRNA accession | P-val. | Coeff. | # samples |
| Top |
| TissGeneMut for KLHDC7A |
| TissGeneSNV for KLHDC7A |
| nsSNV counts per each loci. Different colors of circles represent different cancer types. Circle size denotes number of samples. (TCGA somatic mutation (SNPs and small INDELs) data, version 2016-04-25) * Click on the image to enlarge it in a new window. |
 |
 |
| Somatic nucleotide variants of TissGene across 28 cancer types (X-axis: cancer type and Y-axis: % of mutated samples) The numbers in parentheses are numbers of samples with mutation (nsSNVs). (TCGA somatic mutation (SNPs and small INDELs) data, version 2016-04-25) |
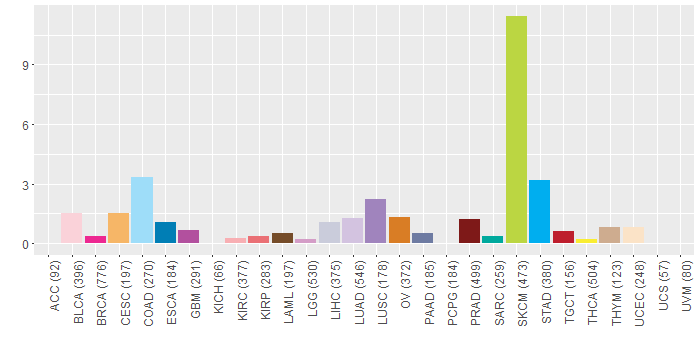 |
| - nsSNVs sorted by frequency. |
| AAchange | Cancer type | # samples |
| p.E635K | SKCM | 12 |
| p.T351P | COAD | 4 |
| p.E460K | SKCM | 3 |
| p.R160S | COAD | 2 |
| p.G171R | SKCM | 2 |
| p.D771N | SKCM | 2 |
| p.D291N | SKCM | 2 |
| p.R269Q | LUSC | 1 |
| p.K666* | STAD | 1 |
| p.W569* | STAD | 1 |
| p.E344K | PAAD | 1 |
| p.V21L | COAD | 1 |
| p.R611L | PRAD | 1 |
| p.T351P | BRCA | 1 |
| p.E195K | SKCM | 1 |
| p.R558C | OV | 1 |
| p.P355S | SKCM | 1 |
| p.T669M | LAML | 1 |
| p.R126Q | ESCA | 1 |
| p.P80L | LIHC | 1 |
| p.E195K | LUSC | 1 |
| p.S468N | SKCM | 1 |
| p.R744G | STAD | 1 |
| p.V764I | OV | 1 |
| p.E481K | SKCM | 1 |
| p.R519H | STAD | 1 |
| p.P390L | SKCM | 1 |
| p.A255T | STAD | 1 |
| p.A629T | PRAD | 1 |
| p.R751Q | HNSC | 1 |
| p.E704K | BLCA | 1 |
| p.E144K | SKCM | 1 |
| p.H273Q | LIHC | 1 |
| p.W569X | STAD | 1 |
| p.A755D | LUAD | 1 |
| p.V289L | TGCT | 1 |
| p.V638I | HNSC | 1 |
| p.R523P | LUAD | 1 |
| p.S530F | SKCM | 1 |
| p.A449V | SKCM | 1 |
| p.I471V | BLCA | 1 |
| p.R119K | SKCM | 1 |
| p.Q577* | SKCM | 1 |
| p.G758D | SKCM | 1 |
| p.R751W | LGG | 1 |
| p.D613H | LUAD | 1 |
| p.E671K | SKCM | 1 |
| p.E240K | SKCM | 1 |
| p.G477E | SKCM | 1 |
| p.D667E | SKCM | 1 |
| p.P661S | SKCM | 1 |
| p.E272D | COAD | 1 |
| p.T710R | SKCM | 1 |
| p.D470E | LUSC | 1 |
| p.R467H | STAD | 1 |
| p.G237V | SKCM | 1 |
| p.D338Y | CESC | 1 |
| p.G506S | HNSC | 1 |
| p.G677C | LUAD | 1 |
| p.Q376X | LIHC | 1 |
| p.V529M | GBM | 1 |
| p.A67V | STAD | 1 |
| p.G660V | LUAD | 1 |
| p.V777G | STAD | 1 |
| p.G589R | STAD | 1 |
| p.V268L | BRCA | 1 |
| p.Q251* | SKCM | 1 |
| p.R467H | SKCM | 1 |
| p.G640C | STAD | 1 |
| p.E364D | CESC | 1 |
| p.T440S | BLCA | 1 |
| p.L285I | UCEC | 1 |
| p.A6T | THCA | 1 |
| p.K666X | STAD | 1 |
| p.P317L | SKCM | 1 |
| p.E59K | SKCM | 1 |
| p.D177N | BLCA | 1 |
| p.E164K | SKCM | 1 |
| p.R267S | PRAD | 1 |
| p.R269Q | BLCA | 1 |
| p.F637L | UCEC | 1 |
| p.R668G | SKCM | 1 |
| p.R429C | SKCM | 1 |
| p.G49C | ESCA | 1 |
| p.S264F | SKCM | 1 |
| p.S332L | CESC | 1 |
| p.R632H | LIHC | 1 |
| p.R486H | PRAD | 1 |
| p.R82H | PRAD | 1 |
| p.S325F | SKCM | 1 |
| p.A278V | SARC | 1 |
| p.I636M | CESC | 1 |
| p.A453V | PAAD | 1 |
| p.G94S | COAD | 1 |
| p.P770L | SKCM | 1 |
| p.R579L | HNSC | 1 |
| p.T669M | THYM | 1 |
| p.R523C | HNSC | 1 |
| p.A691T | STAD | 1 |
| p.S24* | BLCA | 1 |
| p.Q16K | HNSC | 1 |
| p.P197S | KIRP | 1 |
| p.L432P | HNSC | 1 |
| p.E503K | SKCM | 1 |
| p.R429C | SARC | 1 |
| p.R523C | SKCM | 1 |
| p.G664S | GBM | 1 |
| p.F543L | SKCM | 1 |
| p.G49R | COAD | 1 |
| p.Y726H | KIRC | 1 |
| p.A386S | LUAD | 1 |
| p.S318F | SKCM | 1 |
| p.G237R | OV | 1 |
| p.A453V | STAD | 1 |
| p.S356F | LUAD | 1 |
| p.L760I | SKCM | 1 |
| p.N563S | BLCA | 1 |
| p.S696I | PAAD | 1 |
| p.A528V | SKCM | 1 |
| p.R403Q | STAD | 1 |
| p.E749K | SKCM | 1 |
| p.R694H | STAD | 1 |
| p.T111I | COAD | 1 |
| p.G640S | STAD | 1 |
| p.G567E | SKCM | 1 |
| p.Q251X | SKCM | 1 |
| p.G663R | HNSC | 1 |
| p.E452K | SKCM | 1 |
| p.N152S | PRAD | 1 |
| p.E635D | HNSC | 1 |
| p.W612* | LUSC | 1 |
| p.G550R | SKCM | 1 |
| p.A25G | OV | 1 |
| p.G49R | BRCA | 1 |
| p.P317S | SKCM | 1 |
| p.P392R | OV | 1 |
| p.P141S | SKCM | 1 |
| p.R345K | SKCM | 1 |
| p.P756S | SKCM | 1 |
| p.R709W | READ | 1 |
| Top |
| TissGeneCNV for KLHDC7A |
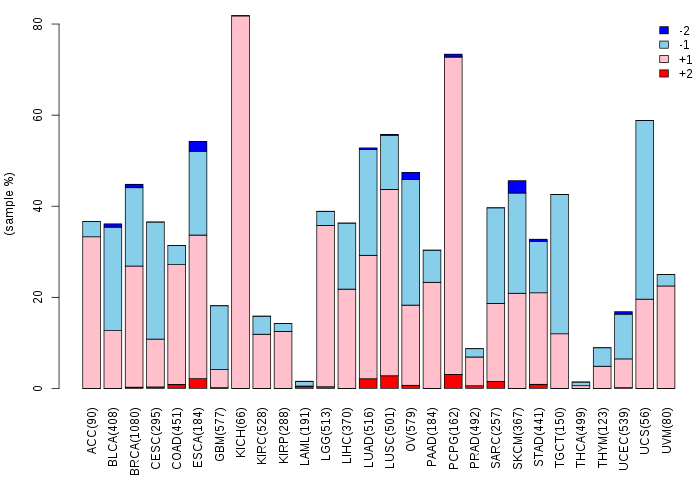
| Copy number variations of TissGene across 28 cancer types (X-axis: cancer type and Y-axis: % of CNV samples) (TCGA Gistic2_CopyNumber_Gistic2_all_data_by_genes, Gistic2 copy number data, version 2016-08-16) |
 |
| Top |
| TissGeneFusions for KLHDC7A |
| Fusion genes including TissGene (ChimerDB 3.0, 2016-12-01 and TCGA fusion Portal 2015-12-01) |
| Database | Src | Cancer type | Sample | Fusion gene | ORF | 5'-gene BP | 3'-gene BP |
| Top |
| TissGeneNet for KLHDC7A |
| Co-expressed gene networks based on protein-protein interaction data (CePIN) (TCGA IlluminaHiSeq_RNASeqV2, pan-cancer normalized log2(norm_counts+1) data, version 2016-08-16) (PINA2 ppi data) |
| Top |
| TissGeneProg for KLHDC7A |
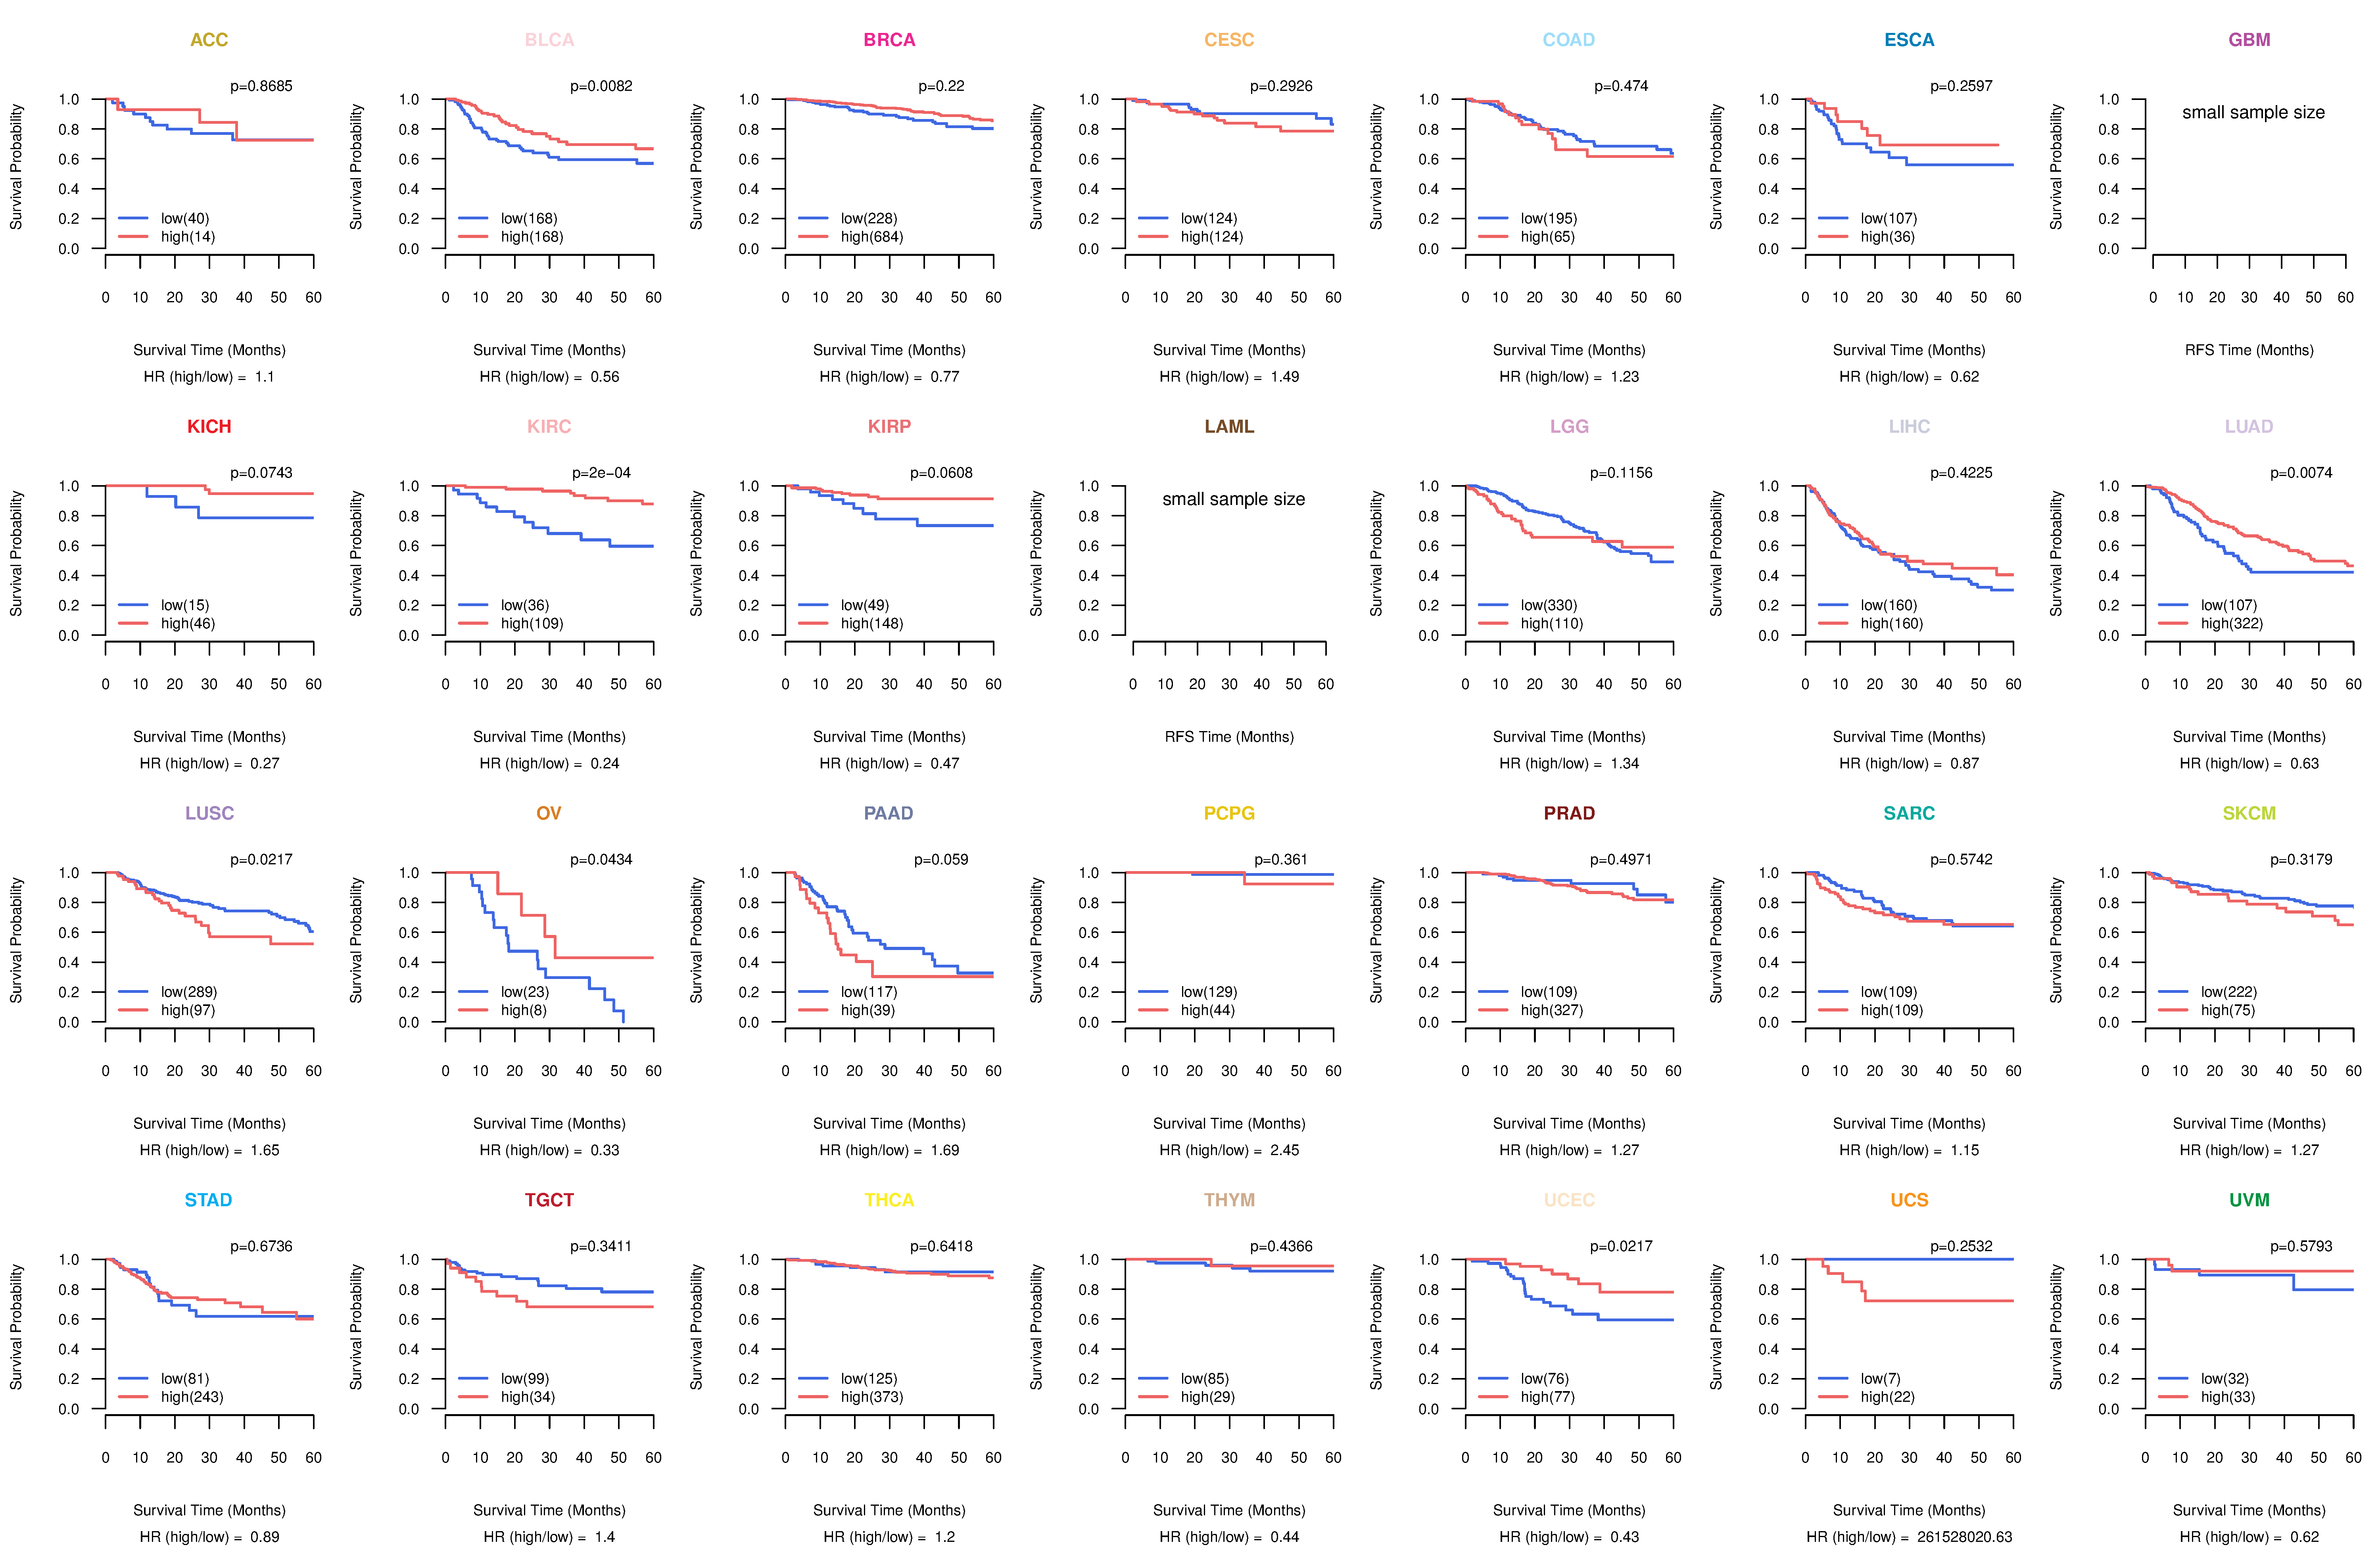
| Kaplan-Meier plots with logrank tests of overall survival (OS) using 28 cancer types (TCGA IlluminaHiSeq_RNASeqV2, pan-cancer normalized log2(norm_counts+1) data, version 2016-08-16) (TCGA clinicalMatrix, phenotype data, version 2016-04-27) * Click on the image to enlarge it in a new window. |
 |
| Kaplan-Meier plots with logrank test of relapse free survival (RFS) using 28 cancer types (TCGA IlluminaHiSeq_RNASeqV2, pan-cancer normalized log2(norm_counts+1) data, version 2016-08-16) (TCGA clinicalMatrix, phenotype data, version 2016-04-27) * Click on the image enlarge it in a new window. |
 |
| Forest plot of Cox proportional hazard ratio (HR) and 95% CI of overall survival (OS) using 28 cancer types (TCGA IlluminaHiSeq_RNASeqV2, pan-cancer normalized log2(norm_counts+1) data, version 2016-08-16) (TCGA clinicalMatrix, phenotype data, version 2016-04-27) * Click on the image enlarge it in a new window. |
 |
| Forest plot of Cox proportional hazard ratio (HR) and 95% CI of relapse free survival (RFS) using 28 cancer types (TCGA IlluminaHiSeq_RNASeqV2, pan-cancer normalized log2(norm_counts+1) data, version 2016-08-16) (TCGA clinicalMatrix, phenotype data, version 2016-04-27) * Click on the image enlarge it in a new window. |
 |
| Top |
| TissGeneClin for KLHDC7A |
| TissGeneDrug for KLHDC7A |
| Drug information targeting TissGene (DrugBank Version 5.0.6, 2017-04-01) |
| DrugBank ID | Drug name | Drug activity | Drug type | Drug status |
| Top |
| TissGeneDisease for KLHDC7A |
| Disease information associated with TissGene (DisGeNet, 2016-06-01) |
| Disease ID | Disease name | # pubmeds | Source |
| umls:C0040336 | Tobacco Use Disorder | 1 | GAD |
|
Copyright 2016-Present - The University of Texas Health Science Center at Houston (UTHealth) Web File Viewing | How to Report, Fraud, Waste and Abuse | State of Texas | Statewide Search | Texas Homeland Security | Site Policies |