 |
| |
| |
| |
| |
| |
| |
|

| TissGeneSummary for GOLT1A |
 Gene summary Gene summary |
| Basic gene information | Gene symbol | GOLT1A |
| Gene name | golgi transport 1A | |
| Synonyms | CGI-141|GOT1|HMFN1187|YMR292W | |
| Cytomap | UCSC genome browser: 1q32.1 | |
| Type of gene | protein-coding | |
| RefGenes | NM_198447.1, | |
| Description | hGOT1bputative protein product of HMFN1187vesicle transport protein GOT1A | |
| Modification date | 20141207 | |
| dbXrefs | HGNC : HGNC | |
| Ensembl : ENSG00000174567 | ||
| HPRD : 13465 | ||
| Vega : OTTHUMG00000036056 | ||
| Protein | UniProt: go to UniProt's Cross Reference DB Table | |
| Expression | CleanEX: HS_GOLT1A | |
| BioGPS: 127845 | ||
| Pathway | NCI Pathway Interaction Database: GOLT1A | |
| KEGG: GOLT1A | ||
| REACTOME: GOLT1A | ||
| Pathway Commons: GOLT1A | ||
| Context | iHOP: GOLT1A | |
| ligand binding site mutation search in PubMed: GOLT1A | ||
| UCL Cancer Institute: GOLT1A | ||
| Assigned class in TissGDB* | C | |
| Included tissue-specific gene expression resources | TiGER,GTEx | |
| Specific-tissues in normal samples (assigned by TissGDB using HPA, TiGER, and GTEx) | LiverPancreas | |
| Cancer types related to the specific-tissues in cancer samples (assigned by TissGDB using TCGA) | LIHCPAAD | |
| Reference showing the relevant tissue of GOLT1A | ||
| Description by TissGene annotations | ||
| * Class A consists of genes with literature evidence and is part of the cTissGenes. Class B consists of only cTissGenes without additional evidence. The remaining genes belong to Class C. |
| Gene ontology having evidence of Inferred from Direct Assay (IDA) from Entrez |
| GO ID | GO term | PubMed ID |
| Top |
| TissGeneExp for GOLT1A |
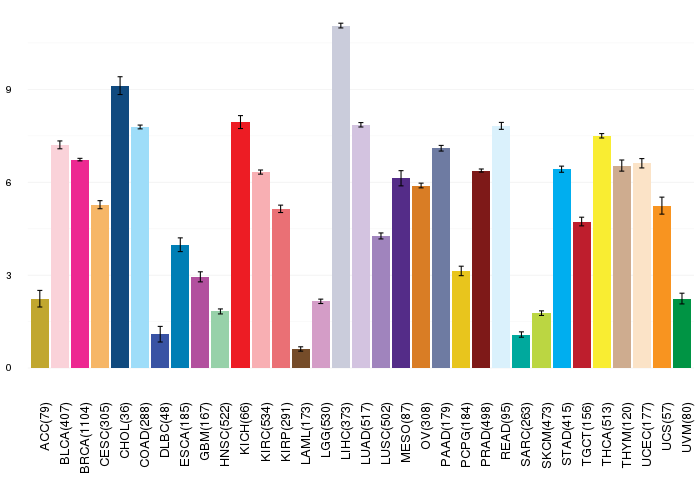
| Gene expressions across 28 cancer types (X-axis: cancer type and Y-axis: log2(norm_counts+1)) (TCGA IlluminaHiSeq_RNASeqV2, pan-cancer normalized log2(norm_counts+1) data, version 2016-08-16) |
 |
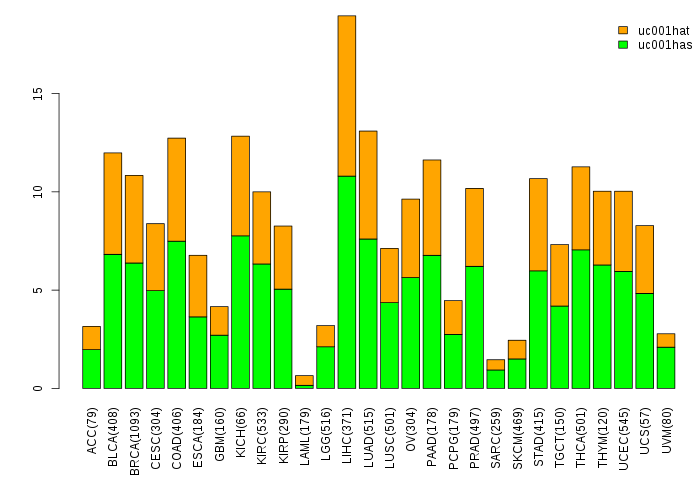
| Gene isoform expressions across 28 cancer types (X-axis: cancer type and Y-axis: log2(norm_counts+1)) (TCGA pan-cancer tcga_rsem_isoform_tpm, version 2016-09-01) |
 |
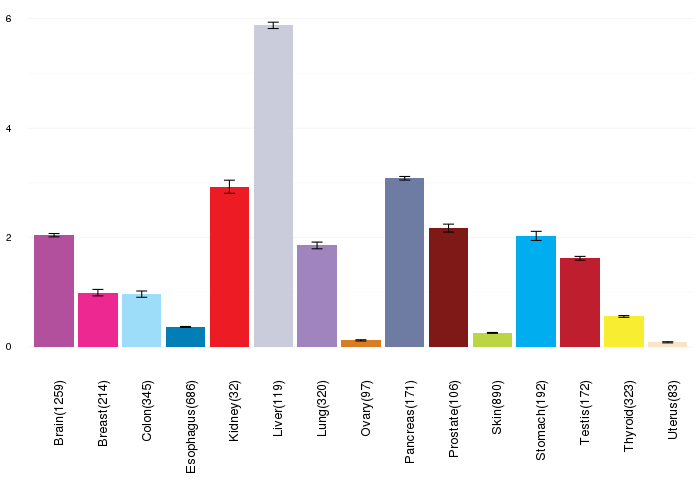
| Gene expressions across normal tissues of GTEx data (GTEx GTEx_Analysis_v6_RNA-seq_RNA-SeQCv1.1.8_gene_rpkm.gct) - Here, we shows the matched tissue types only among our 28 cancer types. |
 |
| Different expressions across 14 cancer types with more than 10 samples between matched tumors and normals (X-axis: cancer type and Y-axis: log2(norm_counts+1)) (TCGA IlluminaHiSeq_RNASeqV2, pan-cancer normalized log2(norm_counts+1) data, version 2016-08-16) |
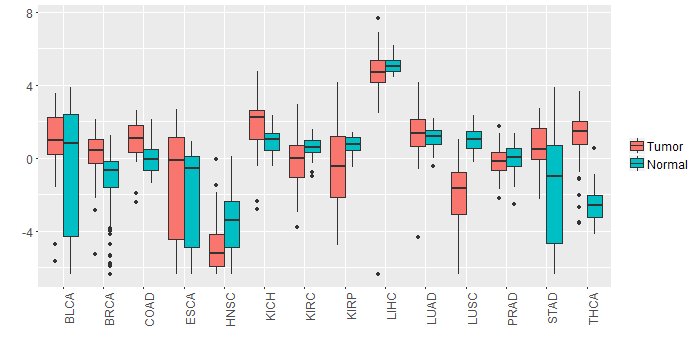 |
| - Significantly differentially expressed cancer types and information. (|Fold change|>1 and FDR<0.05) |
| Cancer type | Mean(exp) in tumor | Mean(exp) in matched normal | Log2FC | P-val. | FDR |
| BRCA | 0.292122788 | -1.274960545 | 1.567083333 | 1.69E-13 | 7.94E-13 |
| THCA | 1.130735768 | -2.616930334 | 3.747666102 | 3.24E-30 | 3.59E-27 |
| LUSC | -2.140308533 | 1.017662055 | -3.157970588 | 2.62E-15 | 1.70E-14 |
| KIRP | -0.421069317 | 0.694965058 | -1.116034375 | 0.00968 | 0.021360787 |
| STAD | 0.617883808 | -1.609203692 | 2.2270875 | 0.000889 | 0.004852818 |
| HNSC | -4.787250713 | -3.397964666 | -1.389286047 | 0.000303 | 0.001189791 |
| Top |
| TissGene-miRNA for GOLT1A |
| Significantly anti-correlated miRNAs of TissGene across 28 cancer types (Gene-miRNA relations from TargetScanHuman Relsease 7.1, Conserved_Site_Context_Scores.txt.zip, 06.01.2016) (TCGA IlluminaHiSeq_miRNASeq, log2(RPM+1) data, version 2016-11-21) (TCGA IlluminaHiSeq_RNASeqV2, log2(normalized_count+1) data, version 2016-08-16) (Spearman’s Rank Correlation (p-value<0.05 and coefficient<-0.25)) |
| Cancer type | miRNA id | miRNA accession | P-val. | Coeff. | # samples |
| Top |
| TissGeneMut for GOLT1A |
| TissGeneSNV for GOLT1A |
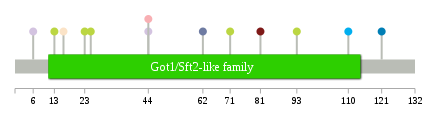
| nsSNV counts per each loci. Different colors of circles represent different cancer types. Circle size denotes number of samples. (TCGA somatic mutation (SNPs and small INDELs) data, version 2016-04-25) * Click on the image to enlarge it in a new window. |
 |
 |
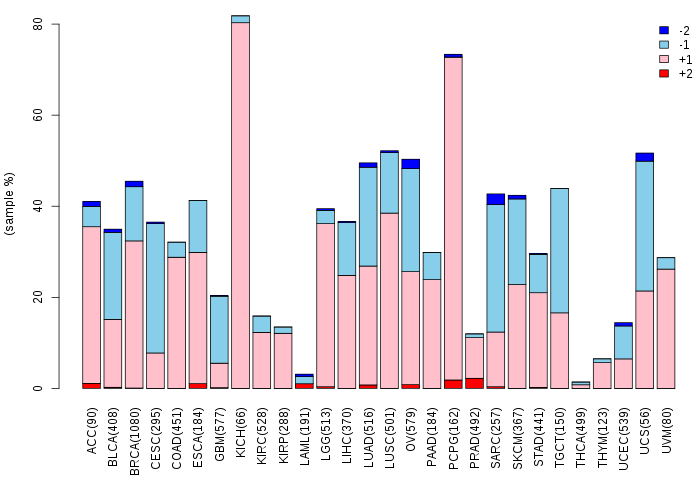
| Somatic nucleotide variants of TissGene across 28 cancer types (X-axis: cancer type and Y-axis: % of mutated samples) The numbers in parentheses are numbers of samples with mutation (nsSNVs). (TCGA somatic mutation (SNPs and small INDELs) data, version 2016-04-25) |
 |
| - nsSNVs sorted by frequency. |
| AAchange | Cancer type | # samples |
| p.R62W | PAAD | 1 |
| p.T44M | KIRC | 1 |
| p.T44M | LUAD | 1 |
| p.L23F | SKCM | 1 |
| p.G93E | SKCM | 1 |
| p.G13R | SKCM | 1 |
| p.E6Q | LUAD | 1 |
| p.G110C | STAD | 1 |
| p.R81C | PRAD | 1 |
| p.G25E | SKCM | 1 |
| p.G16S | UCEC | 1 |
| p.L121M | ESCA | 1 |
| p.F95S | READ | 1 |
| p.L71F | SKCM | 1 |
| Top |
| TissGeneCNV for GOLT1A |
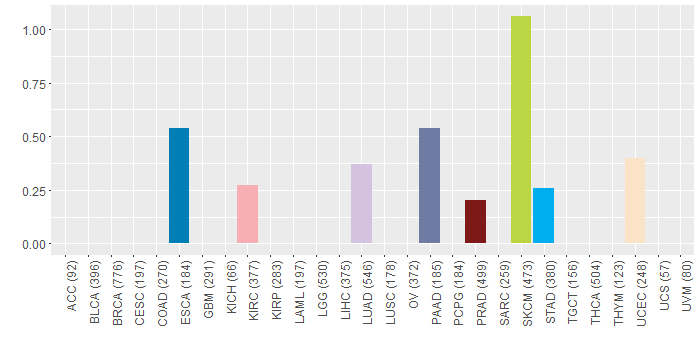
| Copy number variations of TissGene across 28 cancer types (X-axis: cancer type and Y-axis: % of CNV samples) (TCGA Gistic2_CopyNumber_Gistic2_all_data_by_genes, Gistic2 copy number data, version 2016-08-16) |
 |
| Top |
| TissGeneFusions for GOLT1A |
| Fusion genes including TissGene (ChimerDB 3.0, 2016-12-01 and TCGA fusion Portal 2015-12-01) |
| Database | Src | Cancer type | Sample | Fusion gene | ORF | 5'-gene BP | 3'-gene BP |
| Chimerdb3.0 | ChiTaRs | NA | AI983092 | GOLT1A-IL10RB | chr1:204174936 | chr21:34668487 |
| Top |
| TissGeneNet for GOLT1A |
| Co-expressed gene networks based on protein-protein interaction data (CePIN) (TCGA IlluminaHiSeq_RNASeqV2, pan-cancer normalized log2(norm_counts+1) data, version 2016-08-16) (PINA2 ppi data) |
| Top |
| TissGeneProg for GOLT1A |
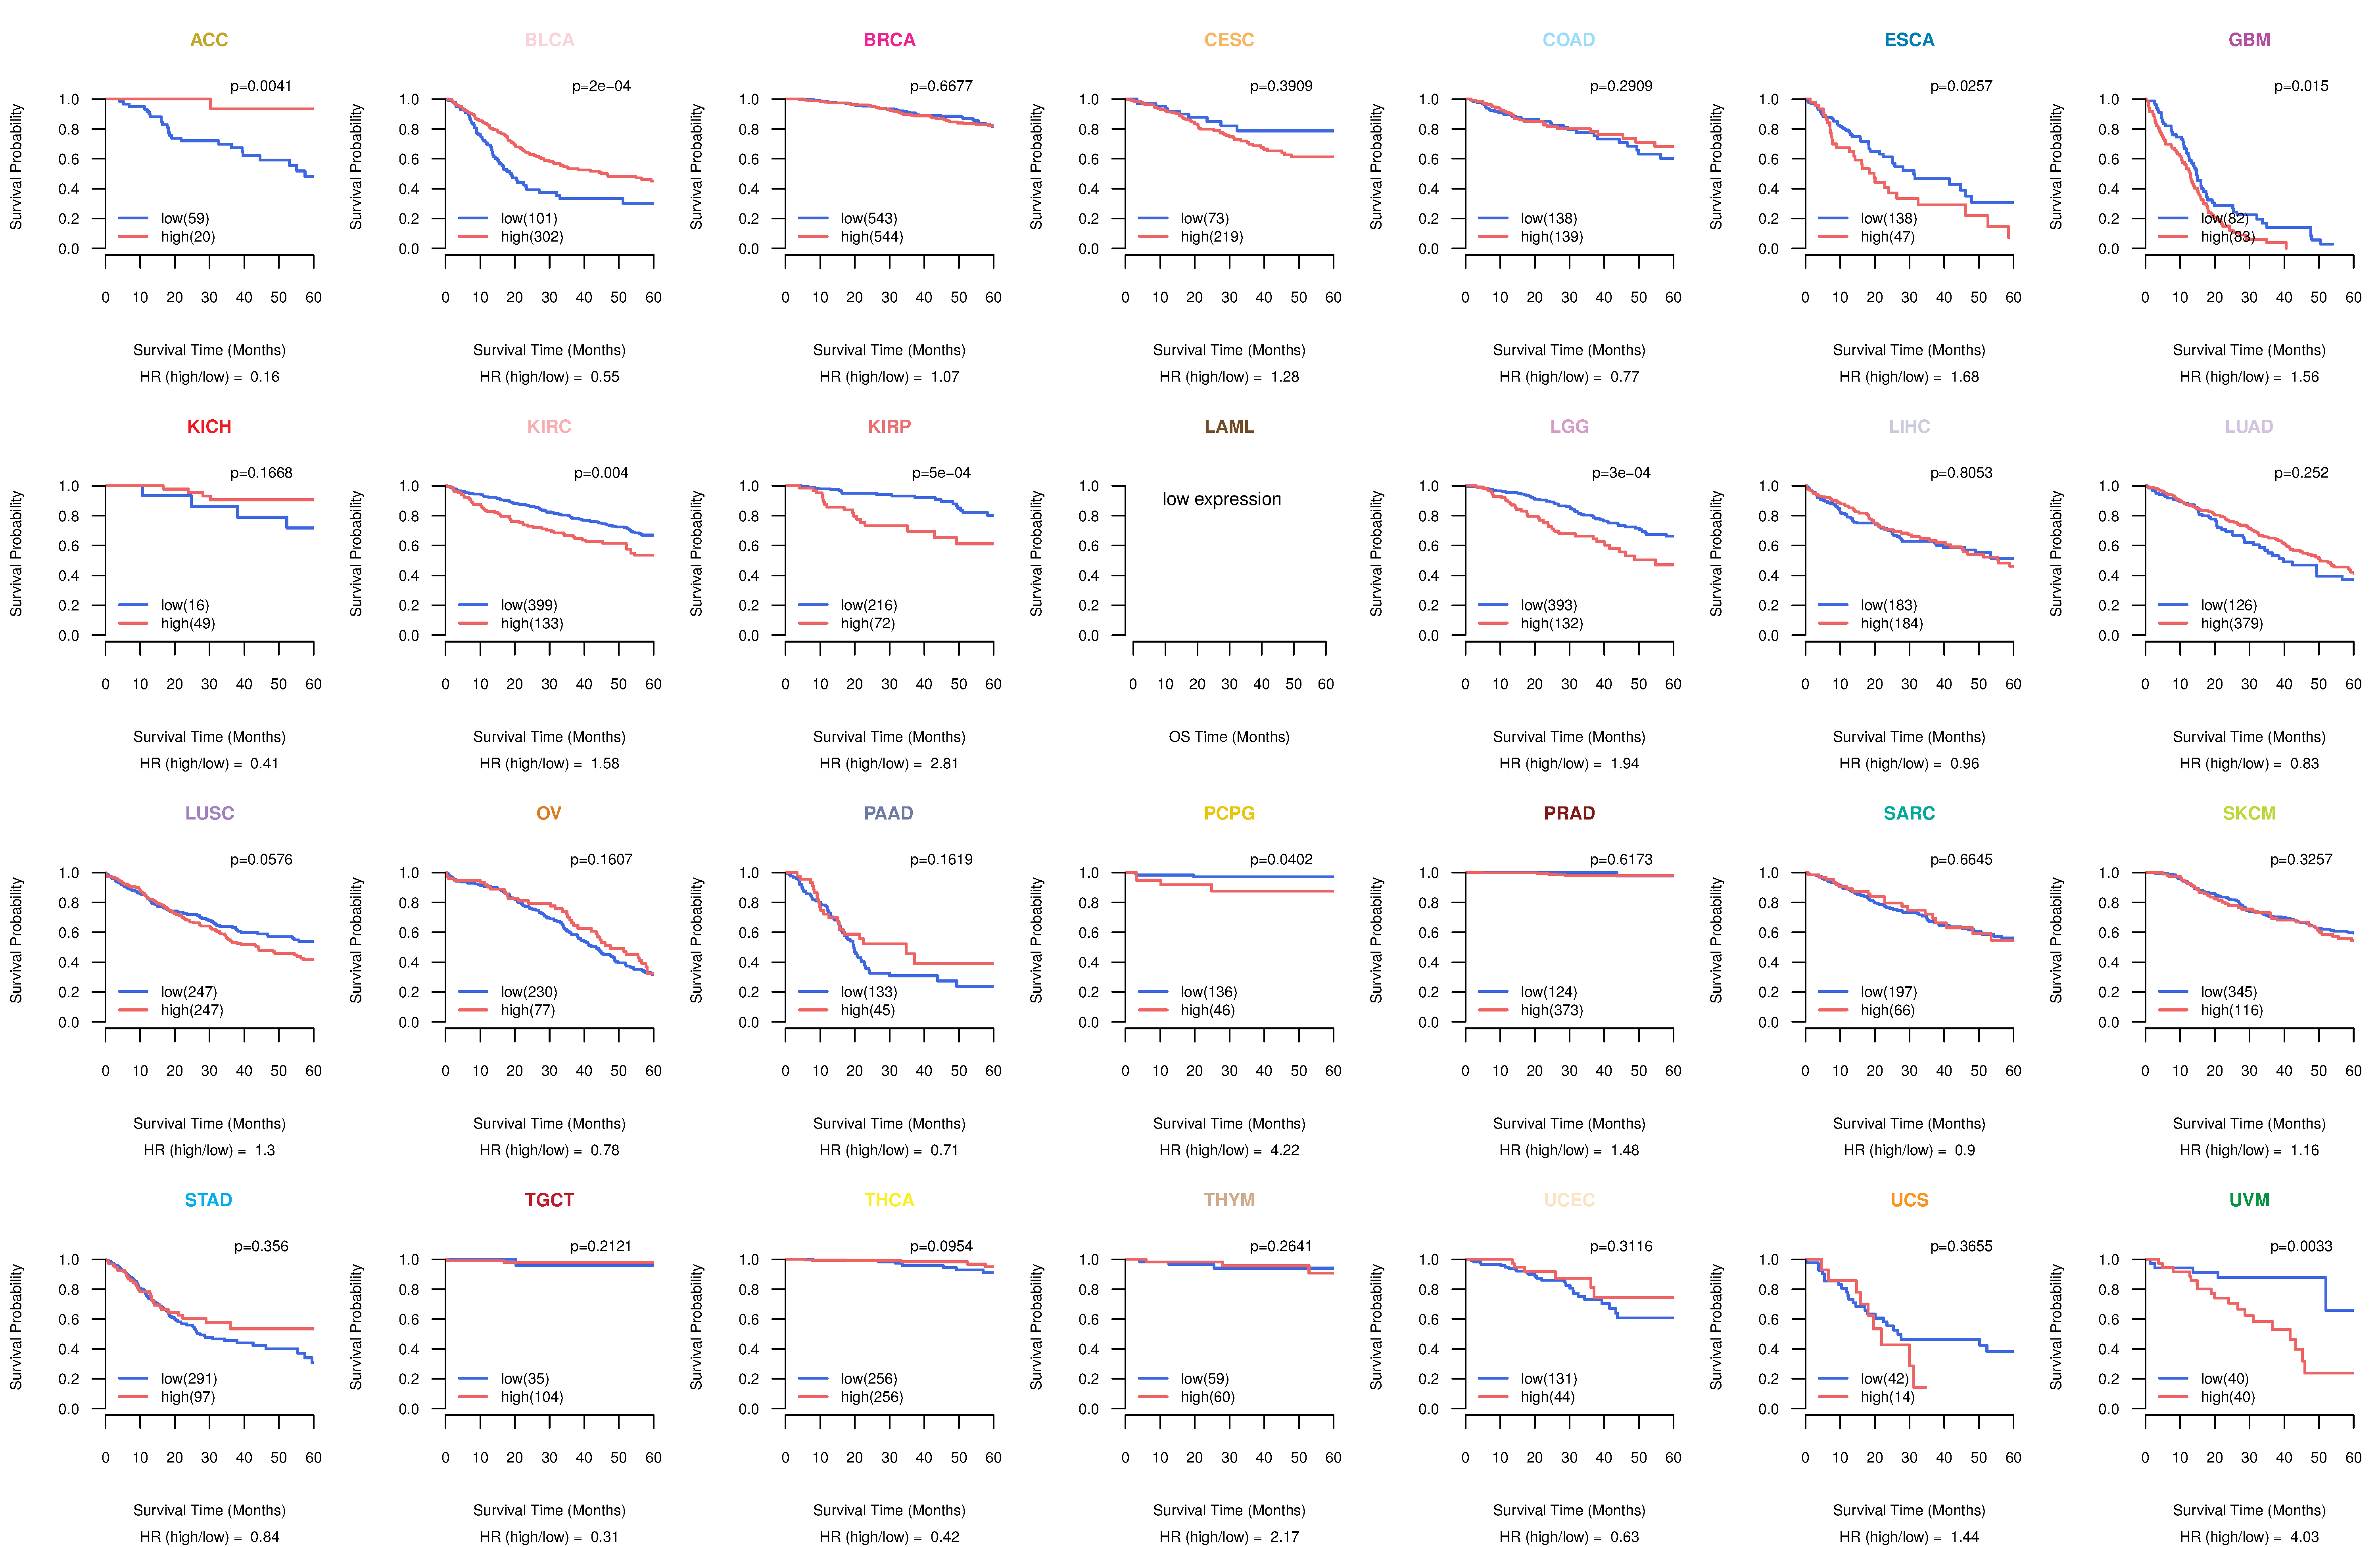
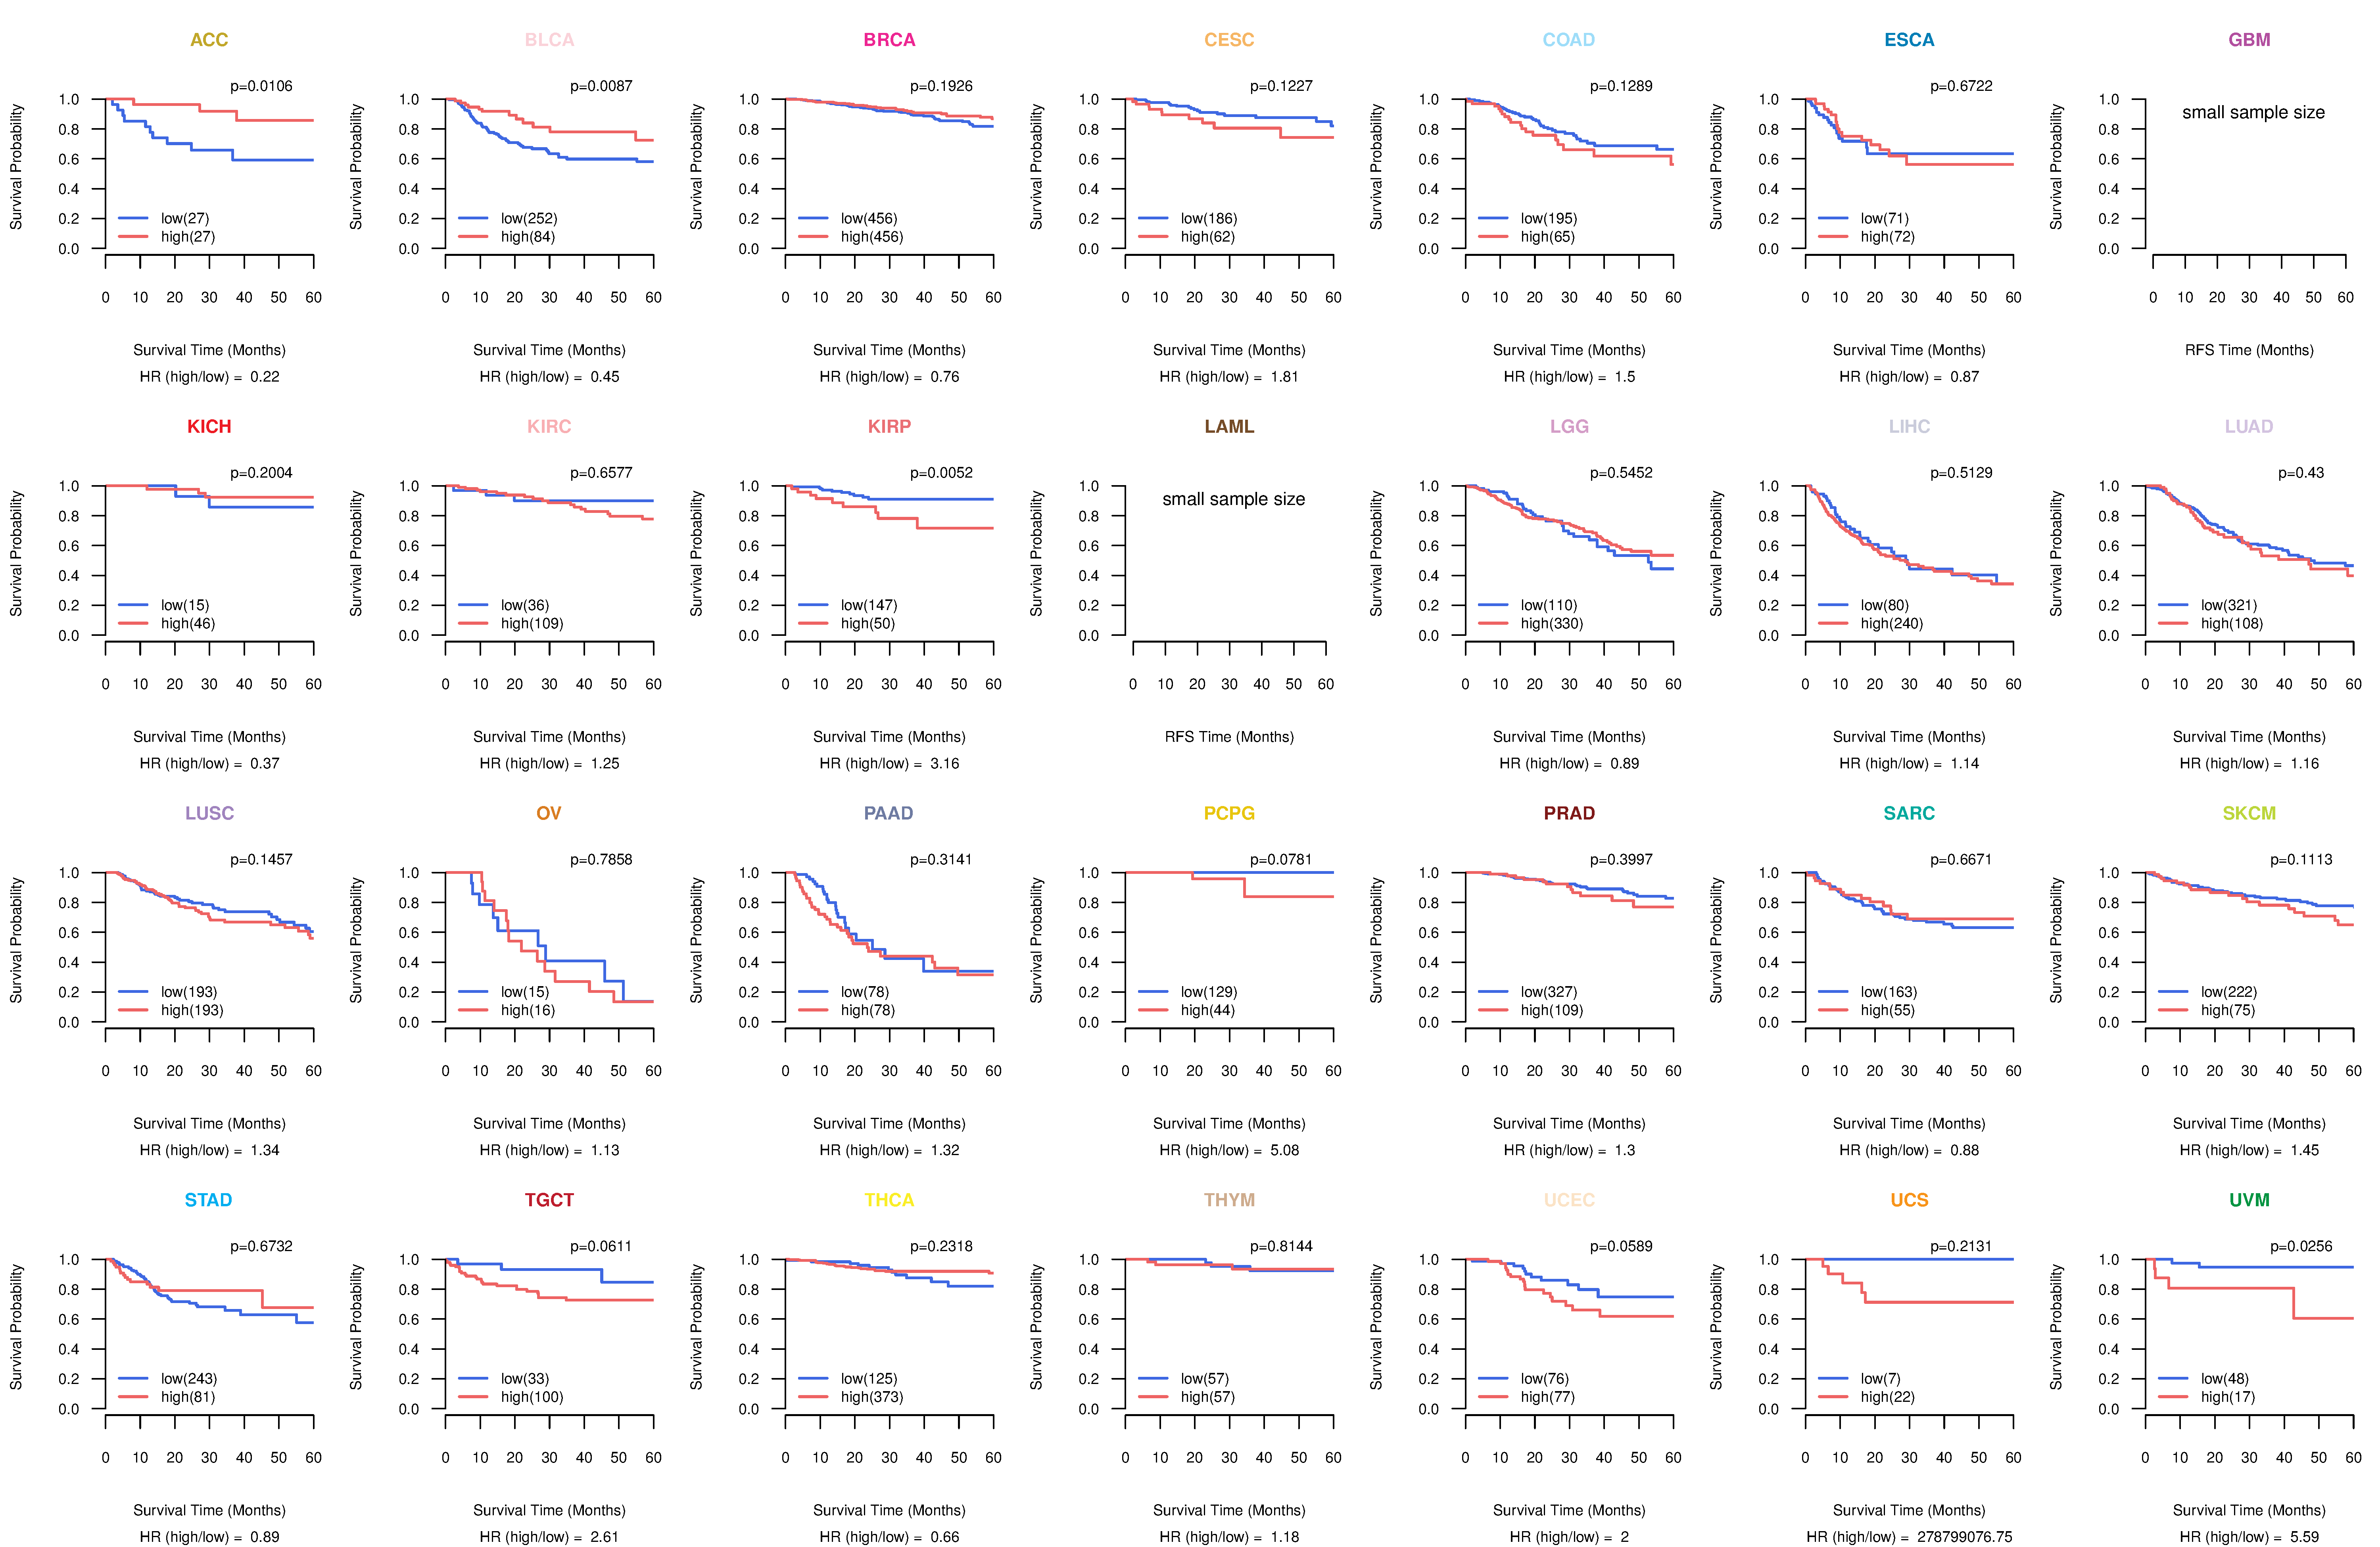
| Kaplan-Meier plots with logrank tests of overall survival (OS) using 28 cancer types (TCGA IlluminaHiSeq_RNASeqV2, pan-cancer normalized log2(norm_counts+1) data, version 2016-08-16) (TCGA clinicalMatrix, phenotype data, version 2016-04-27) * Click on the image to enlarge it in a new window. |
 |
| Kaplan-Meier plots with logrank test of relapse free survival (RFS) using 28 cancer types (TCGA IlluminaHiSeq_RNASeqV2, pan-cancer normalized log2(norm_counts+1) data, version 2016-08-16) (TCGA clinicalMatrix, phenotype data, version 2016-04-27) * Click on the image enlarge it in a new window. |
 |
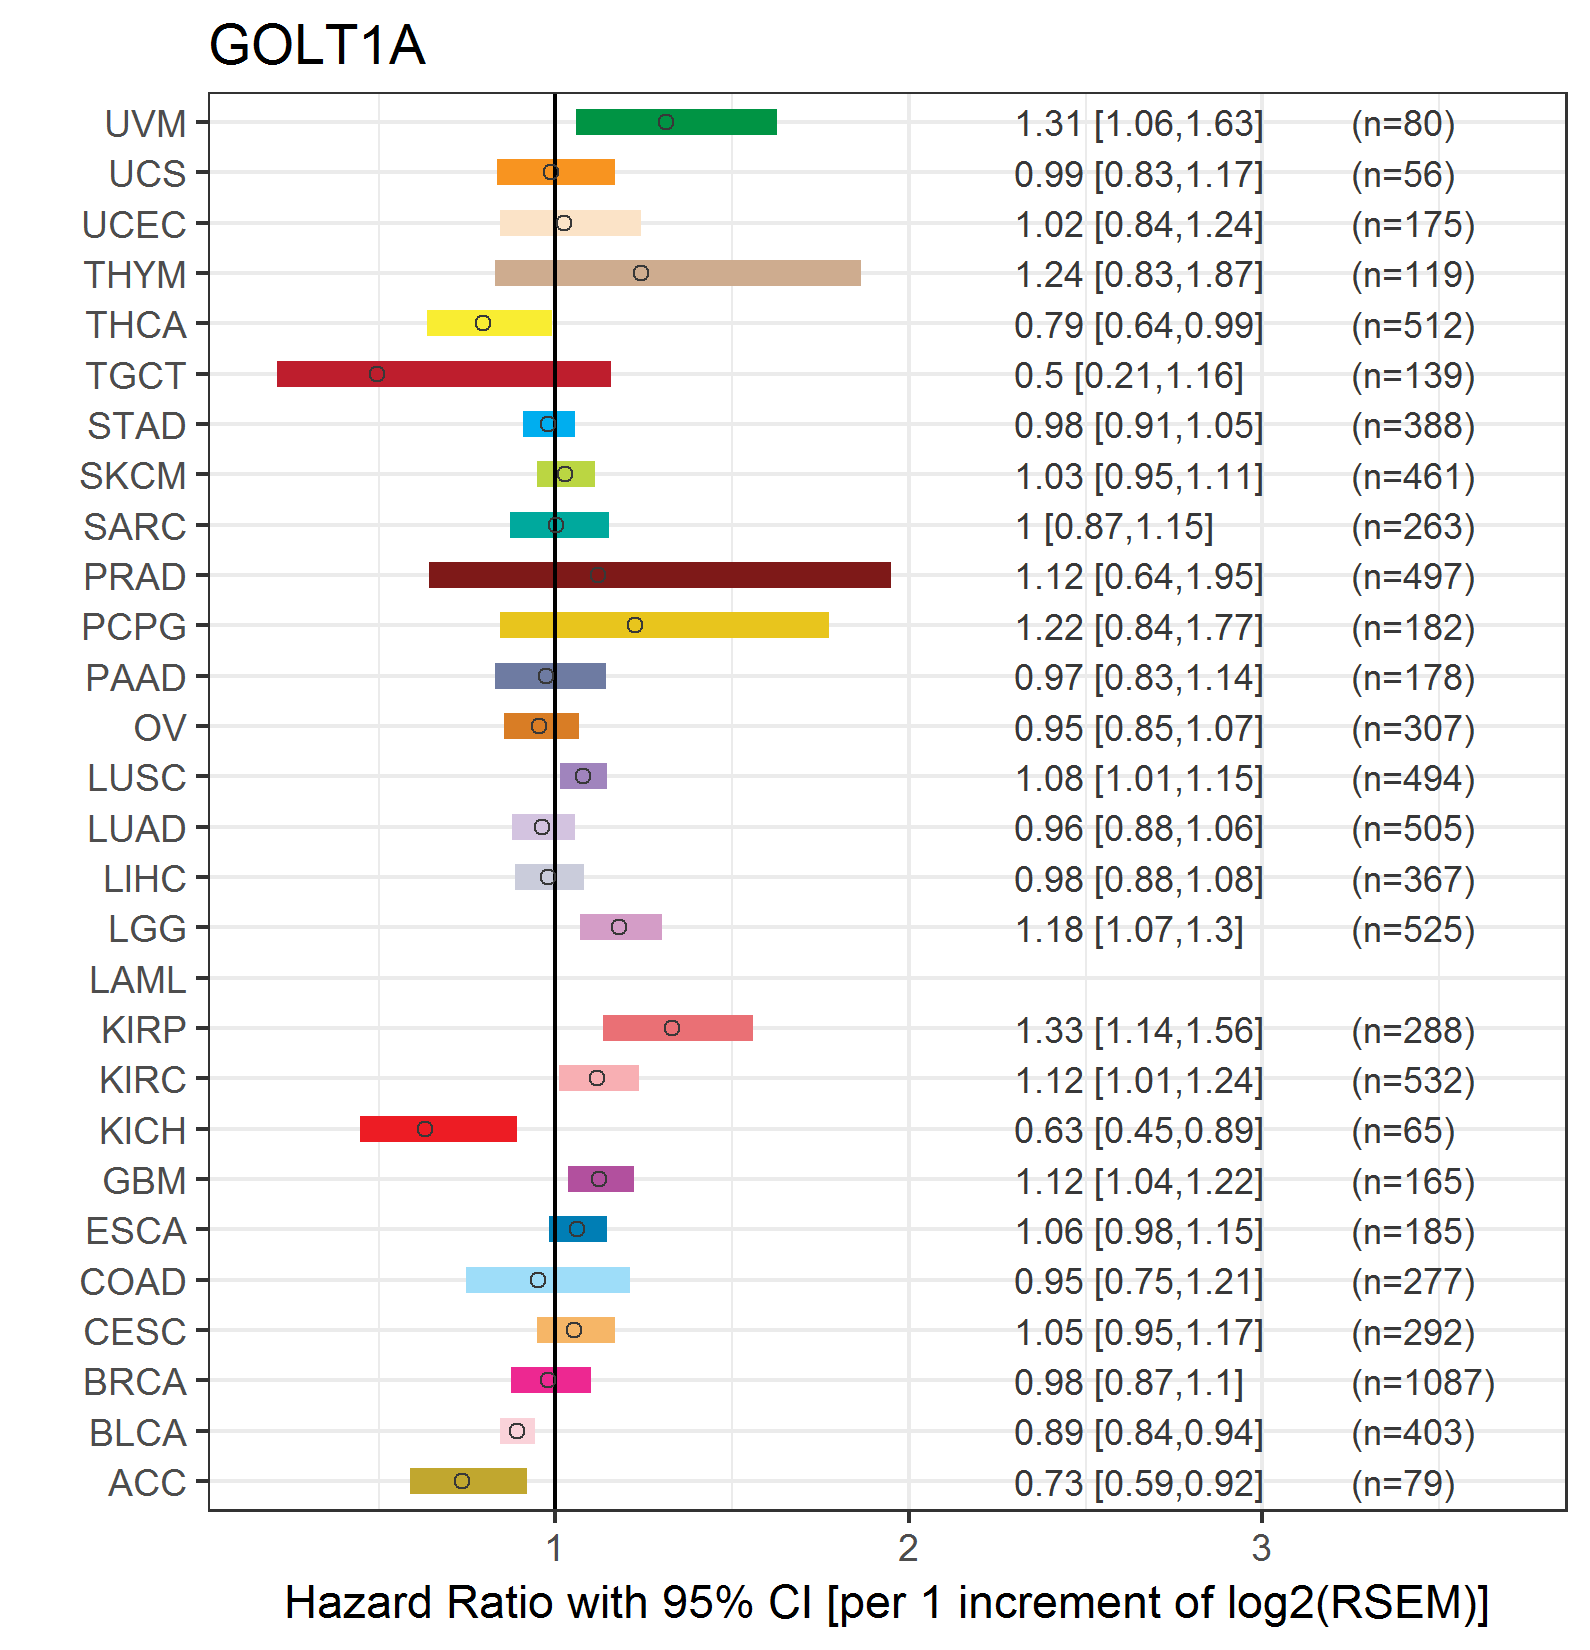
| Forest plot of Cox proportional hazard ratio (HR) and 95% CI of overall survival (OS) using 28 cancer types (TCGA IlluminaHiSeq_RNASeqV2, pan-cancer normalized log2(norm_counts+1) data, version 2016-08-16) (TCGA clinicalMatrix, phenotype data, version 2016-04-27) * Click on the image enlarge it in a new window. |
 |
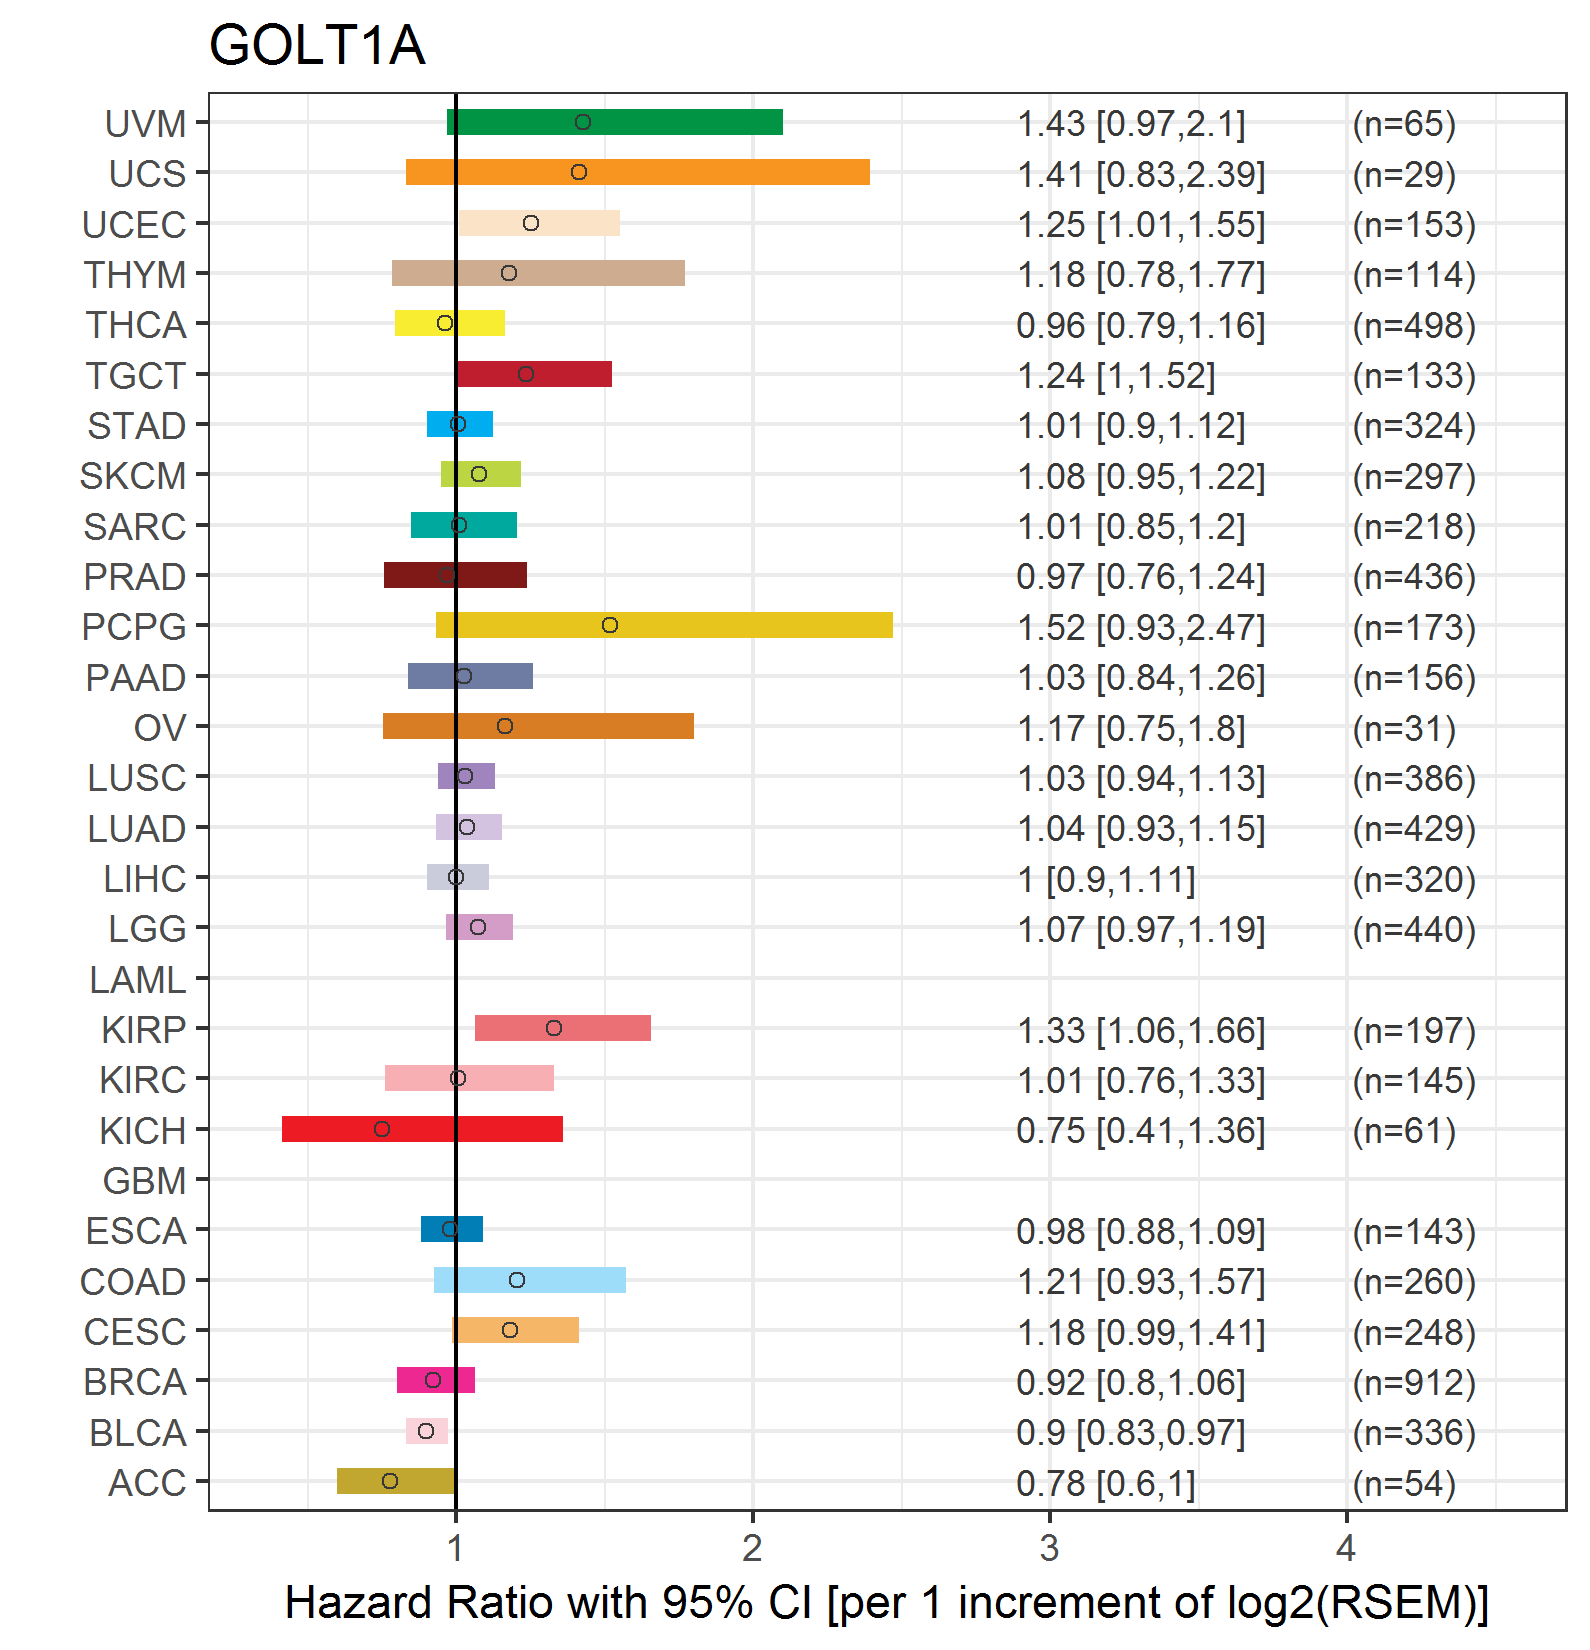
| Forest plot of Cox proportional hazard ratio (HR) and 95% CI of relapse free survival (RFS) using 28 cancer types (TCGA IlluminaHiSeq_RNASeqV2, pan-cancer normalized log2(norm_counts+1) data, version 2016-08-16) (TCGA clinicalMatrix, phenotype data, version 2016-04-27) * Click on the image enlarge it in a new window. |
 |
| Top |
| TissGeneClin for GOLT1A |
| TissGeneDrug for GOLT1A |
| Drug information targeting TissGene (DrugBank Version 5.0.6, 2017-04-01) |
| DrugBank ID | Drug name | Drug activity | Drug type | Drug status |
| Top |
| TissGeneDisease for GOLT1A |
| Disease information associated with TissGene (DisGeNet, 2016-06-01) |
| Disease ID | Disease name | # pubmeds | Source |
| umls:C0033027 | Preleukemia | 2 | BeFree |
| umls:C0403555 | Ochoa syndrome | 2 | BeFree |
| umls:C3463824 | MYELODYSPLASTIC SYNDROME | 2 | BeFree |
| umls:C0007095 | Carcinoid Tumor | 1 | BeFree |
| umls:C0007785 | Cerebral Infarction | 1 | BeFree |
| umls:C0019880 | Homocystinuria | 1 | BeFree |
| umls:C0020538 | Hypertensive disease | 1 | GAD |
| umls:C0334299 | Carcinoid tumor no ICD-O subtype | 1 | BeFree |
| umls:C0917798 | Cerebral Ischemia | 1 | BeFree |
|
Copyright 2016-Present - The University of Texas Health Science Center at Houston (UTHealth) Web File Viewing | How to Report, Fraud, Waste and Abuse | State of Texas | Statewide Search | Texas Homeland Security | Site Policies |