 |
| |
| |
| |
| |
| |
| |
|

| TissGeneSummary for IQGAP3 |
 Gene summary Gene summary |
| Basic gene information | Gene symbol | IQGAP3 |
| Gene name | IQ motif containing GTPase activating protein 3 | |
| Synonyms | - | |
| Cytomap | UCSC genome browser: 1q21.3 | |
| Type of gene | protein-coding | |
| RefGenes | NM_178229.4, | |
| Description | ras GTPase-activating-like protein IQGAP3 | |
| Modification date | 20141207 | |
| dbXrefs | HGNC : HGNC | |
| Ensembl : ENSG00000183856 | ||
| HPRD : 11051 | ||
| Vega : OTTHUMG00000033114 | ||
| Protein | UniProt: go to UniProt's Cross Reference DB Table | |
| Expression | CleanEX: HS_IQGAP3 | |
| BioGPS: 128239 | ||
| Pathway | NCI Pathway Interaction Database: IQGAP3 | |
| KEGG: IQGAP3 | ||
| REACTOME: IQGAP3 | ||
| Pathway Commons: IQGAP3 | ||
| Context | iHOP: IQGAP3 | |
| ligand binding site mutation search in PubMed: IQGAP3 | ||
| UCL Cancer Institute: IQGAP3 | ||
| Assigned class in TissGDB* | C | |
| Included tissue-specific gene expression resources | TiGER,GTEx | |
| Specific-tissues in normal samples (assigned by TissGDB using HPA, TiGER, and GTEx) | Bone marrowOvaryTestis | |
| Cancer types related to the specific-tissues in cancer samples (assigned by TissGDB using TCGA) | LAMLOVTGCT | |
| Reference showing the relevant tissue of IQGAP3 | ||
| Description by TissGene annotations | ||
| * Class A consists of genes with literature evidence and is part of the cTissGenes. Class B consists of only cTissGenes without additional evidence. The remaining genes belong to Class C. |
| Gene ontology having evidence of Inferred from Direct Assay (IDA) from Entrez |
| GO ID | GO term | PubMed ID |
| Top |
| TissGeneExp for IQGAP3 |
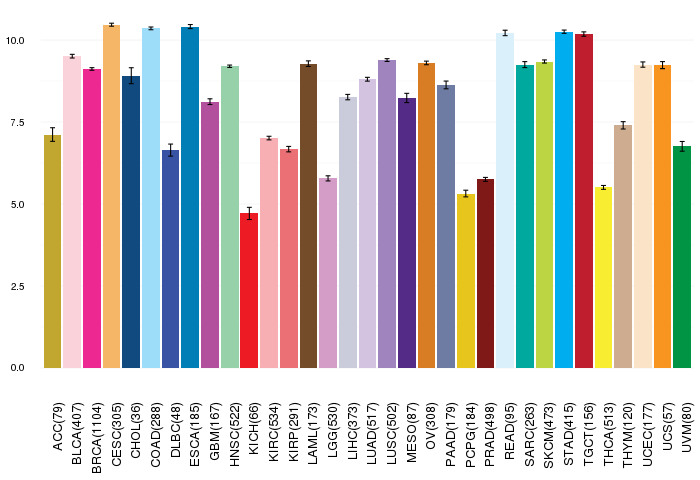
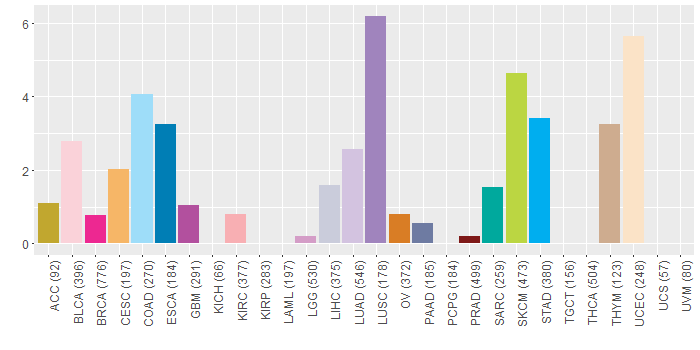
| Gene expressions across 28 cancer types (X-axis: cancer type and Y-axis: log2(norm_counts+1)) (TCGA IlluminaHiSeq_RNASeqV2, pan-cancer normalized log2(norm_counts+1) data, version 2016-08-16) |
 |
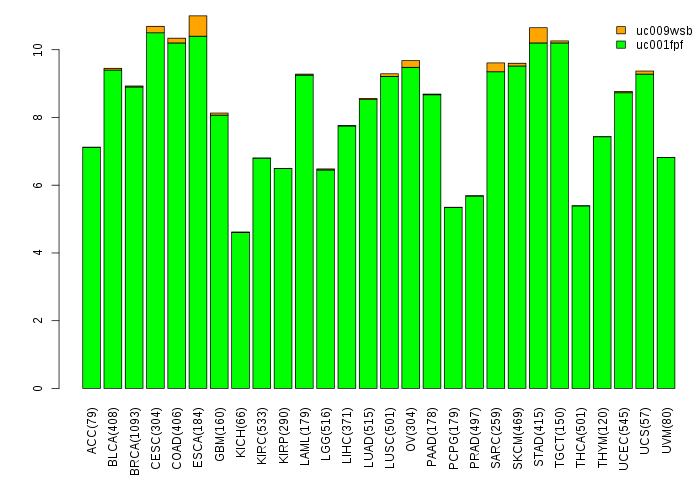
| Gene isoform expressions across 28 cancer types (X-axis: cancer type and Y-axis: log2(norm_counts+1)) (TCGA pan-cancer tcga_rsem_isoform_tpm, version 2016-09-01) |
 |
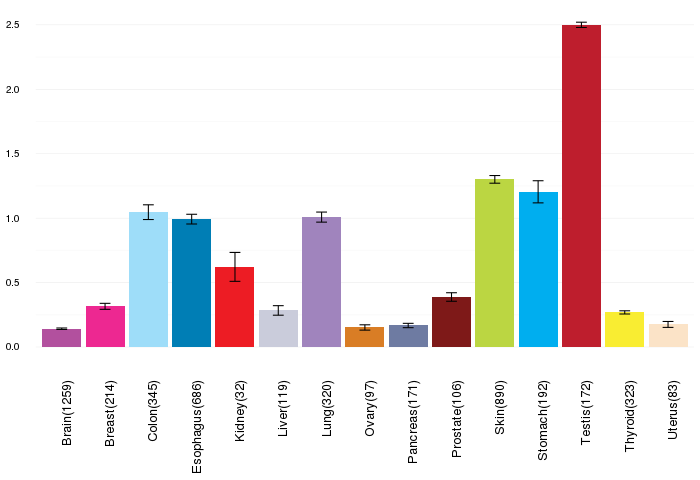
| Gene expressions across normal tissues of GTEx data (GTEx GTEx_Analysis_v6_RNA-seq_RNA-SeQCv1.1.8_gene_rpkm.gct) - Here, we shows the matched tissue types only among our 28 cancer types. |
 |
| Different expressions across 14 cancer types with more than 10 samples between matched tumors and normals (X-axis: cancer type and Y-axis: log2(norm_counts+1)) (TCGA IlluminaHiSeq_RNASeqV2, pan-cancer normalized log2(norm_counts+1) data, version 2016-08-16) |
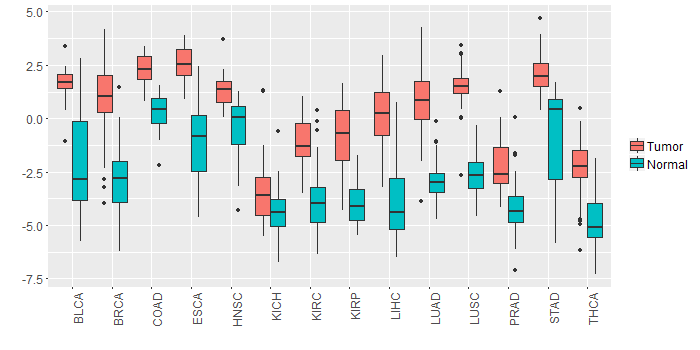 |
| - Significantly differentially expressed cancer types and information. (|Fold change|>1 and FDR<0.05) |
| Cancer type | Mean(exp) in tumor | Mean(exp) in matched normal | Log2FC | P-val. | FDR |
| THCA | -2.293276383 | -4.754976383 | 2.4617 | 3.73E-18 | 9.07E-17 |
| PRAD | -2.276615595 | -4.179119441 | 1.902503846 | 1.66E-12 | 8.14E-11 |
| LIHC | 0.090428329 | -3.974449671 | 4.064878 | 7.78E-22 | 6.17E-20 |
| LUSC | 1.477484368 | -2.612341122 | 4.08982549 | 1.85E-37 | 5.21E-35 |
| LUAD | 0.775498397 | -2.920861947 | 3.696360345 | 2.25E-30 | 2.97E-28 |
| BRCA | 1.013208258 | -2.855768057 | 3.868976316 | 2.25E-53 | 2.82E-51 |
| STAD | 2.131295704 | -0.834126171 | 2.965421875 | 9.98E-08 | 2.67E-06 |
| COAD | 2.321282482 | 0.329482482 | 1.9918 | 1.13E-11 | 2.17E-10 |
| KIRP | -0.835248046 | -3.979419921 | 3.144171875 | 1.21E-12 | 1.92E-11 |
| HNSC | 1.321260747 | -0.448511346 | 1.769772093 | 1.23E-09 | 1.90E-08 |
| BLCA | 1.583496855 | -2.32516104 | 3.908657895 | 3.34E-07 | 1.40E-05 |
| KIRC | -1.118019227 | -3.901574783 | 2.783555556 | 9.54E-27 | 1.34E-25 |
| KICH | -3.272485671 | -4.325913671 | 1.053428 | 0.0194 | 0.032865181 |
| ESCA | 2.595859056 | -0.980913671 | 3.576772727 | 0.000109 | 0.00341431 |
| Top |
| TissGene-miRNA for IQGAP3 |
| Significantly anti-correlated miRNAs of TissGene across 28 cancer types (Gene-miRNA relations from TargetScanHuman Relsease 7.1, Conserved_Site_Context_Scores.txt.zip, 06.01.2016) (TCGA IlluminaHiSeq_miRNASeq, log2(RPM+1) data, version 2016-11-21) (TCGA IlluminaHiSeq_RNASeqV2, log2(normalized_count+1) data, version 2016-08-16) (Spearman’s Rank Correlation (p-value<0.05 and coefficient<-0.25)) |
| Cancer type | miRNA id | miRNA accession | P-val. | Coeff. | # samples |
| Top |
| TissGeneMut for IQGAP3 |
| TissGeneSNV for IQGAP3 |
| nsSNV counts per each loci. Different colors of circles represent different cancer types. Circle size denotes number of samples. (TCGA somatic mutation (SNPs and small INDELs) data, version 2016-04-25) * Click on the image to enlarge it in a new window. |
 |
 |
| Somatic nucleotide variants of TissGene across 28 cancer types (X-axis: cancer type and Y-axis: % of mutated samples) The numbers in parentheses are numbers of samples with mutation (nsSNVs). (TCGA somatic mutation (SNPs and small INDELs) data, version 2016-04-25) |
 |
| - nsSNVs sorted by frequency. |
| AAchange | Cancer type | # samples |
| p.P644S | SKCM | 2 |
| p.L1119I | UCEC | 1 |
| p.E1354K | LUAD | 1 |
| p.L1130V | OV | 1 |
| p.W804* | LUSC | 1 |
| p.Q1492H | BRCA | 1 |
| p.C402R | SKCM | 1 |
| p.A1556T | PRAD | 1 |
| p.R492* | PRAD | 1 |
| p.R747Q | UCEC | 1 |
| p.S1364N | BRCA | 1 |
| p.H1243N | THYM | 1 |
| p.R457W | LUAD | 1 |
| p.L1123F | LUSC | 1 |
| p.D1595Y | LIHC | 1 |
| p.G433D | COAD | 1 |
| p.D1522G | LIHC | 1 |
| p.R1630P | OV | 1 |
| p.A636T | STAD | 1 |
| p.R855C | READ | 1 |
| p.L632* | HNSC | 1 |
| p.Q1008* | HNSC | 1 |
| p.R1120C | STAD | 1 |
| p.R1438Q | PAAD | 1 |
| p.R1442Q | STAD | 1 |
| p.A1221T | SKCM | 1 |
| p.R137Q | COAD | 1 |
| p.R92Q | STAD | 1 |
| p.G1505D | BLCA | 1 |
| p.D602G | UCEC | 1 |
| p.S1394F | BLCA | 1 |
| p.R909W | STAD | 1 |
| p.Q272L | BRCA | 1 |
| p.G581E | HNSC | 1 |
| p.R1438W | UCEC | 1 |
| p.R452L | LUSC | 1 |
| p.Q419R | LUAD | 1 |
| p.F1010L | LUSC | 1 |
| p.V80A | HNSC | 1 |
| p.L959F | SKCM | 1 |
| p.A577S | LUSC | 1 |
| p.D1237G | UCEC | 1 |
| p.S445L | ESCA | 1 |
| p.D1517N | KIRC | 1 |
| p.P77S | SKCM | 1 |
| p.S1343Y | UCEC | 1 |
| p.Q281K | LUSC | 1 |
| p.I1376M | GBM | 1 |
| p.E38D | UCEC | 1 |
| p.R1363S | ESCA | 1 |
| p.R15H | STAD | 1 |
| p.K1580N | LUSC | 1 |
| p.L1123F | SKCM | 1 |
| p.R324Q | SKCM | 1 |
| p.R1000H | ESCA | 1 |
| p.Y182H | LUAD | 1 |
| p.S1424L | BRCA | 1 |
| p.I968M | ESCA | 1 |
| p.S1269* | BLCA | 1 |
| p.G649S | PAAD | 1 |
| p.E1110V | LUAD | 1 |
| p.R1513W | STAD | 1 |
| p.R802W | STAD | 1 |
| p.R1588Q | UCEC | 1 |
| p.Q185* | SKCM | 1 |
| p.Q281E | HNSC | 1 |
| p.S703C | HNSC | 1 |
| p.Q157* | CESC | 1 |
| p.P1033Q | COAD | 1 |
| p.W588R | SKCM | 1 |
| p.Q1598L | LIHC | 1 |
| p.H266R | COAD | 1 |
| p.E1351K | BLCA | 1 |
| p.V642L | SKCM | 1 |
| p.T1126I | SARC | 1 |
| p.R1233W | UCEC | 1 |
| p.Y774C | LUSC | 1 |
| p.D1314Y | LUAD | 1 |
| p.V293I | STAD | 1 |
| p.L1624F | SKCM | 1 |
| p.E1295* | OV | 1 |
| p.A481V | LUAD | 1 |
| p.G1048R | SKCM | 1 |
| p.E1087Q | CESC | 1 |
| p.R841M | UCEC | 1 |
| p.V293D | THYM | 1 |
| p.V352M | BRCA | 1 |
| p.R1480L | LUAD | 1 |
| p.L1324I | UCEC | 1 |
| p.K1481T | SKCM | 1 |
| p.Q1598K | STAD | 1 |
| p.D329N | UCEC | 1 |
| p.E178K | STAD | 1 |
| p.P560S | BLCA | 1 |
| p.W43* | LUAD | 1 |
| p.H1592Y | BLCA | 1 |
| p.R608I | STAD | 1 |
| p.H1243R | COAD | 1 |
| p.A836V | COAD | 1 |
| p.F688L | BLCA | 1 |
| p.D937E | KIRC | 1 |
| p.A1189T | UCEC | 1 |
| p.P1097Q | BLCA | 1 |
| p.P967L | SKCM | 1 |
| p.R855C | SARC | 1 |
| p.E948K | SKCM | 1 |
| p.N134K | UCEC | 1 |
| p.Y1537F | LUAD | 1 |
| p.R813C | HNSC | 1 |
| p.L449P | GBM | 1 |
| p.L535P | KIRC | 1 |
| p.A282D | BLCA | 1 |
| p.R855H | UCEC | 1 |
| p.L973P | COAD | 1 |
| p.Q32* | CESC | 1 |
| p.P560H | COAD | 1 |
| p.A870P | SKCM | 1 |
| p.R42C | DLBC | 1 |
| p.R1113K | LUSC | 1 |
| p.V439M | STAD | 1 |
| p.E1398K | ESCA | 1 |
| p.A440V | UCEC | 1 |
| p.D645N | COAD | 1 |
| p.F100L | THYM | 1 |
| p.A246P | LUSC | 1 |
| p.R663C | COAD | 1 |
| p.R137L | BLCA | 1 |
| p.L1244F | PAAD | 1 |
| p.H1428Y | SKCM | 1 |
| p.F1559L | THYM | 1 |
| p.H1072L | LUAD | 1 |
| p.R886* | STAD | 1 |
| p.D273Y | LUAD | 1 |
| p.S1229R | SARC | 1 |
| p.Q689* | SKCM | 1 |
| p.E892Q | LUSC | 1 |
| p.Q736L | LIHC | 1 |
| p.V247I | LUAD | 1 |
| p.R1630Q | STAD | 1 |
| p.Y1176C | BLCA | 1 |
| p.E1258Q | LIHC | 1 |
| p.Q1112H | LUAD | 1 |
| p.P1555S | SKCM | 1 |
| p.H208Y | SKCM | 1 |
| p.A615V | UCEC | 1 |
| p.A1540V | ACC | 1 |
| p.A5T | HNSC | 1 |
| p.R886X | STAD | 1 |
| p.P1277H | COAD | 1 |
| p.E709K | SKCM | 1 |
| p.P695A | GBM | 1 |
| p.R63Q | COAD | 1 |
| p.L1078F | CESC | 1 |
| p.R564W | SKCM | 1 |
| p.D1116G | BRCA | 1 |
| p.E2K | ESCA | 1 |
| p.R1446* | HNSC | 1 |
| p.F485S | LIHC | 1 |
| p.L432I | SARC | 1 |
| p.A638V | SKCM | 1 |
| p.K1530N | UCEC | 1 |
| p.M44T | LGG | 1 |
| Top |
| TissGeneCNV for IQGAP3 |
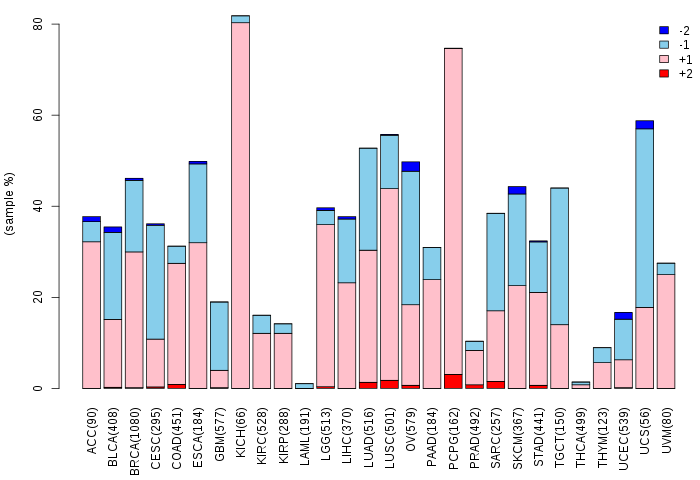
| Copy number variations of TissGene across 28 cancer types (X-axis: cancer type and Y-axis: % of CNV samples) (TCGA Gistic2_CopyNumber_Gistic2_all_data_by_genes, Gistic2 copy number data, version 2016-08-16) |
 |
| Top |
| TissGeneFusions for IQGAP3 |
| Fusion genes including TissGene (ChimerDB 3.0, 2016-12-01 and TCGA fusion Portal 2015-12-01) |
| Database | Src | Cancer type | Sample | Fusion gene | ORF | 5'-gene BP | 3'-gene BP |
| Chimerdb3.0 | ChiTaRs | NA | BF814928 | LOC401320-IQGAP3 | chr7:30601730 | chr1:156517789 | |
| Chimerdb3.0 | FusionScan | BRCA | TCGA-EW-A1OW-01A | GON4L-IQGAP3 | In-Frame | chr1:155823066 | chr1:156510708 |
| TCGAfusionPortal | PRADA | BRCA | TCGA-A8-A08J-01A | RP4-788L13.1-IQGAP3 | Out-of-frame | Chr1:99730227 | Chr1:156521887 |
| TCGAfusionPortal | PRADA | BRCA | TCGA-AR-A0U4-01A | IQGAP3-ETV3 | Out-of-frame | Chr1:156539168 | Chr1:157095771 |
| TCGAfusionPortal | PRADA | BRCA | TCGA-BH-A18R-01A | IQGAP3-SH2D2A | In-frame | Chr1:156526325 | Chr1:156779599 |
| TCGAfusionPortal | PRADA | BRCA | TCGA-EW-A1OW-01A | GON4L-IQGAP3 | In-frame | Chr1:155823067 | Chr1:156510708 |
| Top |
| TissGeneNet for IQGAP3 |
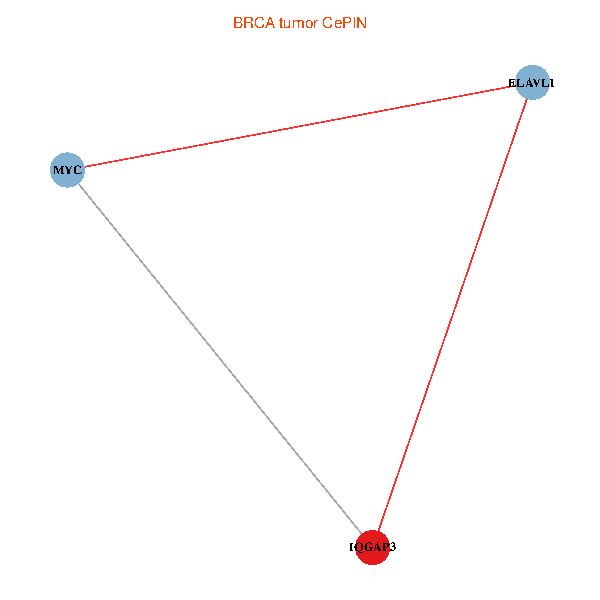
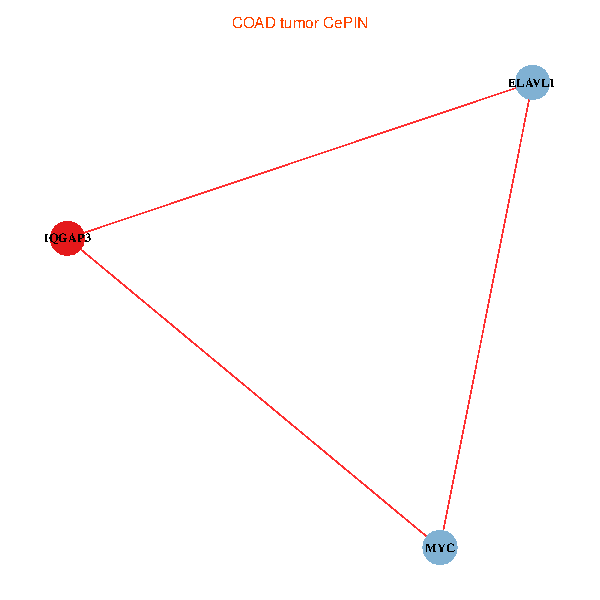
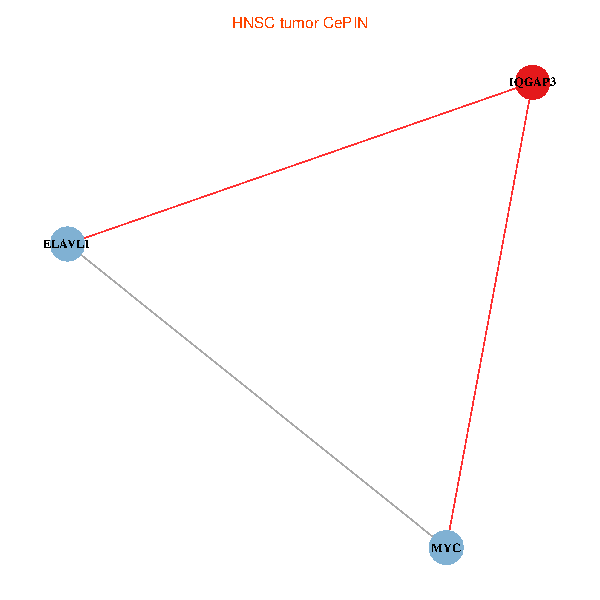
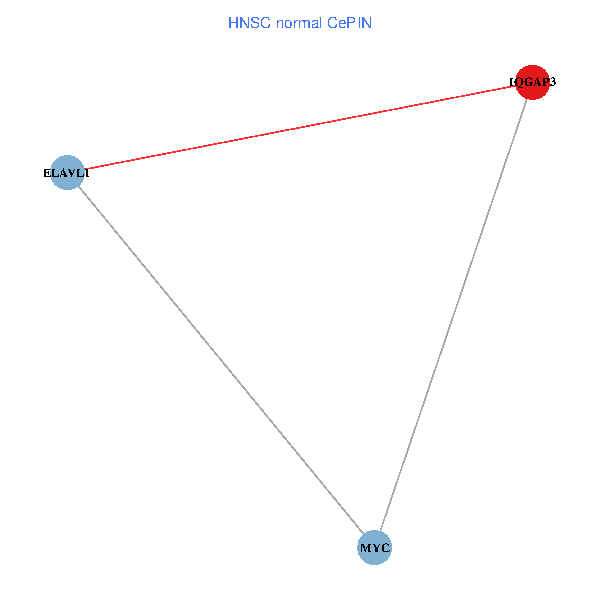
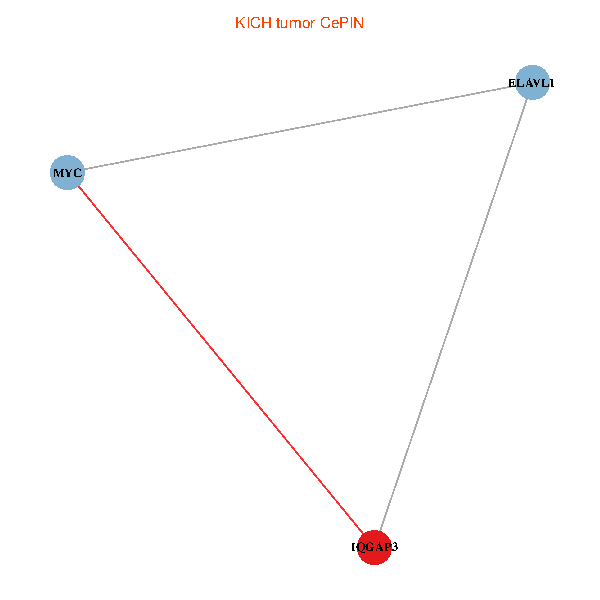
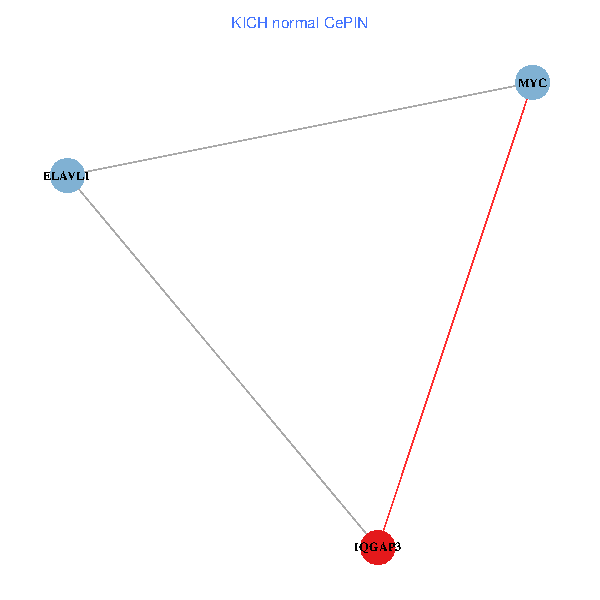
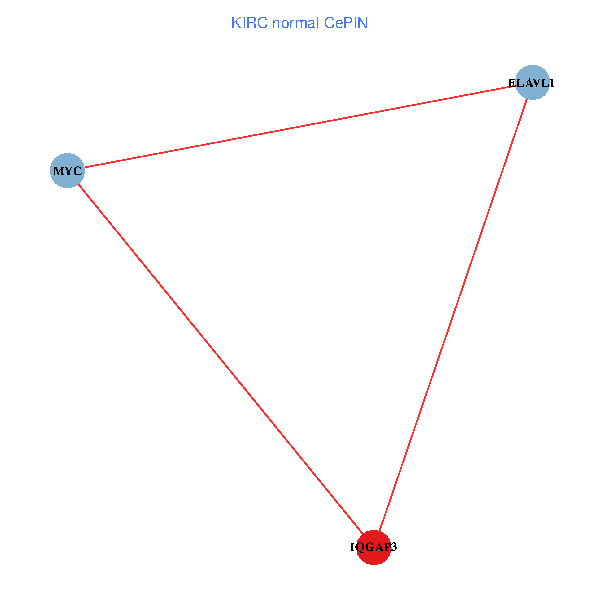
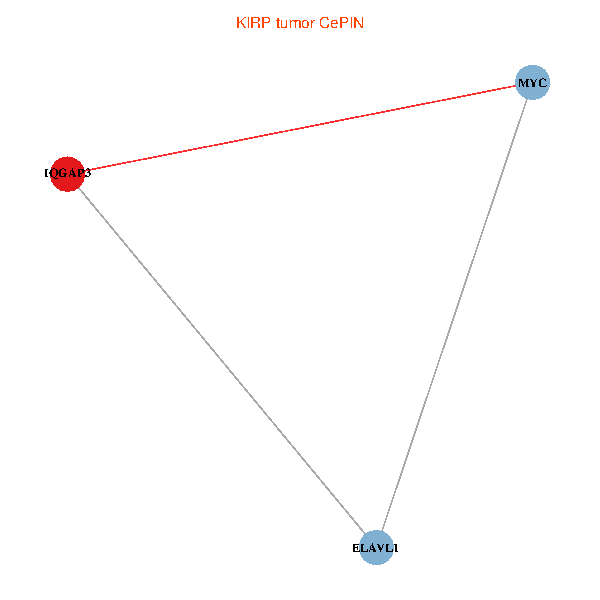
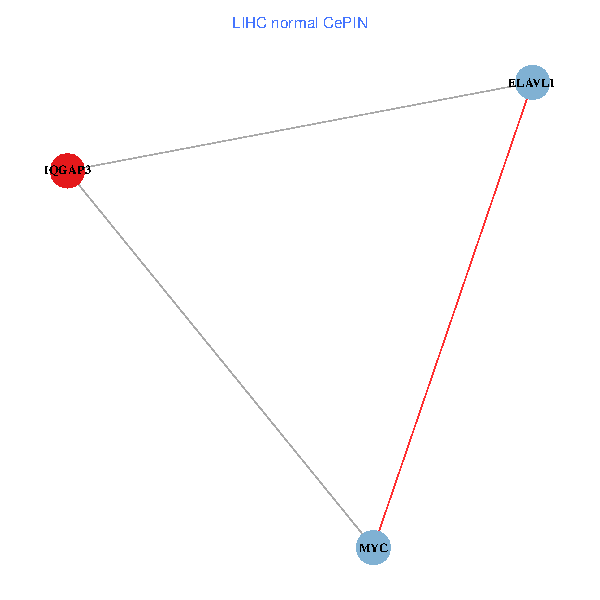
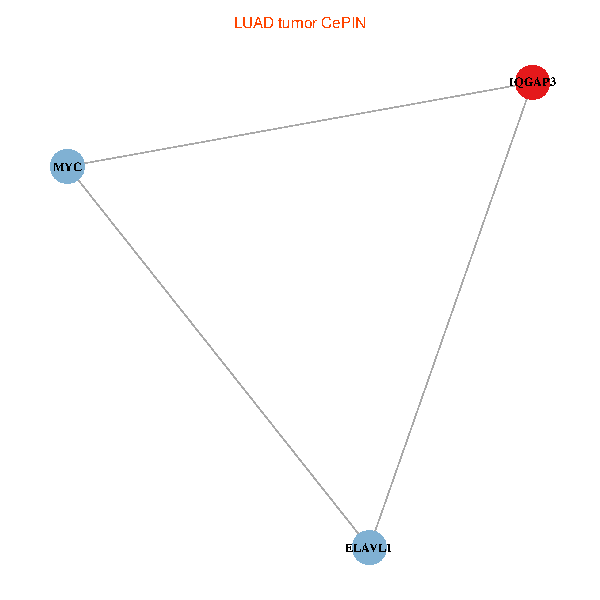
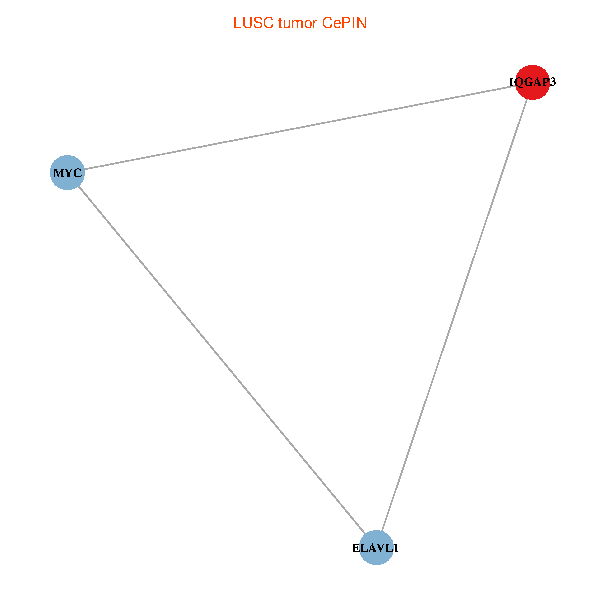
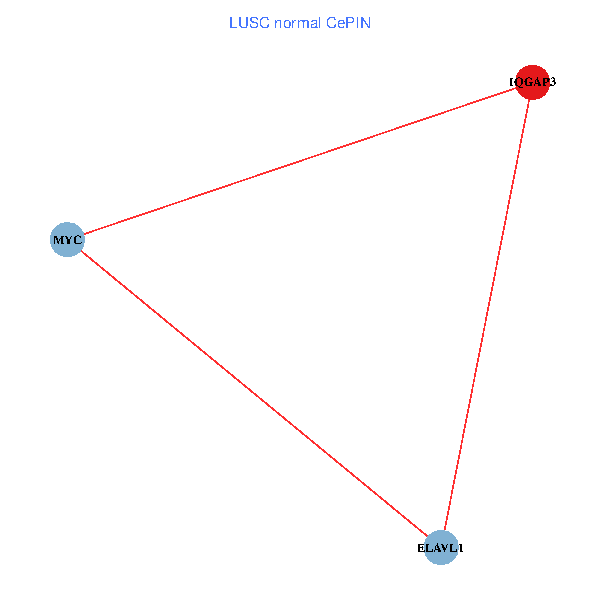
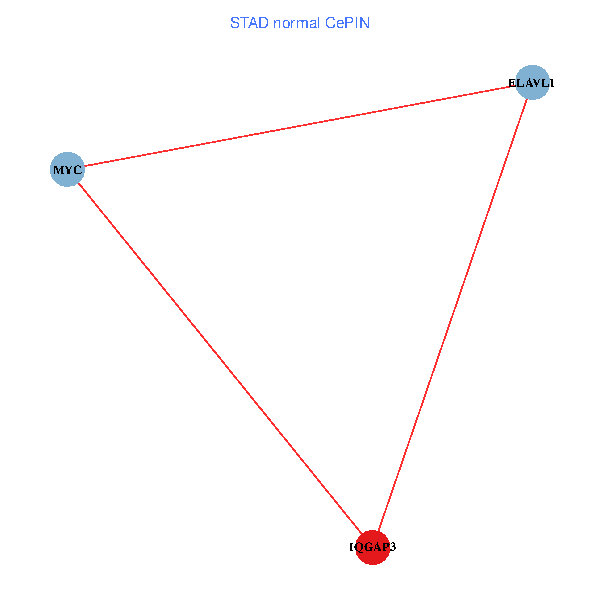
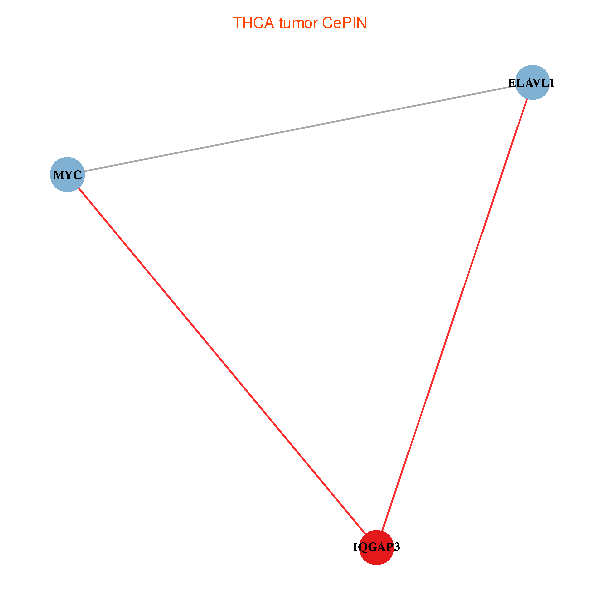
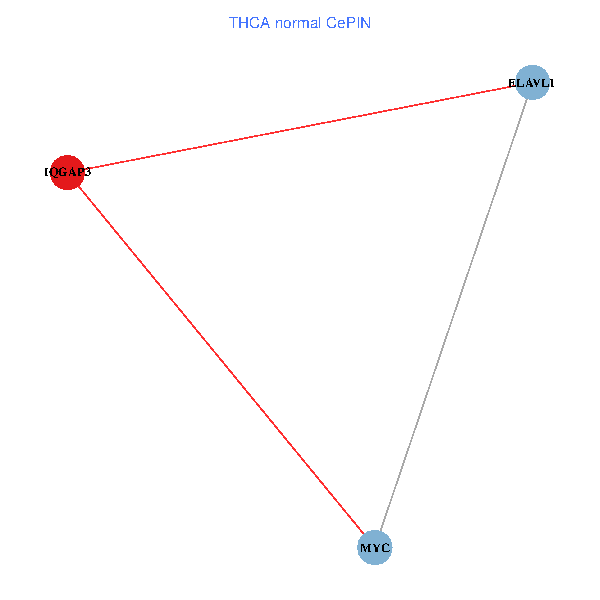
| Co-expressed gene networks based on protein-protein interaction data (CePIN) (TCGA IlluminaHiSeq_RNASeqV2, pan-cancer normalized log2(norm_counts+1) data, version 2016-08-16) (PINA2 ppi data) |
| BRCA (tumor) | BRCA (normal) |
| IQGAP3, ELAVL1, MYC (tumor) | IQGAP3, ELAVL1, MYC (normal) |
 |  |
| COAD (tumor) | COAD (normal) |
| IQGAP3, ELAVL1, MYC (tumor) | IQGAP3, ELAVL1, MYC (normal) |
 |  |
| HNSC (tumor) | HNSC (normal) |
| IQGAP3, ELAVL1, MYC (tumor) | IQGAP3, ELAVL1, MYC (normal) |
 |  |
| KICH (tumor) | KICH (normal) |
| IQGAP3, ELAVL1, MYC (tumor) | IQGAP3, ELAVL1, MYC (normal) |
 |  |
| KIRC (tumor) | KIRC (normal) |
| IQGAP3, ELAVL1, MYC (tumor) | IQGAP3, ELAVL1, MYC (normal) |
 |  |
| KIRP (tumor) | KIRP (normal) |
| IQGAP3, ELAVL1, MYC (tumor) | IQGAP3, ELAVL1, MYC (normal) |
 |  |
| LIHC (tumor) | LIHC (normal) |
| IQGAP3, ELAVL1, MYC (tumor) | IQGAP3, ELAVL1, MYC (normal) |
 |  |
| LUAD (tumor) | LUAD (normal) |
| IQGAP3, ELAVL1, MYC (tumor) | IQGAP3, ELAVL1, MYC (normal) |
 |  |
| LUSC (tumor) | LUSC (normal) |
| IQGAP3, ELAVL1, MYC (tumor) | IQGAP3, ELAVL1, MYC (normal) |
 |  |
| PRAD (tumor) | PRAD (normal) |
| IQGAP3, ELAVL1, MYC (tumor) | IQGAP3, ELAVL1, MYC (normal) |
 |  |
| STAD (tumor) | STAD (normal) |
| IQGAP3, ELAVL1, MYC (tumor) | IQGAP3, ELAVL1, MYC (normal) |
 |  |
| THCA (tumor) | THCA (normal) |
| IQGAP3, ELAVL1, MYC (tumor) | IQGAP3, ELAVL1, MYC (normal) |
 |  |
| Top |
| TissGeneProg for IQGAP3 |
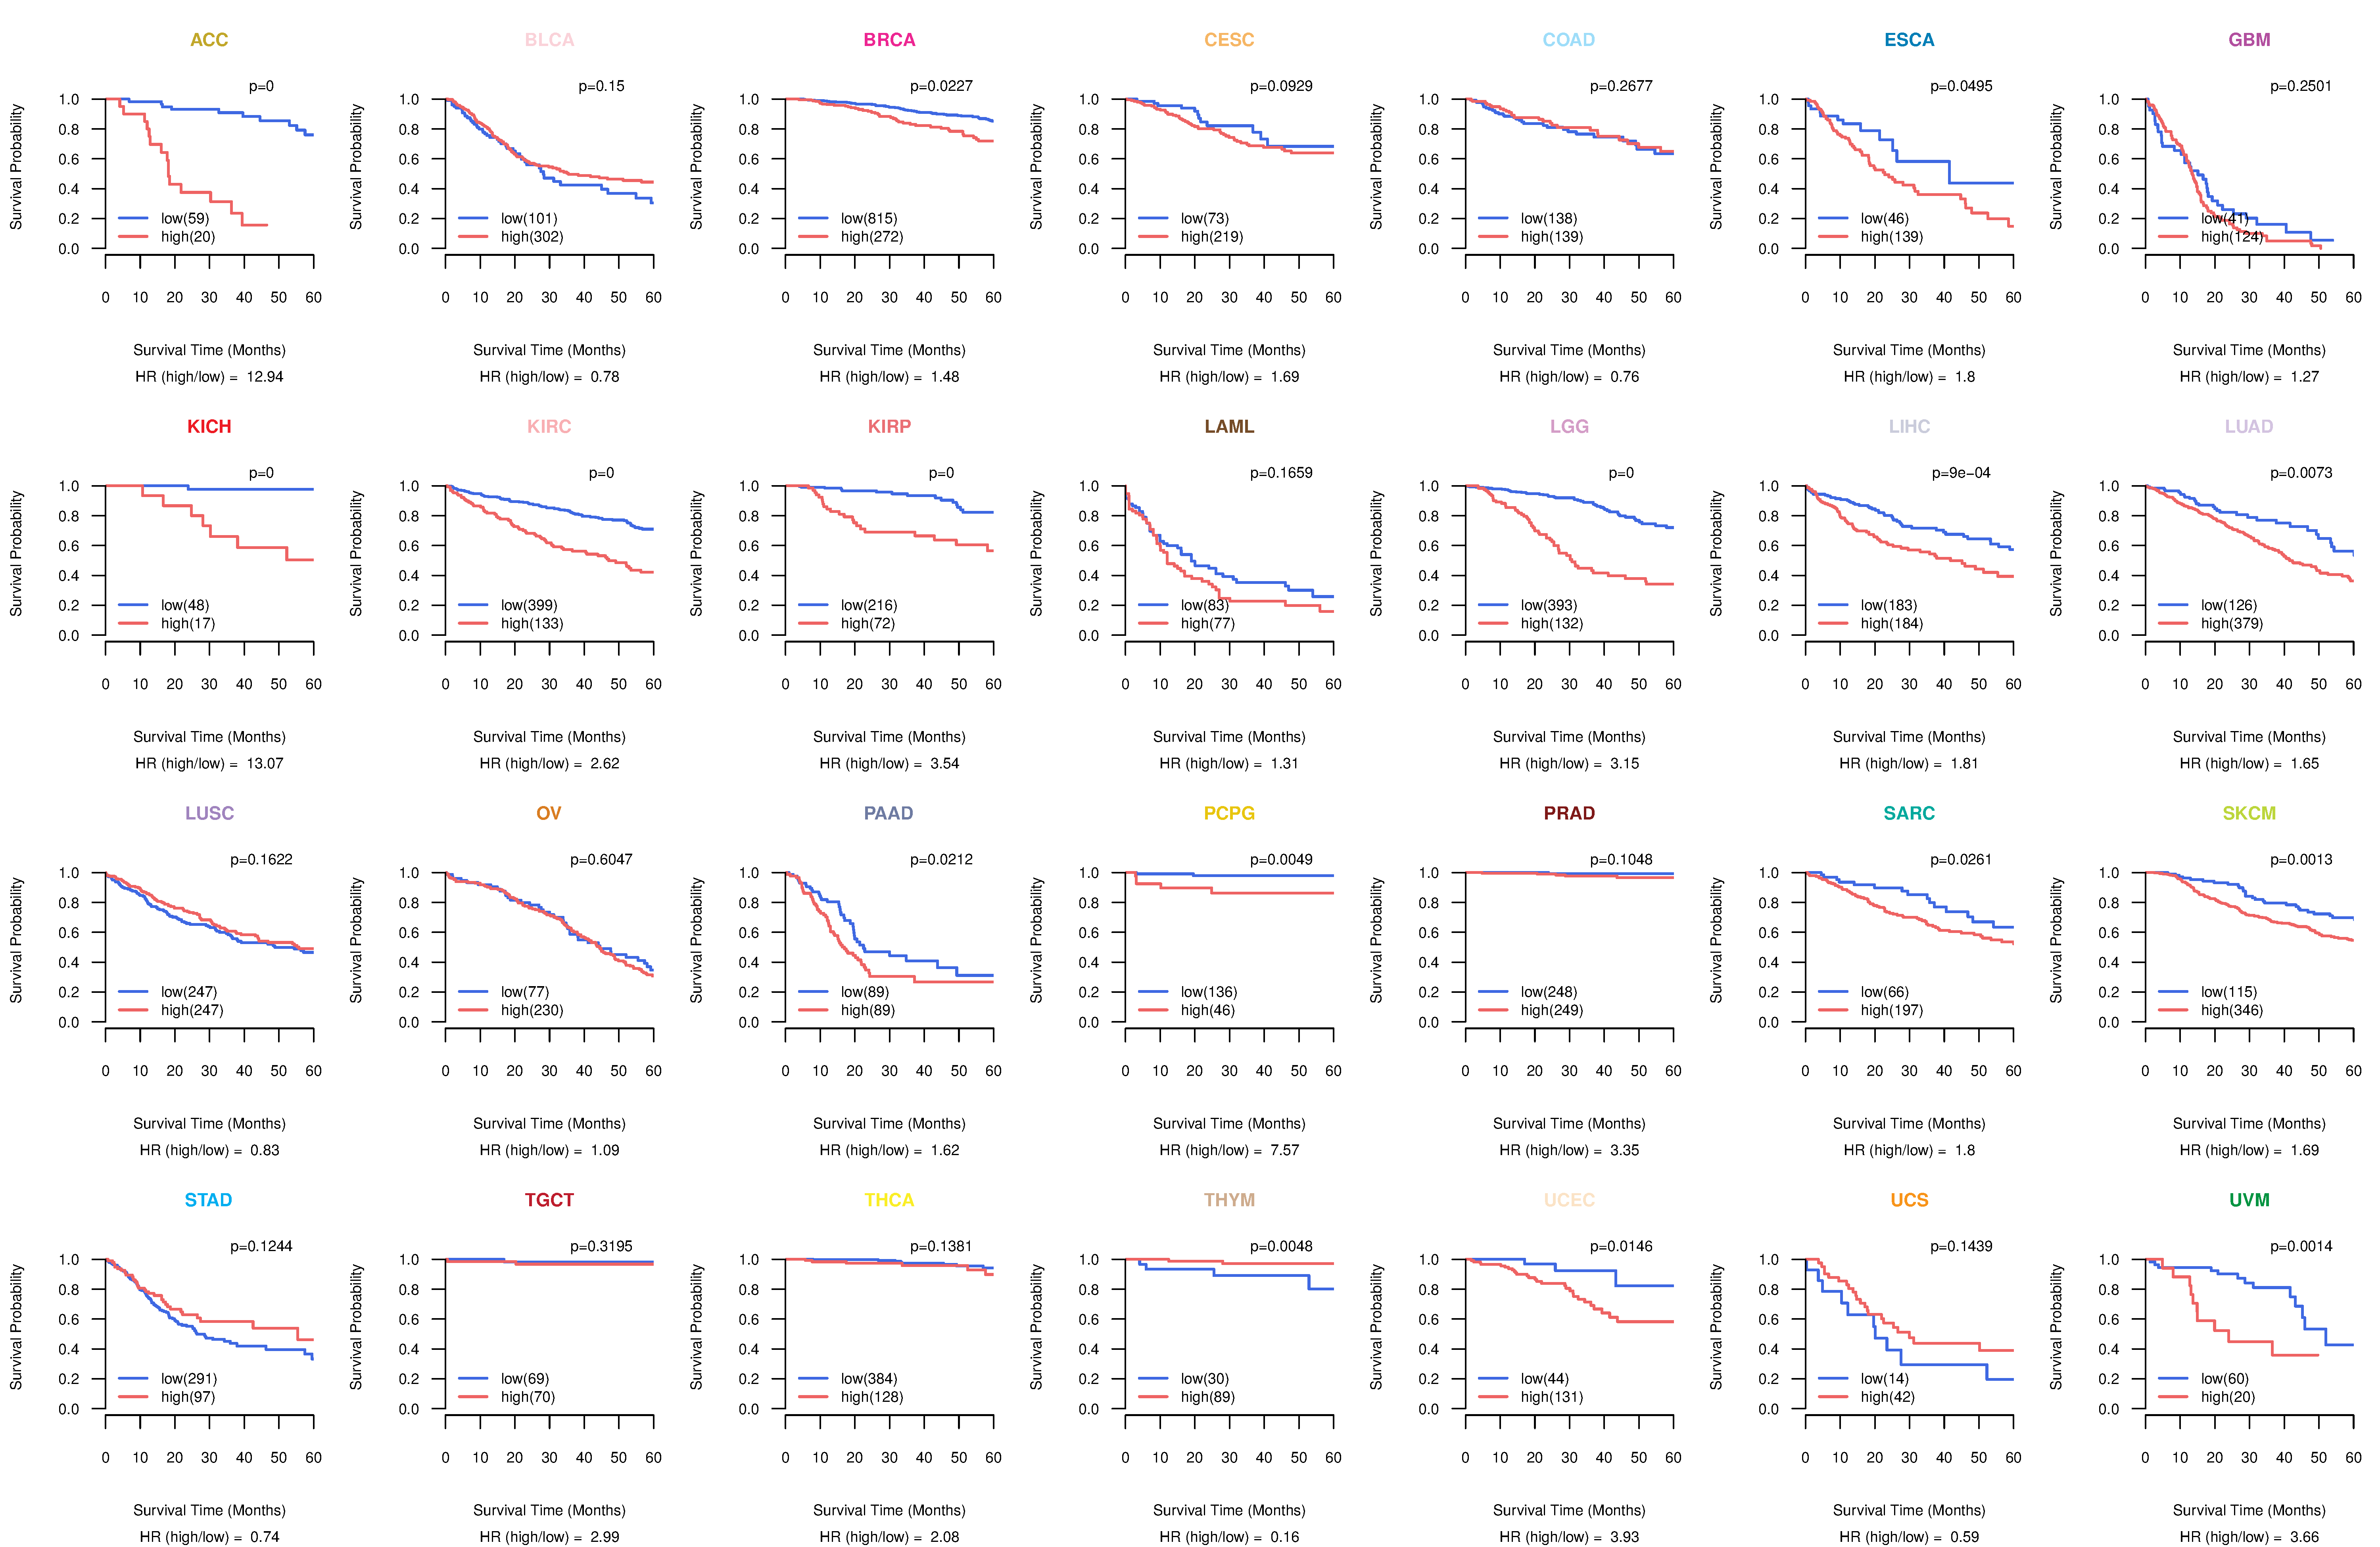
| Kaplan-Meier plots with logrank tests of overall survival (OS) using 28 cancer types (TCGA IlluminaHiSeq_RNASeqV2, pan-cancer normalized log2(norm_counts+1) data, version 2016-08-16) (TCGA clinicalMatrix, phenotype data, version 2016-04-27) * Click on the image to enlarge it in a new window. |
 |
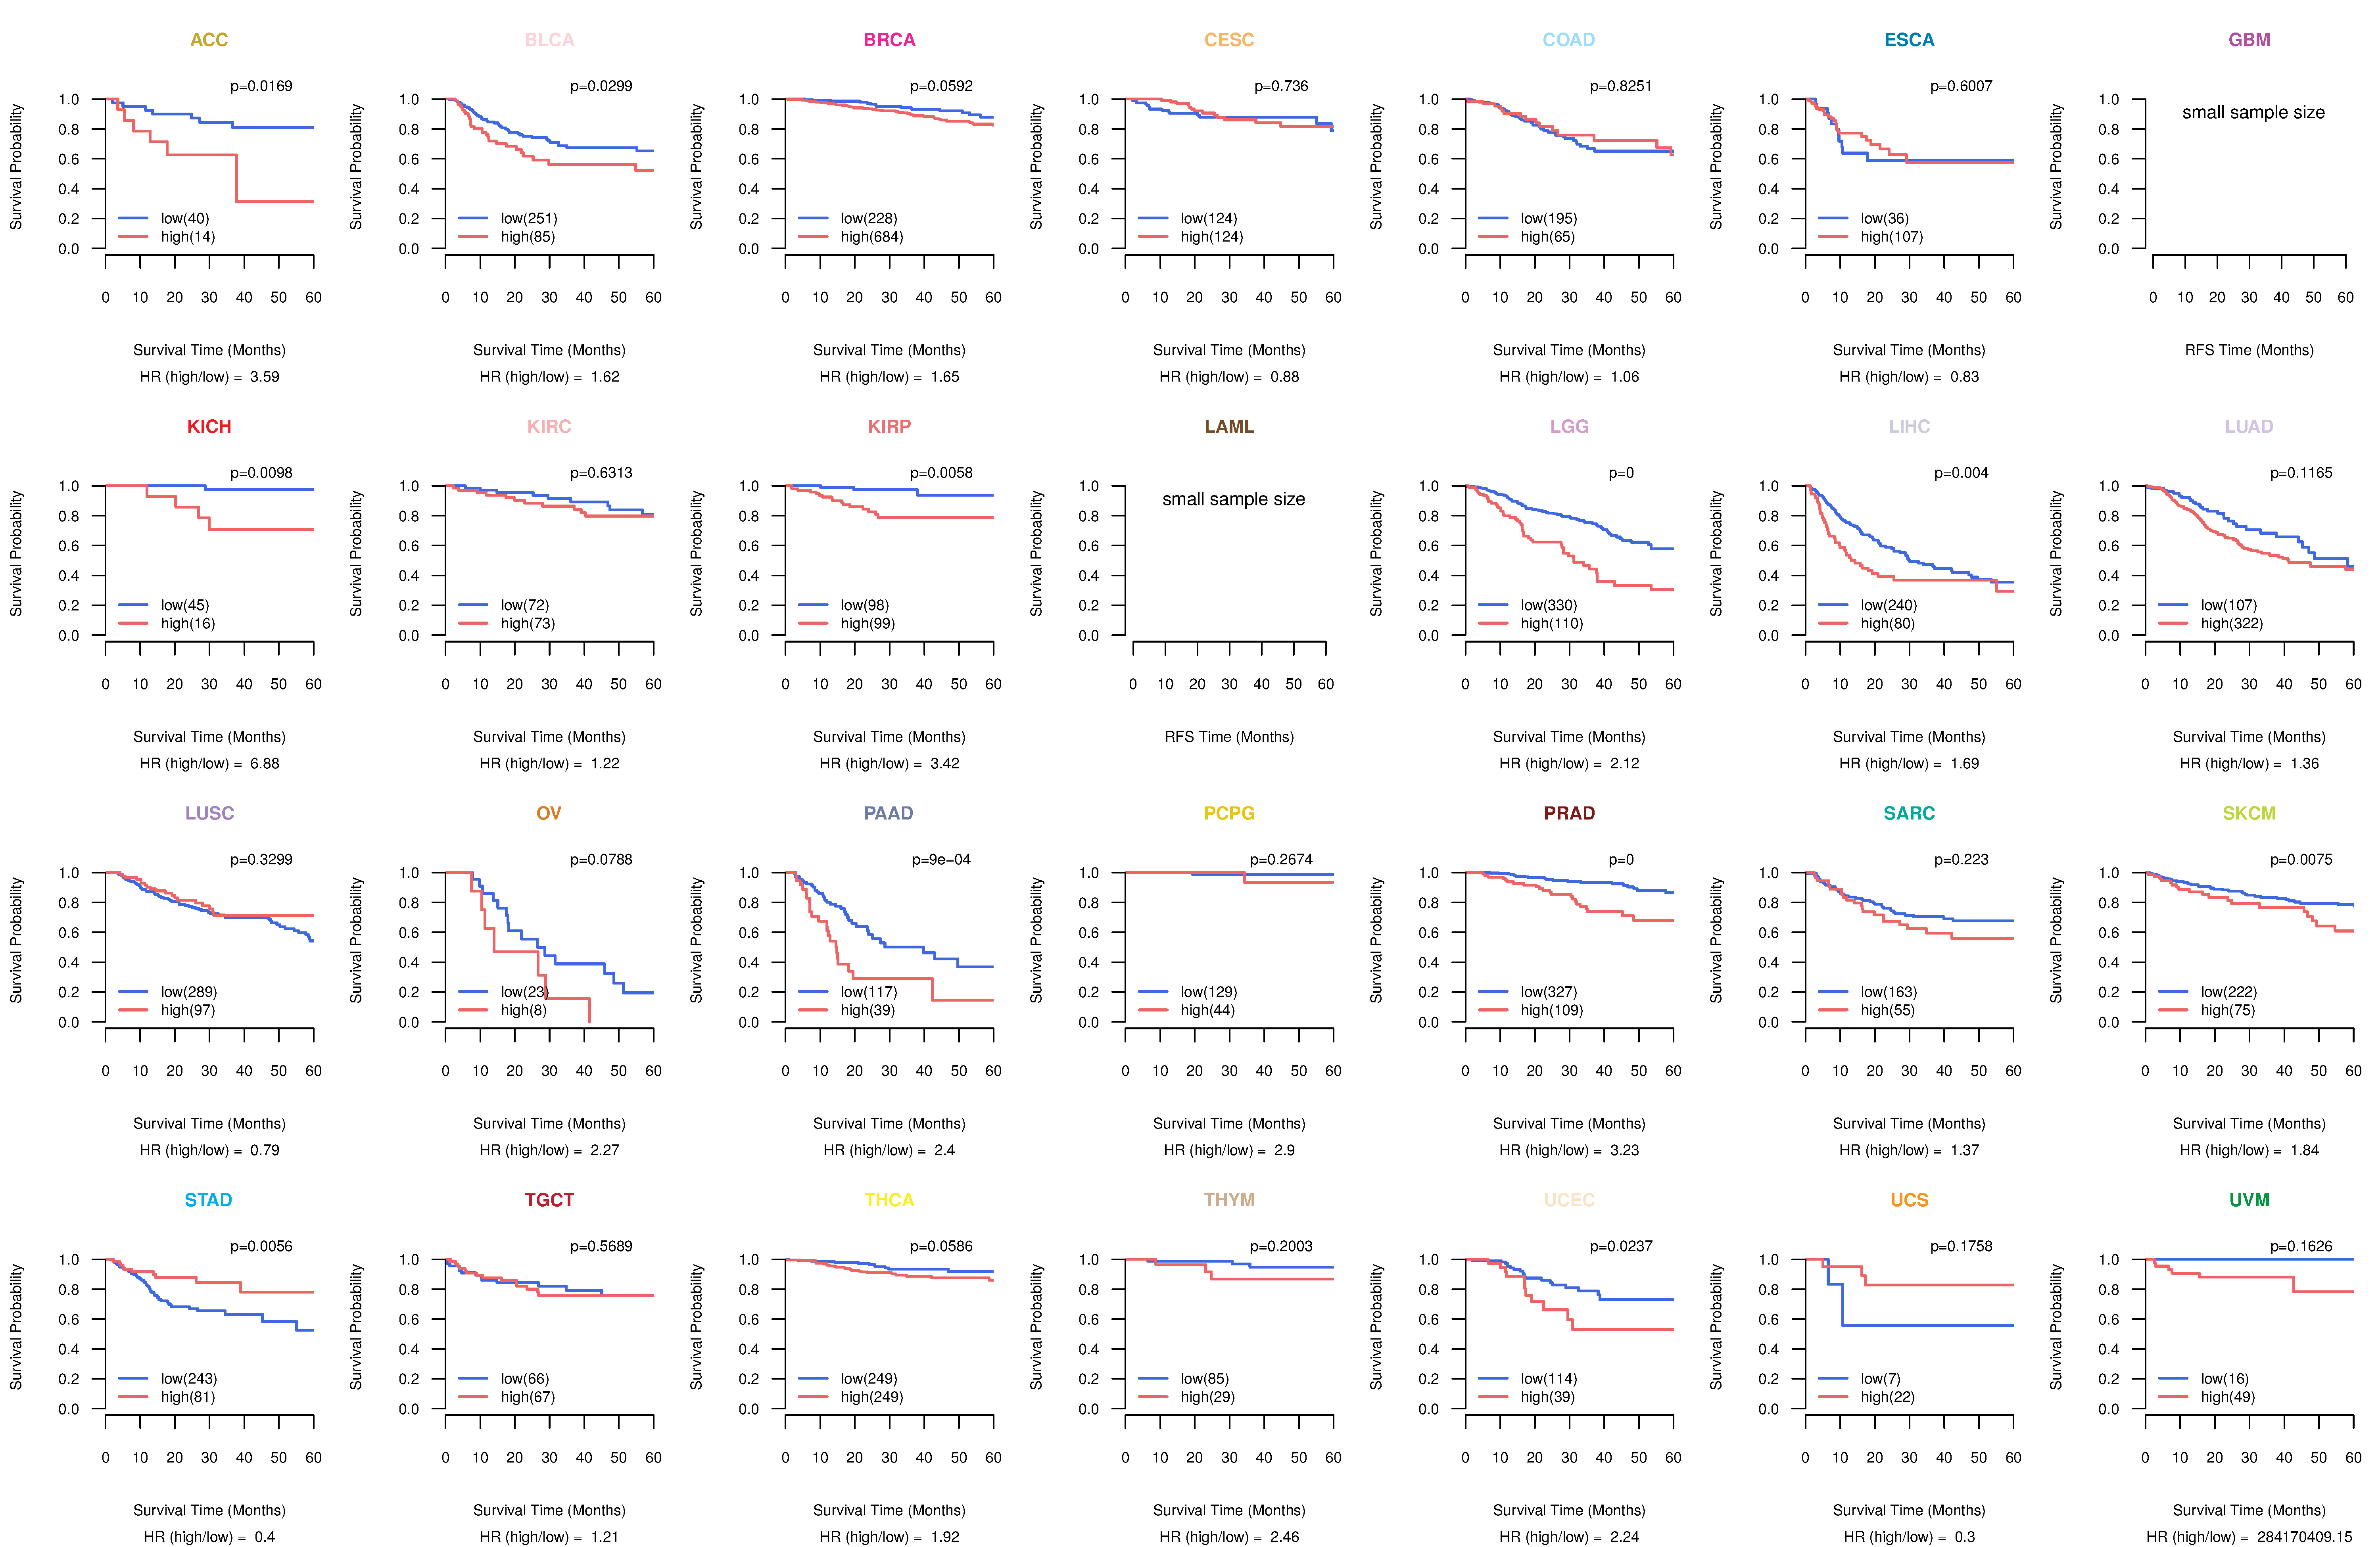
| Kaplan-Meier plots with logrank test of relapse free survival (RFS) using 28 cancer types (TCGA IlluminaHiSeq_RNASeqV2, pan-cancer normalized log2(norm_counts+1) data, version 2016-08-16) (TCGA clinicalMatrix, phenotype data, version 2016-04-27) * Click on the image enlarge it in a new window. |
 |
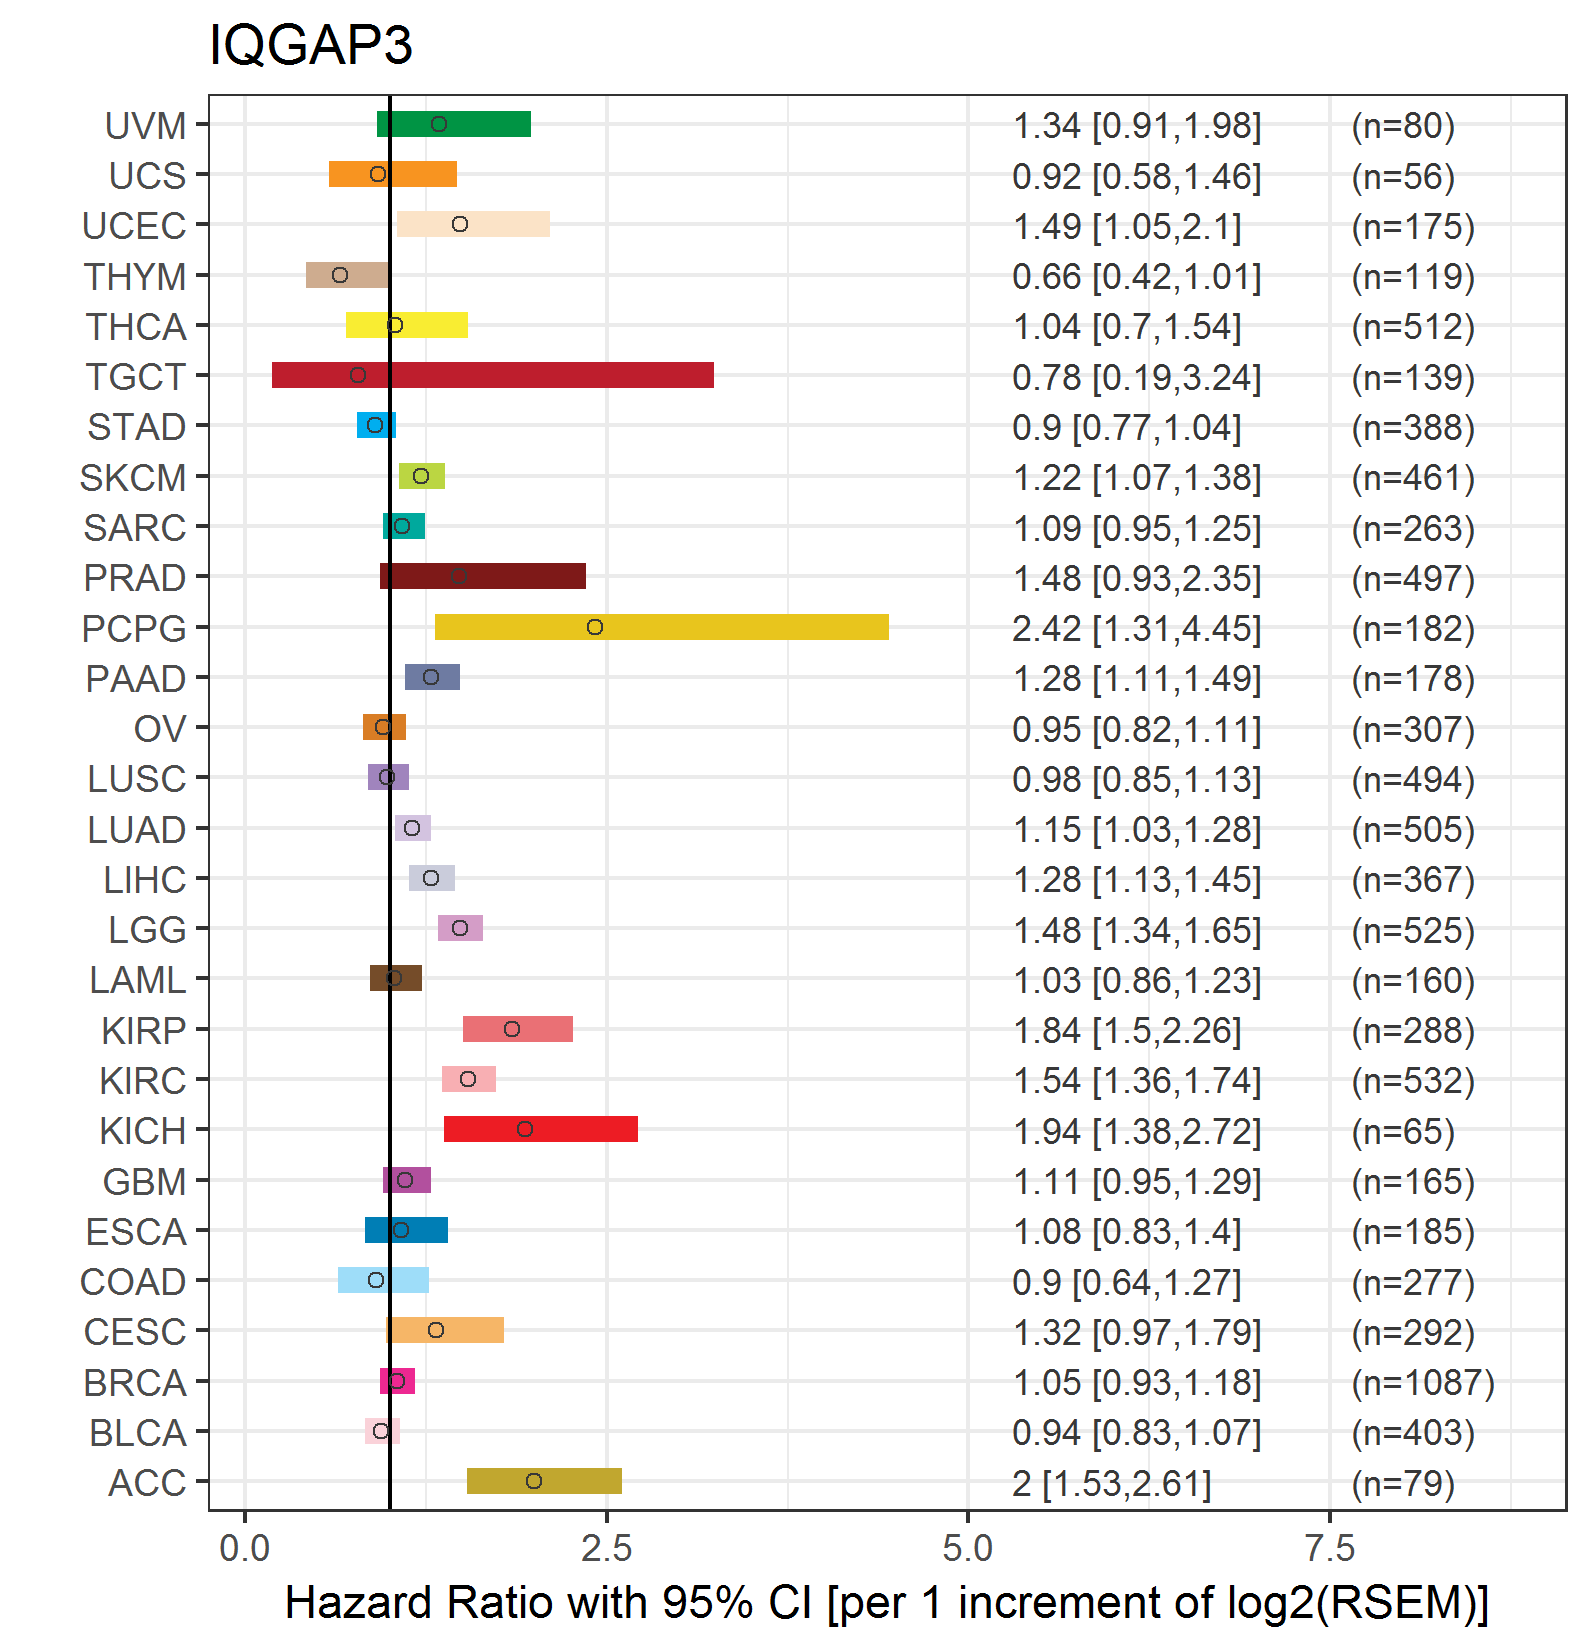
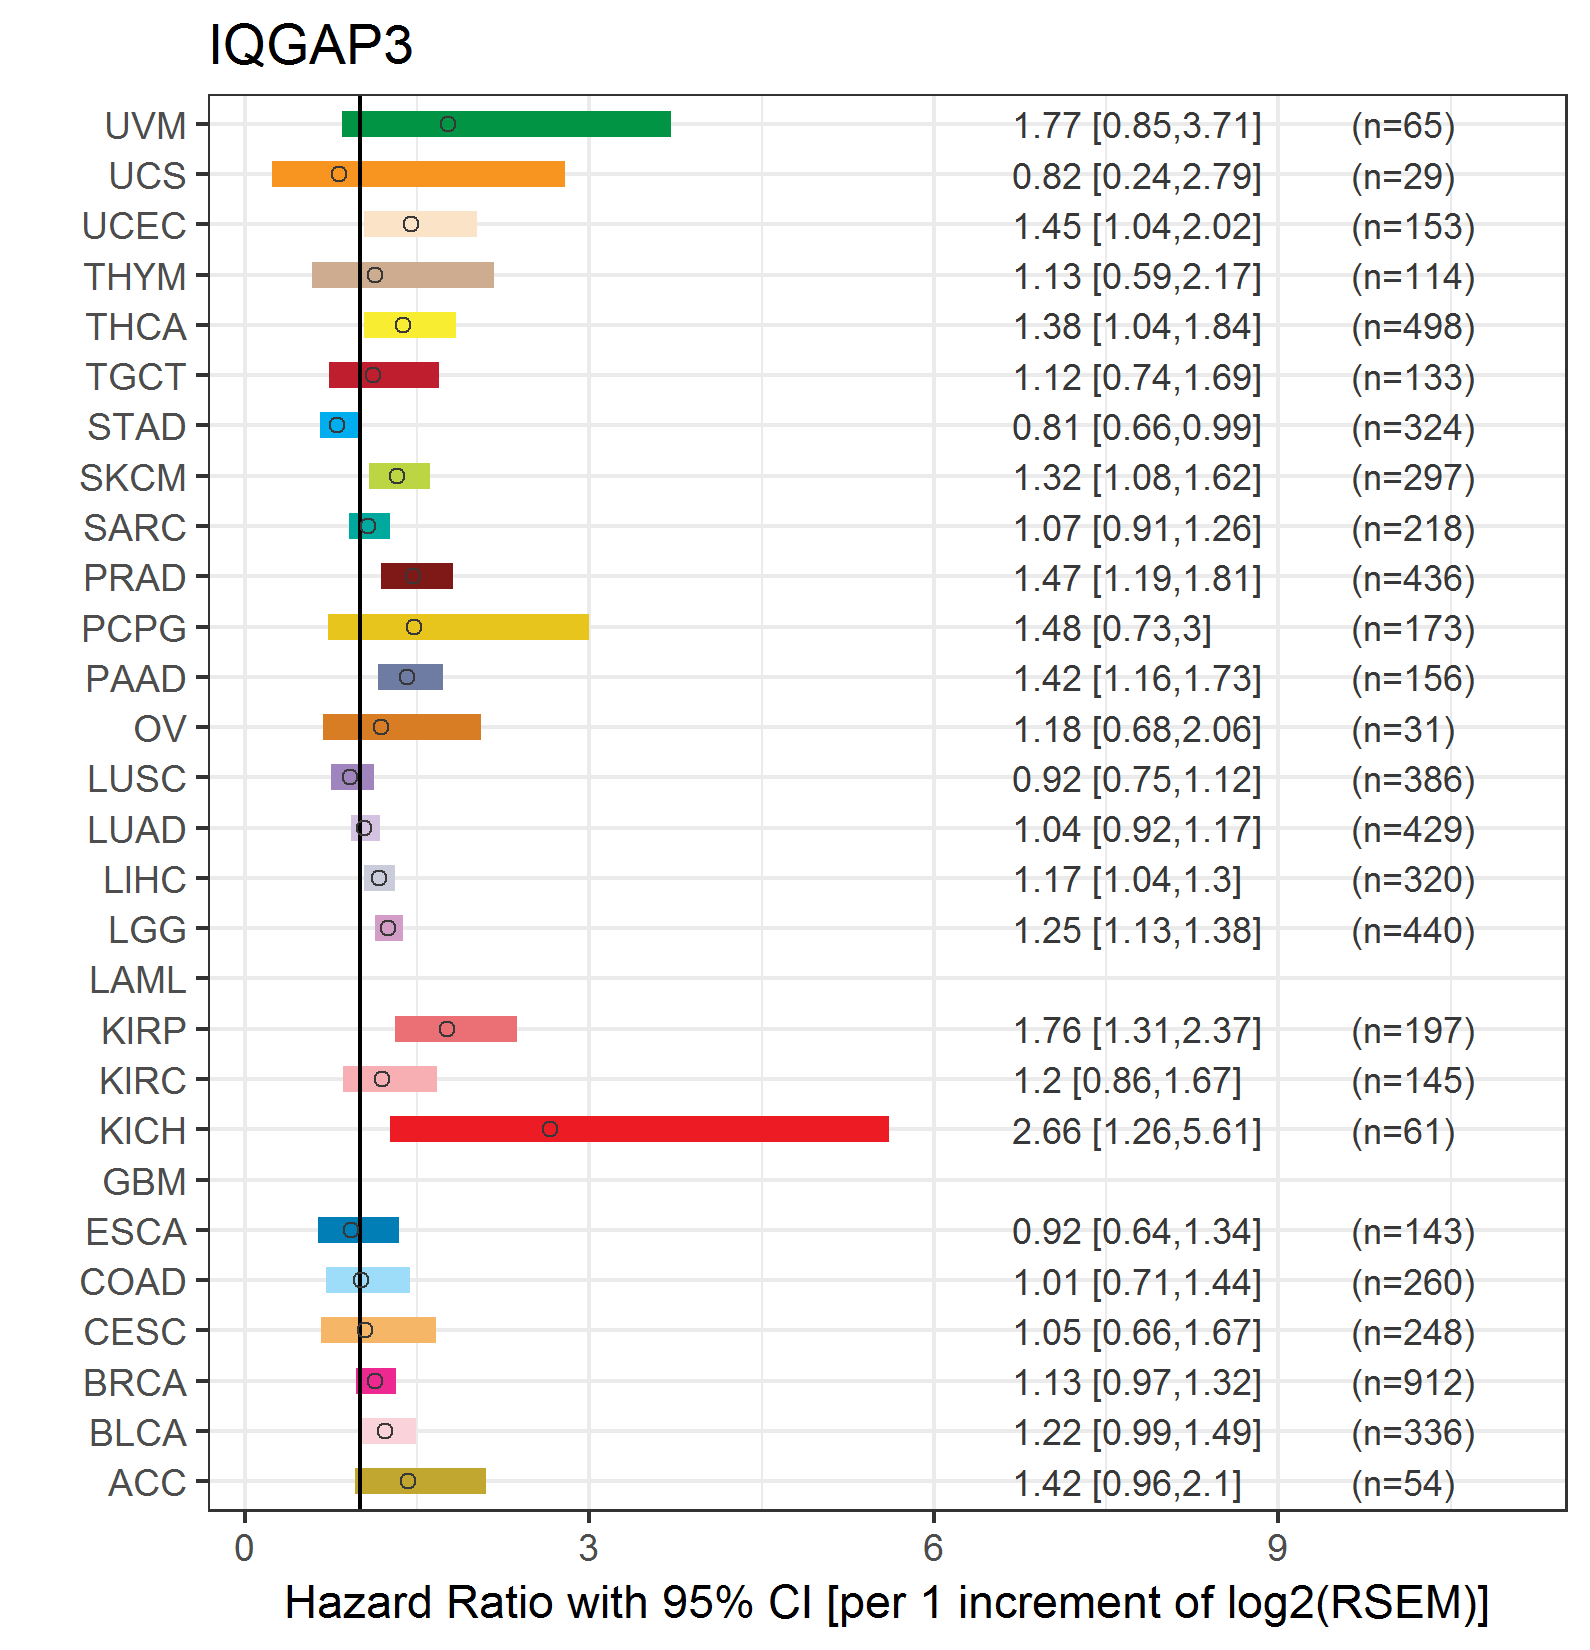
| Forest plot of Cox proportional hazard ratio (HR) and 95% CI of overall survival (OS) using 28 cancer types (TCGA IlluminaHiSeq_RNASeqV2, pan-cancer normalized log2(norm_counts+1) data, version 2016-08-16) (TCGA clinicalMatrix, phenotype data, version 2016-04-27) * Click on the image enlarge it in a new window. |
 |
| Forest plot of Cox proportional hazard ratio (HR) and 95% CI of relapse free survival (RFS) using 28 cancer types (TCGA IlluminaHiSeq_RNASeqV2, pan-cancer normalized log2(norm_counts+1) data, version 2016-08-16) (TCGA clinicalMatrix, phenotype data, version 2016-04-27) * Click on the image enlarge it in a new window. |
 |
| Top |
| TissGeneClin for IQGAP3 |
| TissGeneDrug for IQGAP3 |
| Drug information targeting TissGene (DrugBank Version 5.0.6, 2017-04-01) |
| DrugBank ID | Drug name | Drug activity | Drug type | Drug status |
| Top |
| TissGeneDisease for IQGAP3 |
| Disease information associated with TissGene (DisGeNet, 2016-06-01) |
| Disease ID | Disease name | # pubmeds | Source |
| umls:C0027627 | Neoplasm Metastasis | 1 | BeFree |
| umls:C0178874 | Tumor Progression | 1 | BeFree |
| umls:C0242379 | Malignant neoplasm of lung | 1 | BeFree |
| umls:C0596263 | Carcinogenesis | 1 | BeFree |
| umls:C0684249 | Carcinoma of lung | 1 | BeFree |
|
Copyright 2016-Present - The University of Texas Health Science Center at Houston (UTHealth) Web File Viewing | How to Report, Fraud, Waste and Abuse | State of Texas | Statewide Search | Texas Homeland Security | Site Policies |