 |
| |
| |
| |
| |
| |
| |
|

| TissGeneSummary for NKAIN4 |
 Gene summary Gene summary |
| Basic gene information | Gene symbol | NKAIN4 |
| Gene name | Na+/K+ transporting ATPase interacting 4 | |
| Synonyms | C20orf58|FAM77A|bA261N11.2 | |
| Cytomap | UCSC genome browser: 20q13.33 | |
| Type of gene | protein-coding | |
| RefGenes | NM_152864.3, | |
| Description | Na(+)/K(+)-transporting ATPase subunit beta-1-interacting protein 4sodium/potassium-transporting ATPase subunit beta-1-interacting protein 4 | |
| Modification date | 20141207 | |
| dbXrefs | MIM : 612873 | |
| HGNC : HGNC | ||
| Ensembl : ENSG00000101198 | ||
| HPRD : 12776 | ||
| Vega : OTTHUMG00000032959 | ||
| Protein | UniProt: go to UniProt's Cross Reference DB Table | |
| Expression | CleanEX: HS_NKAIN4 | |
| BioGPS: 128414 | ||
| Pathway | NCI Pathway Interaction Database: NKAIN4 | |
| KEGG: NKAIN4 | ||
| REACTOME: NKAIN4 | ||
| Pathway Commons: NKAIN4 | ||
| Context | iHOP: NKAIN4 | |
| ligand binding site mutation search in PubMed: NKAIN4 | ||
| UCL Cancer Institute: NKAIN4 | ||
| Assigned class in TissGDB* | B | |
| Included tissue-specific gene expression resources | HPA,TiGER,GTEx | |
| Specific-tissues in normal samples (assigned by TissGDB using HPA, TiGER, and GTEx) | BrainKidney | |
| Cancer types related to the specific-tissues in cancer samples (assigned by TissGDB using TCGA) | GBM,LGGKIRC,KIRP,KICH | |
| Reference showing the relevant tissue of NKAIN4 | ||
| Description by TissGene annotations | Protective TissGene in OS | |
| * Class A consists of genes with literature evidence and is part of the cTissGenes. Class B consists of only cTissGenes without additional evidence. The remaining genes belong to Class C. |
| Gene ontology having evidence of Inferred from Direct Assay (IDA) from Entrez |
| GO ID | GO term | PubMed ID |
| Top |
| TissGeneExp for NKAIN4 |
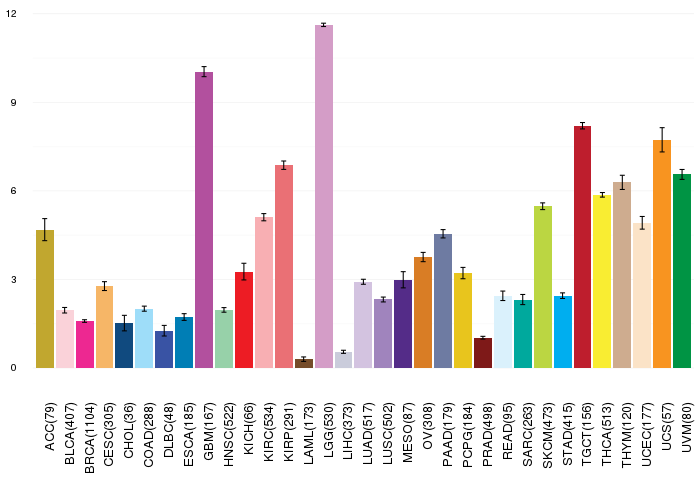
| Gene expressions across 28 cancer types (X-axis: cancer type and Y-axis: log2(norm_counts+1)) (TCGA IlluminaHiSeq_RNASeqV2, pan-cancer normalized log2(norm_counts+1) data, version 2016-08-16) |
 |
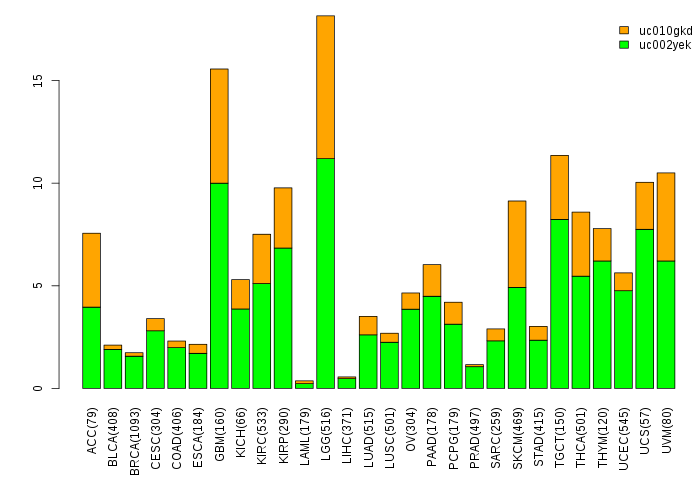
| Gene isoform expressions across 28 cancer types (X-axis: cancer type and Y-axis: log2(norm_counts+1)) (TCGA pan-cancer tcga_rsem_isoform_tpm, version 2016-09-01) |
 |
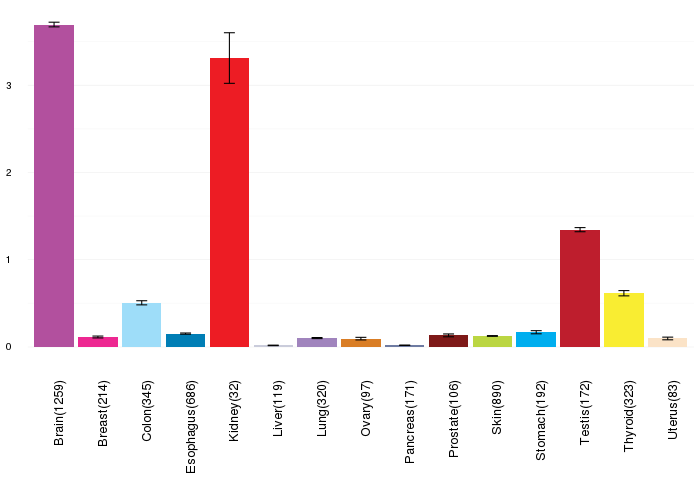
| Gene expressions across normal tissues of GTEx data (GTEx GTEx_Analysis_v6_RNA-seq_RNA-SeQCv1.1.8_gene_rpkm.gct) - Here, we shows the matched tissue types only among our 28 cancer types. |
 |
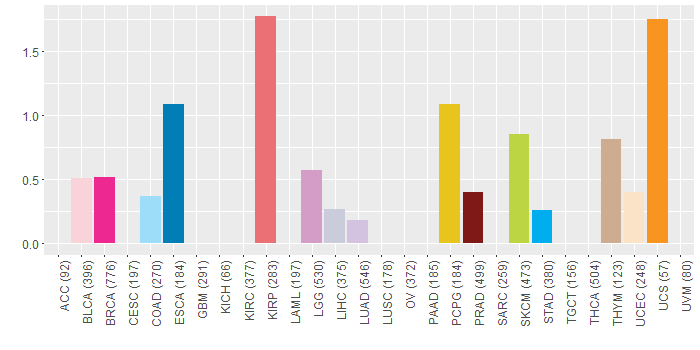
| Different expressions across 14 cancer types with more than 10 samples between matched tumors and normals (X-axis: cancer type and Y-axis: log2(norm_counts+1)) (TCGA IlluminaHiSeq_RNASeqV2, pan-cancer normalized log2(norm_counts+1) data, version 2016-08-16) |
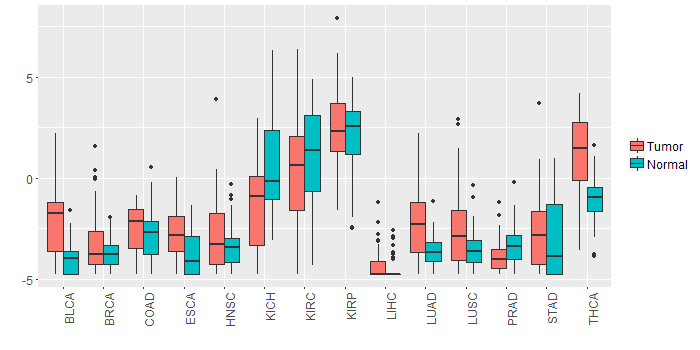 |
| - Significantly differentially expressed cancer types and information. (|Fold change|>1 and FDR<0.05) |
| Cancer type | Mean(exp) in tumor | Mean(exp) in matched normal | Log2FC | P-val. | FDR |
| LUAD | -2.184178489 | -3.654188834 | 1.470010345 | 1.89E-07 | 7.11E-07 |
| THCA | 1.270511137 | -1.032161744 | 2.302672881 | 2.93E-13 | 2.90E-12 |
| BLCA | -1.943785295 | -3.857669505 | 1.913884211 | 0.00113 | 0.007878119 |
| KICH | -1.400186558 | 0.695133442 | -2.09532 | 0.00293 | 0.005823012 |
| Top |
| TissGene-miRNA for NKAIN4 |
| Significantly anti-correlated miRNAs of TissGene across 28 cancer types (Gene-miRNA relations from TargetScanHuman Relsease 7.1, Conserved_Site_Context_Scores.txt.zip, 06.01.2016) (TCGA IlluminaHiSeq_miRNASeq, log2(RPM+1) data, version 2016-11-21) (TCGA IlluminaHiSeq_RNASeqV2, log2(normalized_count+1) data, version 2016-08-16) (Spearman’s Rank Correlation (p-value<0.05 and coefficient<-0.25)) |
| Cancer type | miRNA id | miRNA accession | P-val. | Coeff. | # samples |
| Top |
| TissGeneMut for NKAIN4 |
| TissGeneSNV for NKAIN4 |
| nsSNV counts per each loci. Different colors of circles represent different cancer types. Circle size denotes number of samples. (TCGA somatic mutation (SNPs and small INDELs) data, version 2016-04-25) * Click on the image to enlarge it in a new window. |
 |
 |
| Somatic nucleotide variants of TissGene across 28 cancer types (X-axis: cancer type and Y-axis: % of mutated samples) The numbers in parentheses are numbers of samples with mutation (nsSNVs). (TCGA somatic mutation (SNPs and small INDELs) data, version 2016-04-25) |
 |
| - nsSNVs sorted by frequency. |
| AAchange | Cancer type | # samples |
| p.C151G | KIRP | 5 |
| p.C151G | SKCM | 2 |
| p.C151G | PRAD | 2 |
| p.C151G | LGG | 2 |
| p.V170M | UCEC | 1 |
| p.W75* | BLCA | 1 |
| p.D176N | SKCM | 1 |
| p.N193T | LUAD | 1 |
| p.G87C | ESCA | 1 |
| p.C151G | PCPG | 1 |
| p.T172M | UCS | 1 |
| p.H191Y | HNSC | 1 |
| p.F82V | BLCA | 1 |
| p.S197Y | THYM | 1 |
| p.A131D | BRCA | 1 |
| p.K91Q | BRCA | 1 |
| p.R58L | LGG | 1 |
| p.N76S | LIHC | 1 |
| p.G53C | STAD | 1 |
| p.C151G | BRCA | 1 |
| p.I44M | BRCA | 1 |
| p.K91Q | PCPG | 1 |
| p.A131D | COAD | 1 |
| p.L89F | SKCM | 1 |
| p.G123R | ESCA | 1 |
| Top |
| TissGeneCNV for NKAIN4 |
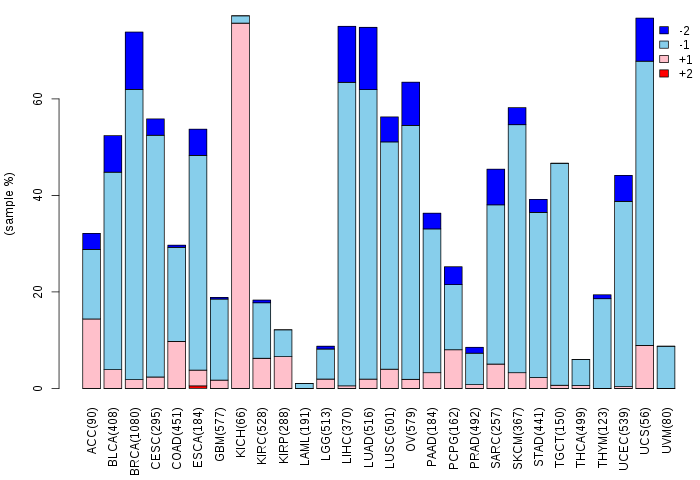
| Copy number variations of TissGene across 28 cancer types (X-axis: cancer type and Y-axis: % of CNV samples) (TCGA Gistic2_CopyNumber_Gistic2_all_data_by_genes, Gistic2 copy number data, version 2016-08-16) |
 |
| Top |
| TissGeneFusions for NKAIN4 |
| Fusion genes including TissGene (ChimerDB 3.0, 2016-12-01 and TCGA fusion Portal 2015-12-01) |
| Database | Src | Cancer type | Sample | Fusion gene | ORF | 5'-gene BP | 3'-gene BP |
| Chimerdb3.0 | ChiTaRs | NA | AW375850 | GPBP1-NKAIN4 | chr5:56510020 | chr20:61874002 | |
| Chimerdb3.0 | ChiTaRs | NA | BP349453 | NKAIN4-NKAIN4 | chr20:61884908 | chr20:61881303 | |
| Chimerdb3.0 | TopHat-Fusion | BRCA | TCGA-BH-A0H9-01A | ECI1-NKAIN4 | Out-of-Frame | chr16:2293046 | chr20:61882098 |
| Top |
| TissGeneNet for NKAIN4 |
| Co-expressed gene networks based on protein-protein interaction data (CePIN) (TCGA IlluminaHiSeq_RNASeqV2, pan-cancer normalized log2(norm_counts+1) data, version 2016-08-16) (PINA2 ppi data) |
| Top |
| TissGeneProg for NKAIN4 |
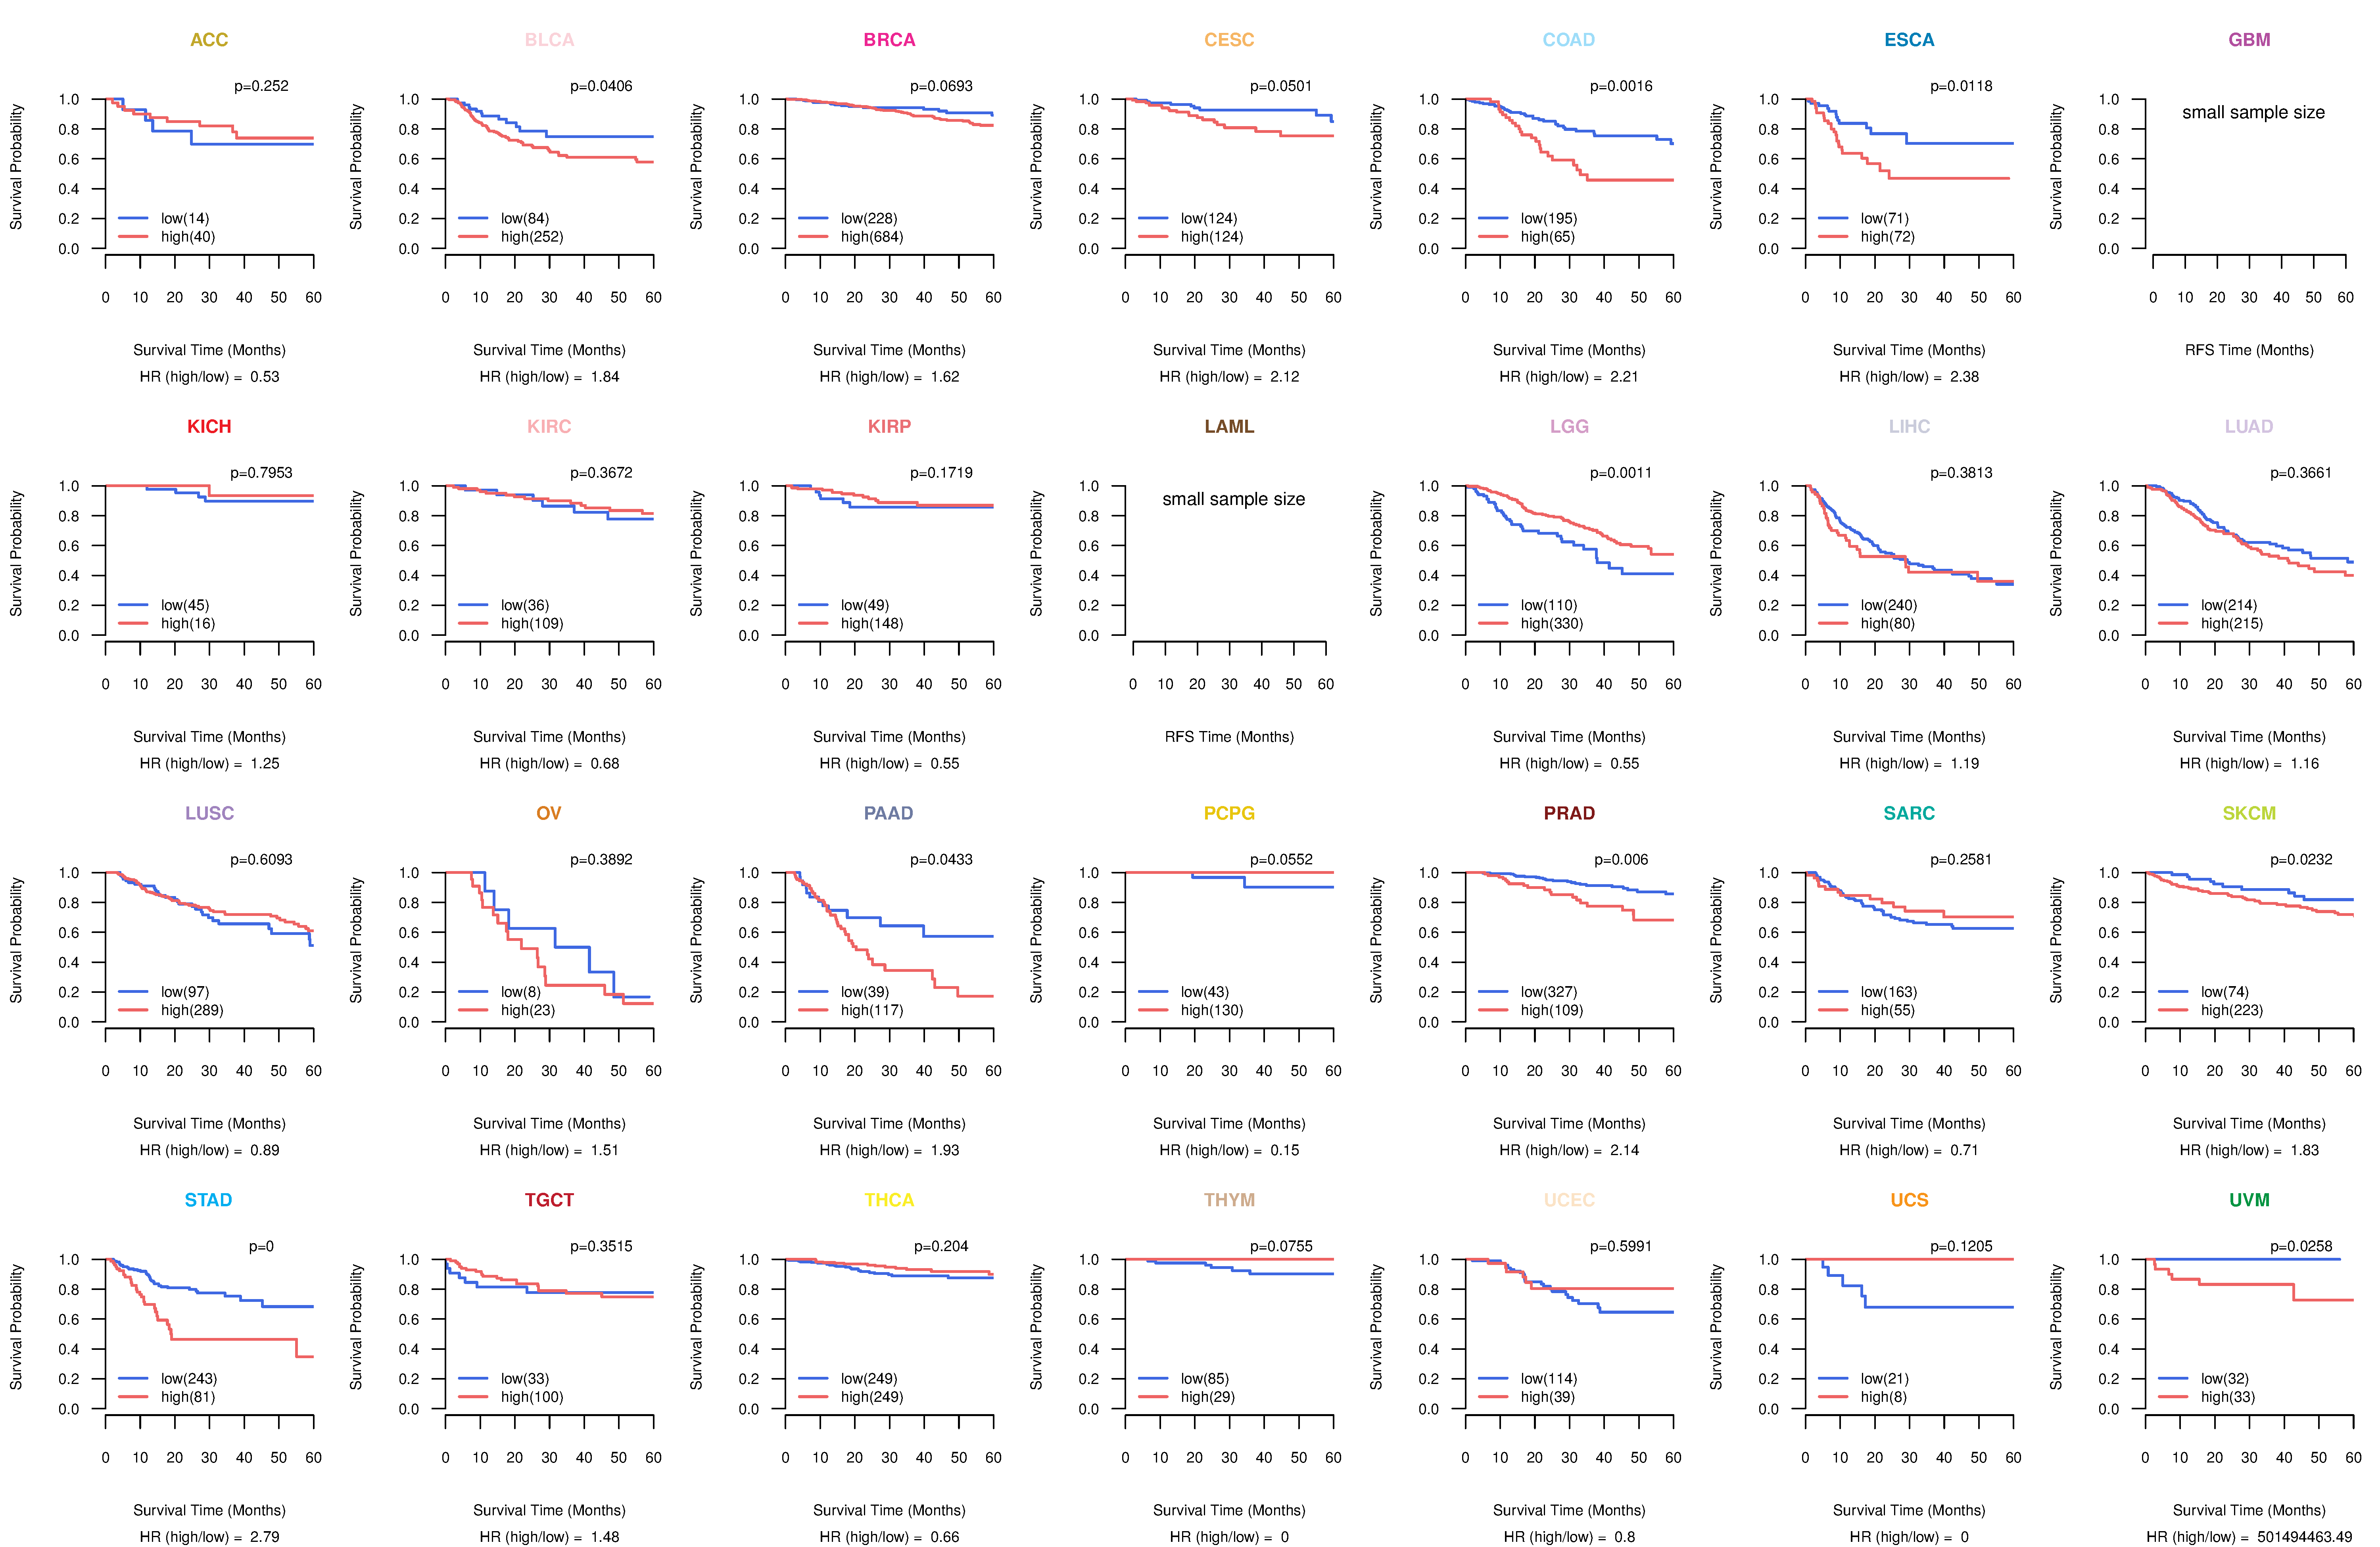
| Kaplan-Meier plots with logrank tests of overall survival (OS) using 28 cancer types (TCGA IlluminaHiSeq_RNASeqV2, pan-cancer normalized log2(norm_counts+1) data, version 2016-08-16) (TCGA clinicalMatrix, phenotype data, version 2016-04-27) * Click on the image to enlarge it in a new window. |
 |
| Kaplan-Meier plots with logrank test of relapse free survival (RFS) using 28 cancer types (TCGA IlluminaHiSeq_RNASeqV2, pan-cancer normalized log2(norm_counts+1) data, version 2016-08-16) (TCGA clinicalMatrix, phenotype data, version 2016-04-27) * Click on the image enlarge it in a new window. |
 |
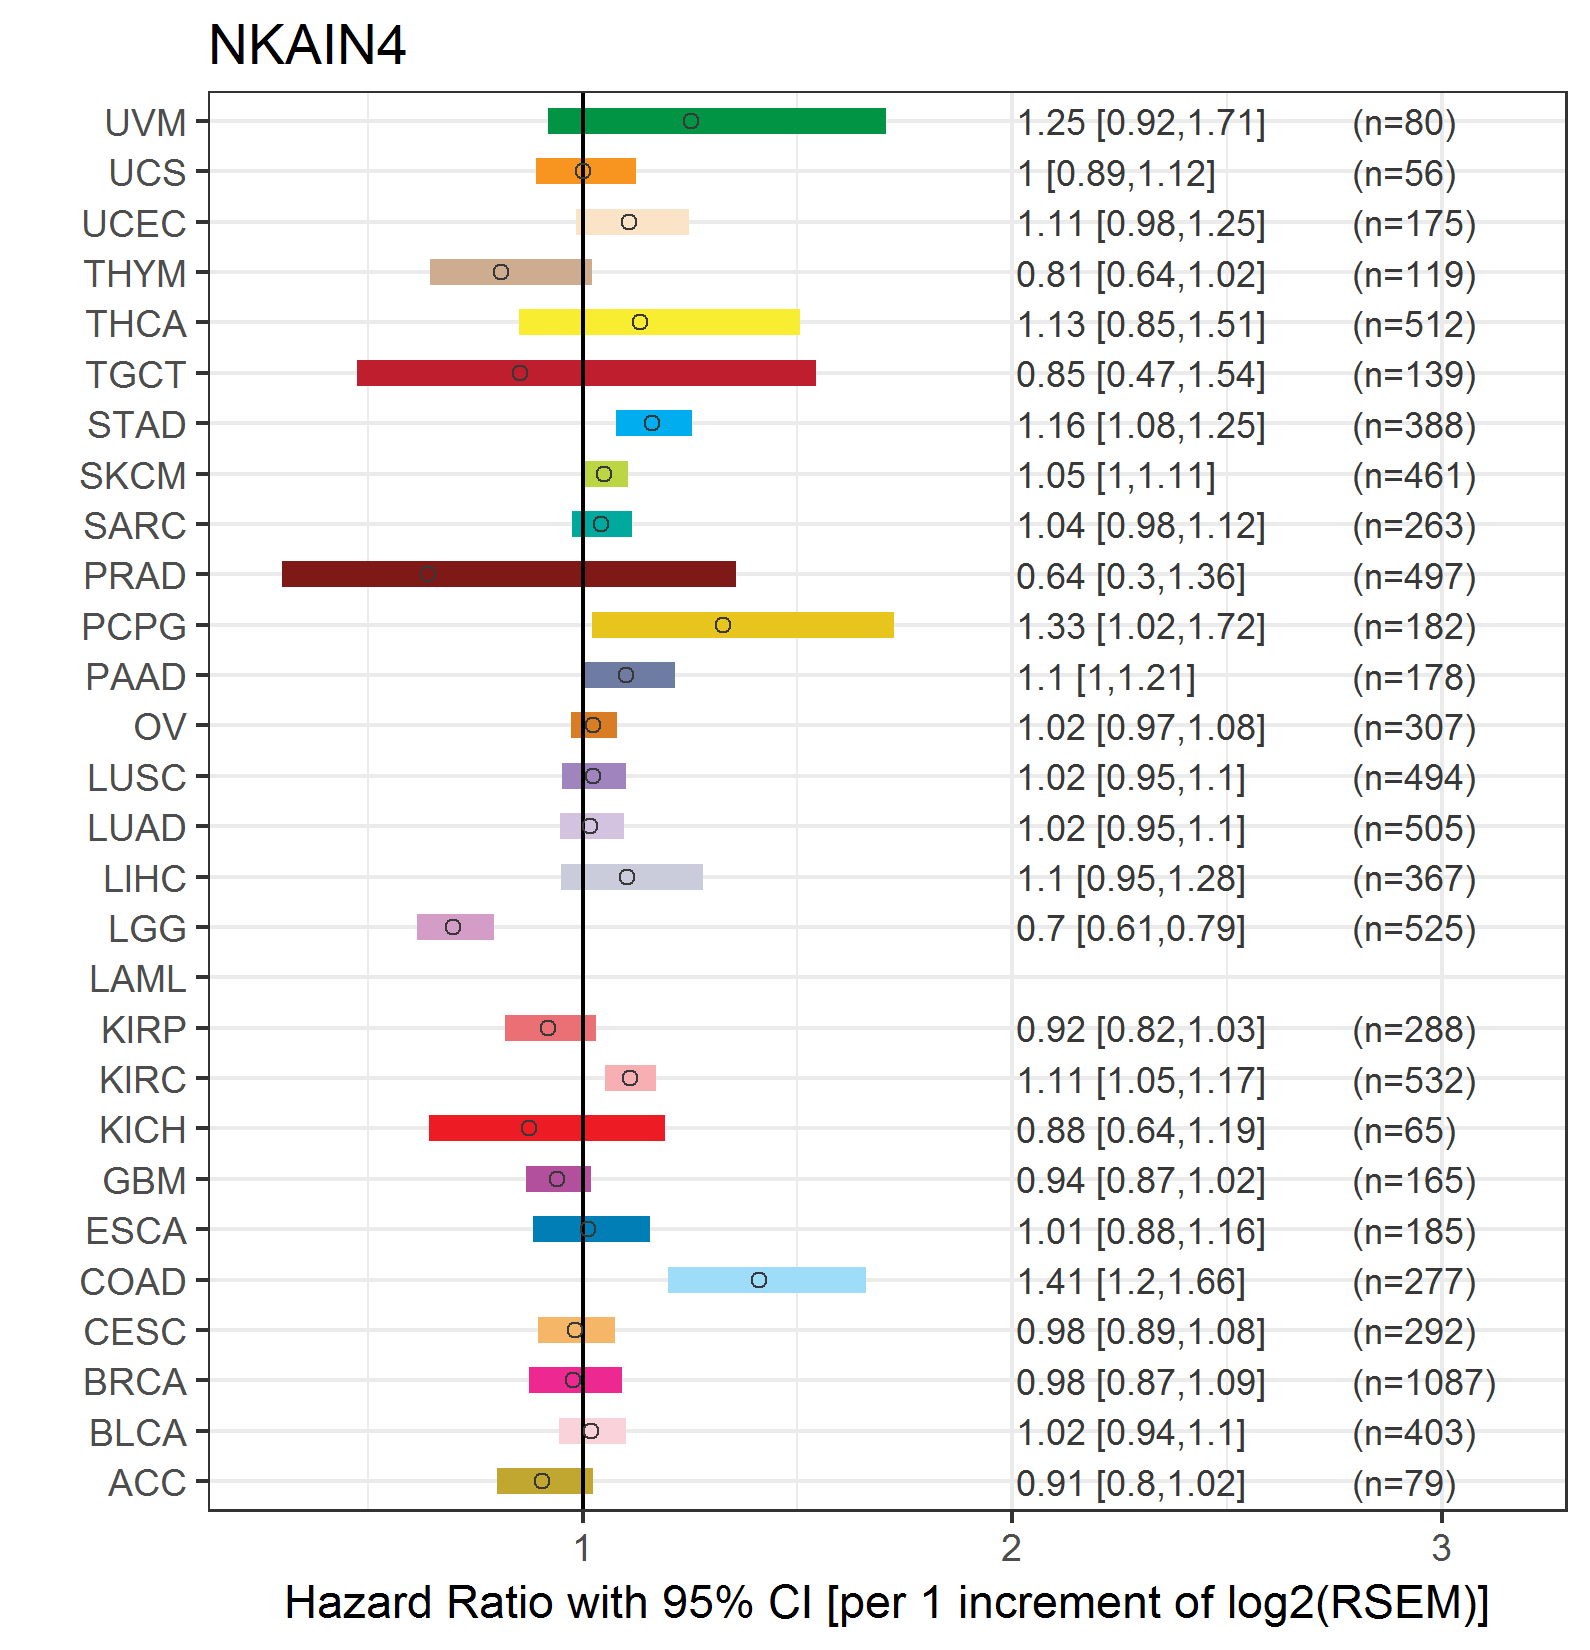
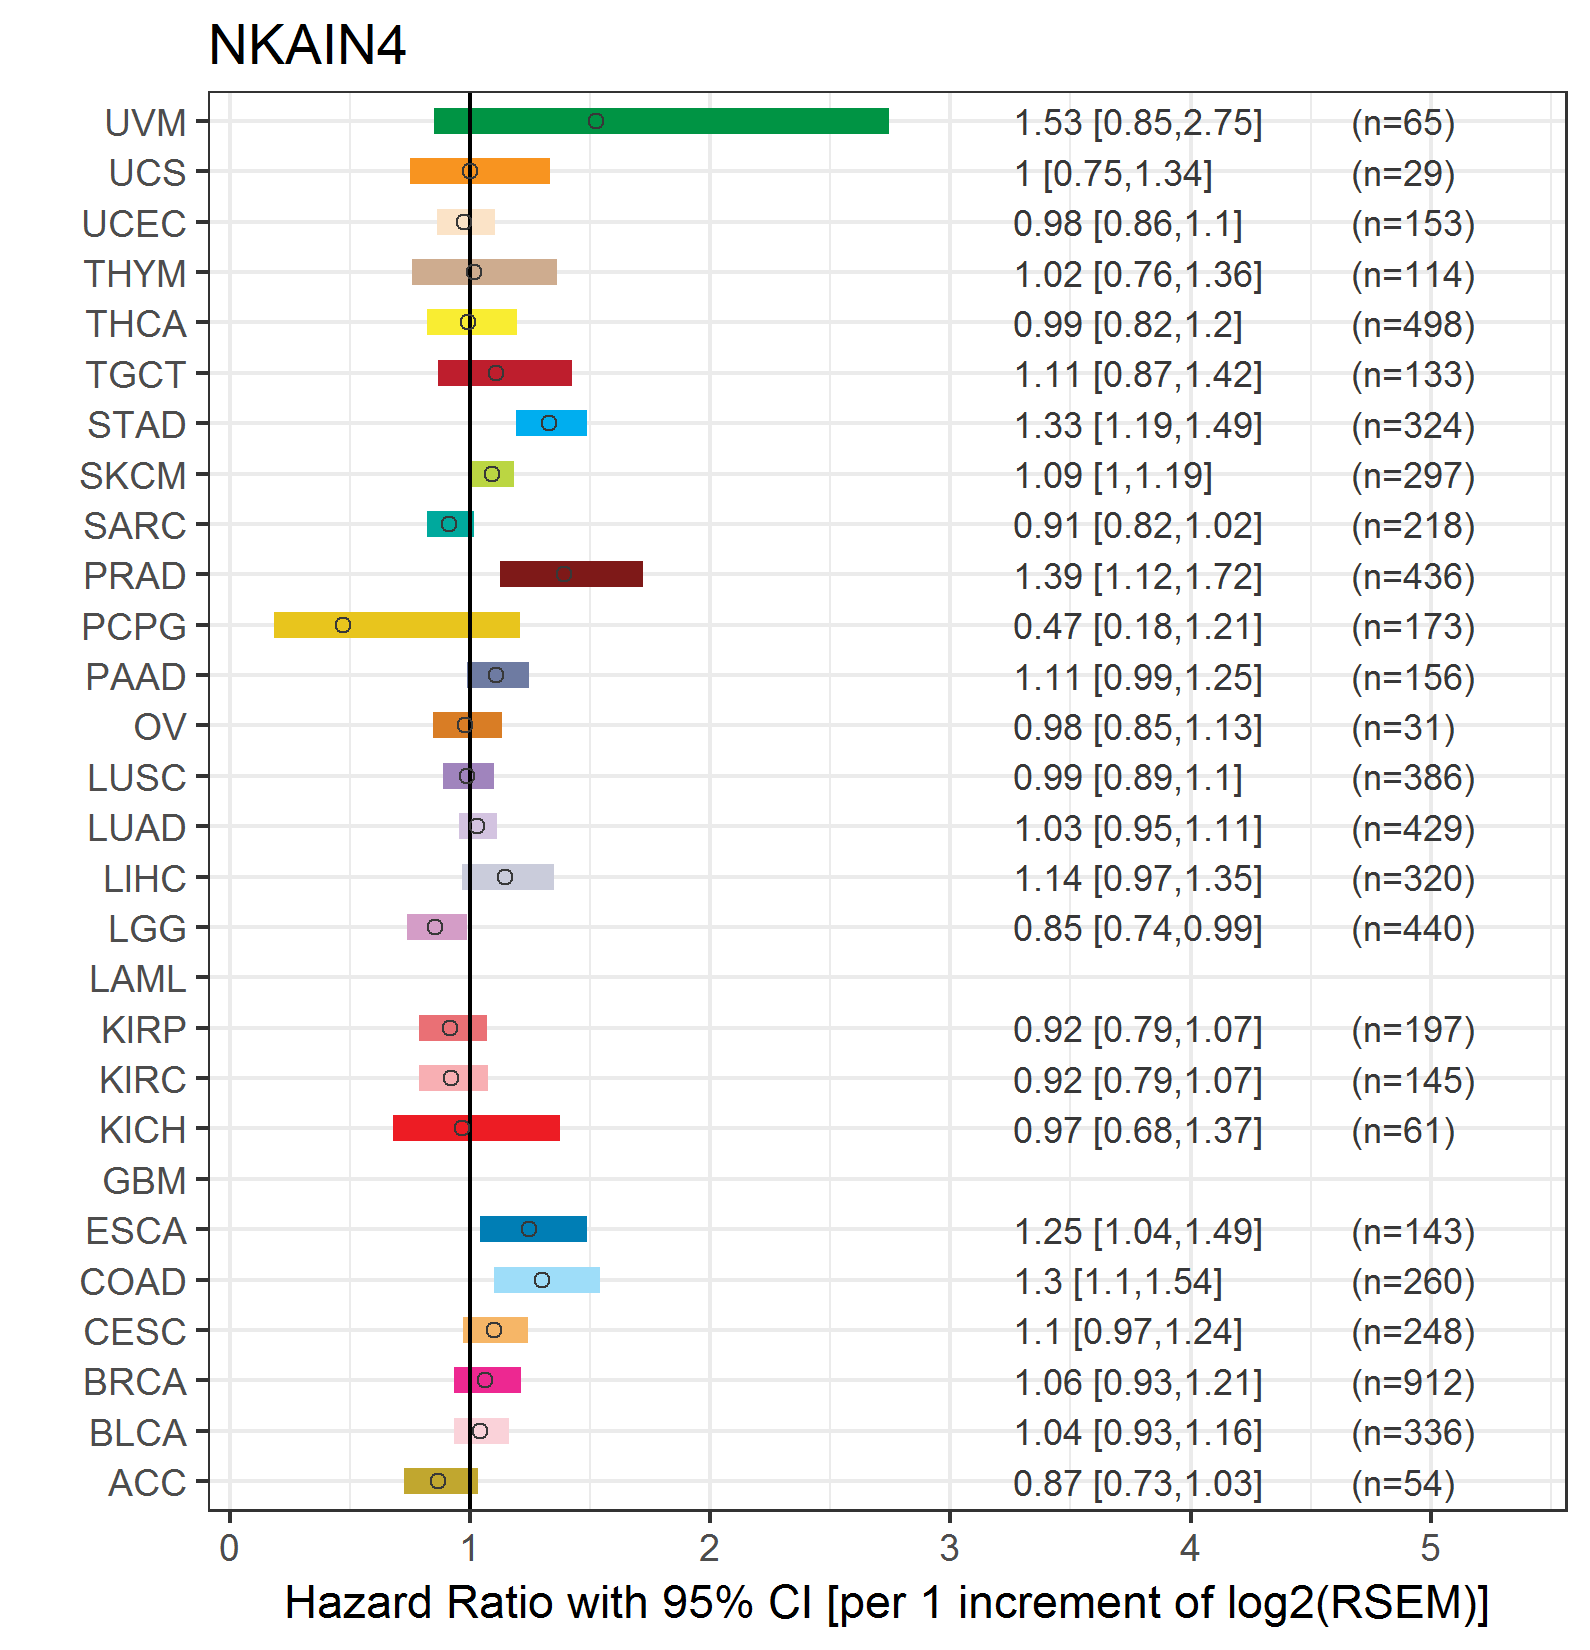
| Forest plot of Cox proportional hazard ratio (HR) and 95% CI of overall survival (OS) using 28 cancer types (TCGA IlluminaHiSeq_RNASeqV2, pan-cancer normalized log2(norm_counts+1) data, version 2016-08-16) (TCGA clinicalMatrix, phenotype data, version 2016-04-27) * Click on the image enlarge it in a new window. |
 |
| Forest plot of Cox proportional hazard ratio (HR) and 95% CI of relapse free survival (RFS) using 28 cancer types (TCGA IlluminaHiSeq_RNASeqV2, pan-cancer normalized log2(norm_counts+1) data, version 2016-08-16) (TCGA clinicalMatrix, phenotype data, version 2016-04-27) * Click on the image enlarge it in a new window. |
 |
| Top |
| TissGeneClin for NKAIN4 |
| TissGeneDrug for NKAIN4 |
| Drug information targeting TissGene (DrugBank Version 5.0.6, 2017-04-01) |
| DrugBank ID | Drug name | Drug activity | Drug type | Drug status |
| Top |
| TissGeneDisease for NKAIN4 |
| Disease information associated with TissGene (DisGeNet, 2016-06-01) |
| Disease ID | Disease name | # pubmeds | Source |
|
Copyright 2016-Present - The University of Texas Health Science Center at Houston (UTHealth) Web File Viewing | How to Report, Fraud, Waste and Abuse | State of Texas | Statewide Search | Texas Homeland Security | Site Policies |