 |
| |
| |
| |
| |
| |
| |
|

| TissGeneSummary for DUSP15 |
 Gene summary Gene summary |
| Basic gene information | Gene symbol | DUSP15 |
| Gene name | dual specificity phosphatase 15 | |
| Synonyms | VHY | |
| Cytomap | UCSC genome browser: 20q11.21 | |
| Type of gene | protein-coding | |
| RefGenes | NM_001012644.1, NM_080611.3,NM_177991.1, | |
| Description | VH1-related member Ydual specificity phosphatase-like 15dual specificity protein phosphatase 15vaccinia virus VH1-related dual-specific protein phosphatase Y | |
| Modification date | 20141207 | |
| dbXrefs | HGNC : HGNC | |
| Ensembl : ENSG00000149599 | ||
| HPRD : 13252 | ||
| Vega : OTTHUMG00000032182 | ||
| Protein | UniProt: go to UniProt's Cross Reference DB Table | |
| Expression | CleanEX: HS_DUSP15 | |
| BioGPS: 128853 | ||
| Pathway | NCI Pathway Interaction Database: DUSP15 | |
| KEGG: DUSP15 | ||
| REACTOME: DUSP15 | ||
| Pathway Commons: DUSP15 | ||
| Context | iHOP: DUSP15 | |
| ligand binding site mutation search in PubMed: DUSP15 | ||
| UCL Cancer Institute: DUSP15 | ||
| Assigned class in TissGDB* | C | |
| Included tissue-specific gene expression resources | TiGER,GTEx | |
| Specific-tissues in normal samples (assigned by TissGDB using HPA, TiGER, and GTEx) | Testis | |
| Cancer types related to the specific-tissues in cancer samples (assigned by TissGDB using TCGA) | TGCT | |
| Reference showing the relevant tissue of DUSP15 | ||
| Description by TissGene annotations | Cancer gene Fused withOncogene Fused withTSGene | |
| * Class A consists of genes with literature evidence and is part of the cTissGenes. Class B consists of only cTissGenes without additional evidence. The remaining genes belong to Class C. |
| Gene ontology having evidence of Inferred from Direct Assay (IDA) from Entrez |
| GO ID | GO term | PubMed ID |
| Top |
| TissGeneExp for DUSP15 |
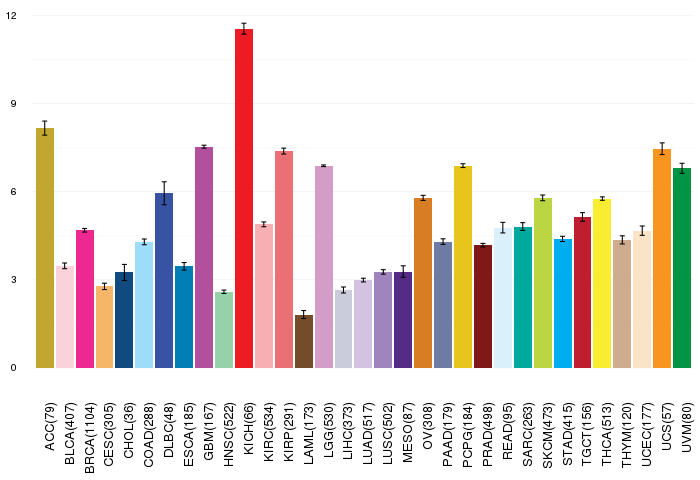
| Gene expressions across 28 cancer types (X-axis: cancer type and Y-axis: log2(norm_counts+1)) (TCGA IlluminaHiSeq_RNASeqV2, pan-cancer normalized log2(norm_counts+1) data, version 2016-08-16) |
 |
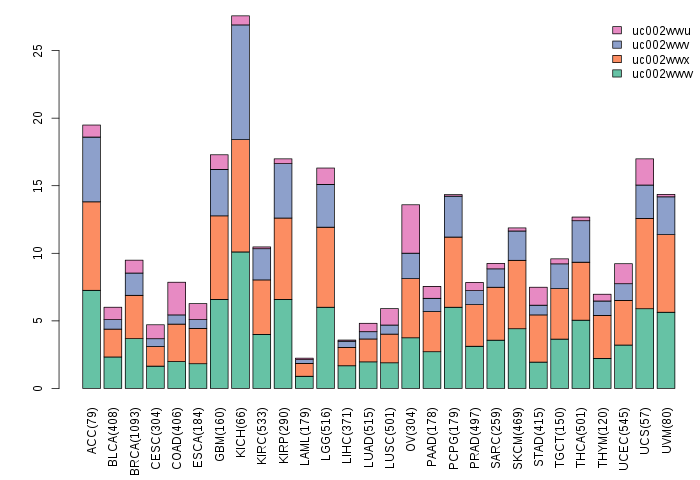
| Gene isoform expressions across 28 cancer types (X-axis: cancer type and Y-axis: log2(norm_counts+1)) (TCGA pan-cancer tcga_rsem_isoform_tpm, version 2016-09-01) |
 |
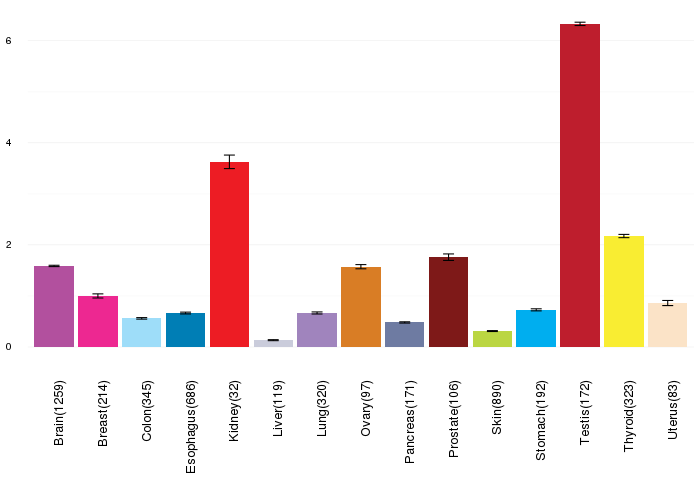
| Gene expressions across normal tissues of GTEx data (GTEx GTEx_Analysis_v6_RNA-seq_RNA-SeQCv1.1.8_gene_rpkm.gct) - Here, we shows the matched tissue types only among our 28 cancer types. |
 |
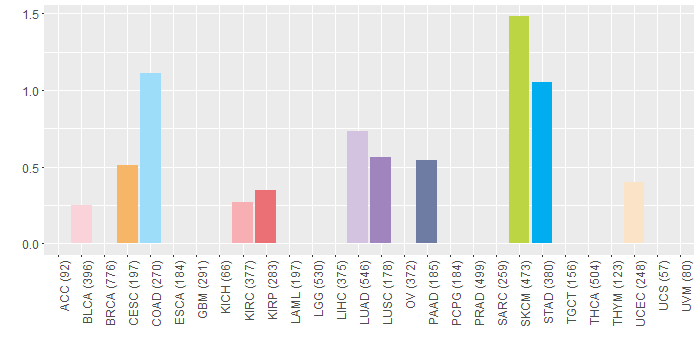
| Different expressions across 14 cancer types with more than 10 samples between matched tumors and normals (X-axis: cancer type and Y-axis: log2(norm_counts+1)) (TCGA IlluminaHiSeq_RNASeqV2, pan-cancer normalized log2(norm_counts+1) data, version 2016-08-16) |
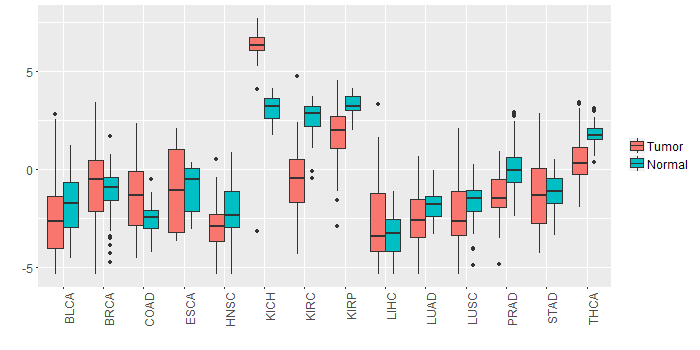 |
| - Significantly differentially expressed cancer types and information. (|Fold change|>1 and FDR<0.05) |
| Cancer type | Mean(exp) in tumor | Mean(exp) in matched normal | Log2FC | P-val. | FDR |
| KIRP | 1.710704357 | 3.217273107 | -1.50656875 | 1.13E-05 | 4.67E-05 |
| THCA | 0.571617016 | 1.798525491 | -1.226908475 | 7.29E-10 | 4.29E-09 |
| PRAD | -1.352268479 | 0.096454598 | -1.448723077 | 2.57E-08 | 2.82E-07 |
| KIRC | -0.555800851 | 2.652789427 | -3.208590278 | 8.58E-28 | 1.34E-26 |
| KICH | 5.947274982 | 3.097530982 | 2.849744 | 2.59E-07 | 1.09E-06 |
| COAD | -1.351185787 | -2.508035787 | 1.15685 | 0.00507 | 0.012166889 |
| Top |
| TissGene-miRNA for DUSP15 |
| Significantly anti-correlated miRNAs of TissGene across 28 cancer types (Gene-miRNA relations from TargetScanHuman Relsease 7.1, Conserved_Site_Context_Scores.txt.zip, 06.01.2016) (TCGA IlluminaHiSeq_miRNASeq, log2(RPM+1) data, version 2016-11-21) (TCGA IlluminaHiSeq_RNASeqV2, log2(normalized_count+1) data, version 2016-08-16) (Spearman’s Rank Correlation (p-value<0.05 and coefficient<-0.25)) |
| Cancer type | miRNA id | miRNA accession | P-val. | Coeff. | # samples |
| ACC | hsa-miR-506-3p | MIMAT0002878 | 0.02 | -0.28 | 78 |
| ACC | hsa-miR-506-3p | MIMAT0002878 | 0.02 | -0.28 | 78 |
| Top |
| TissGeneMut for DUSP15 |
| TissGeneSNV for DUSP15 |
| nsSNV counts per each loci. Different colors of circles represent different cancer types. Circle size denotes number of samples. (TCGA somatic mutation (SNPs and small INDELs) data, version 2016-04-25) * Click on the image to enlarge it in a new window. |
 |
 |
| Somatic nucleotide variants of TissGene across 28 cancer types (X-axis: cancer type and Y-axis: % of mutated samples) The numbers in parentheses are numbers of samples with mutation (nsSNVs). (TCGA somatic mutation (SNPs and small INDELs) data, version 2016-04-25) |
 |
| - nsSNVs sorted by frequency. |
| AAchange | Cancer type | # samples |
| p.E236K | SKCM | 2 |
| p.P269A | LUAD | 1 |
| p.G27C | COAD | 1 |
| p.A122T | BLCA | 1 |
| p.Q155R | KIRC | 1 |
| p.A53T | PAAD | 1 |
| p.V94L | COAD | 1 |
| p.Q141P | LUAD | 1 |
| p.N125D | LUSC | 1 |
| p.S252L | SKCM | 1 |
| p.H72Y | SKCM | 1 |
| p.R295C | STAD | 1 |
| p.Q131* | STAD | 1 |
| p.N80I | LUAD | 1 |
| p.A56V | COAD | 1 |
| p.V94L | READ | 1 |
| p.V94L | KIRP | 1 |
| p.L62W | SKCM | 1 |
| p.Q134X | STAD | 1 |
| p.R52C | STAD | 1 |
| p.S292P | STAD | 1 |
| p.E3K | SKCM | 1 |
| p.G79R | SKCM | 1 |
| p.E236K | HNSC | 1 |
| p.R262C | CESC | 1 |
| p.R49C | STAD | 1 |
| p.H75Y | SKCM | 1 |
| p.H66Q | UCEC | 1 |
| p.D227E | LUAD | 1 |
| p.A289T | PAAD | 1 |
| Top |
| TissGeneCNV for DUSP15 |
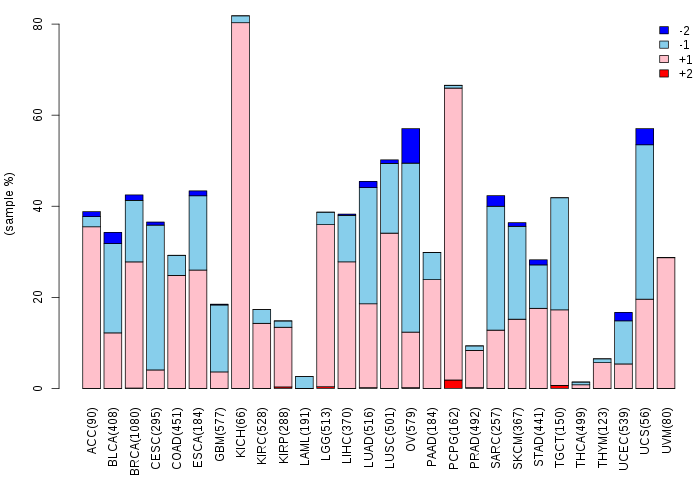
| Copy number variations of TissGene across 28 cancer types (X-axis: cancer type and Y-axis: % of CNV samples) (TCGA Gistic2_CopyNumber_Gistic2_all_data_by_genes, Gistic2 copy number data, version 2016-08-16) |
 |
| Top |
| TissGeneFusions for DUSP15 |
| Fusion genes including TissGene (ChimerDB 3.0, 2016-12-01 and TCGA fusion Portal 2015-12-01) |
| Database | Src | Cancer type | Sample | Fusion gene | ORF | 5'-gene BP | 3'-gene BP |
| TCGAfusionPortal | PRADA | BLCA | TCGA-DK-A3IS-01A | NCOA3-DUSP15 | 5UTR-5UTR | Chr20:46130763 | Chr20:30454956 |
| TCGAfusionPortal | PRADA | BLCA | TCGA-K4-A3WS-01A | DNMT3B-DUSP15 | CDS-5UTR | Chr20:31376818 | Chr20:30457400 |
| TCGAfusionPortal | PRADA | HNSC | TCGA-CV-7421-01A | TPX2-DUSP15 | Out-of-frame | Chr20:30347982 | Chr20:30438479 |
| Top |
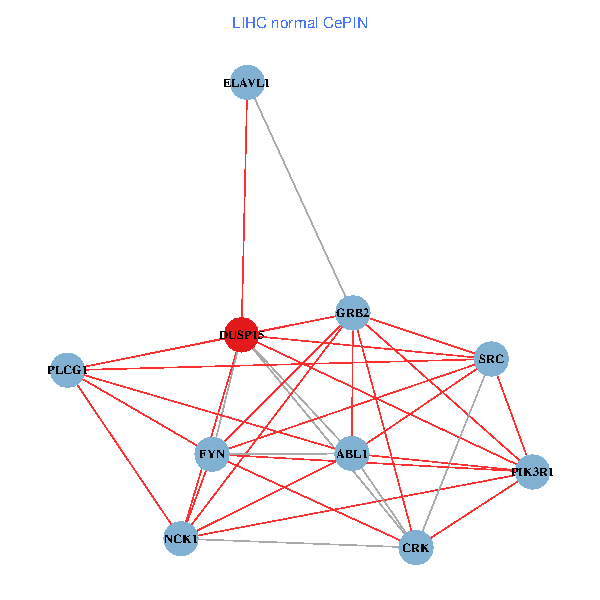
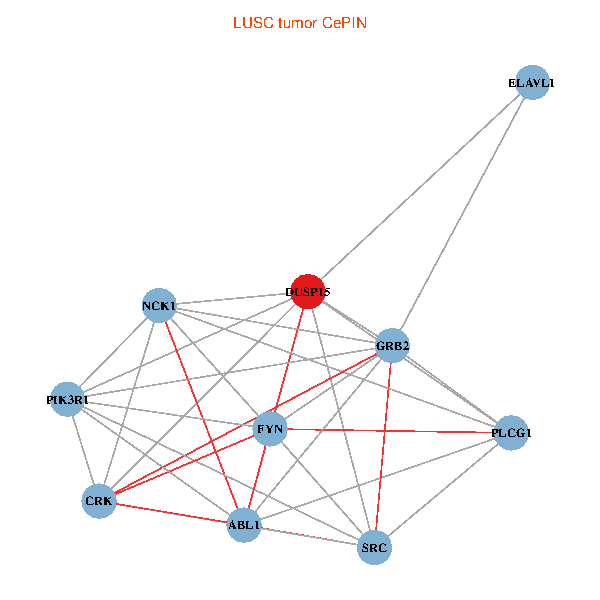
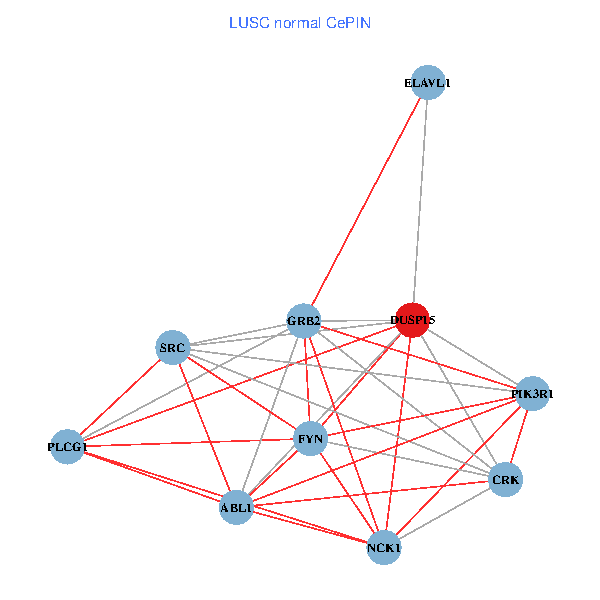
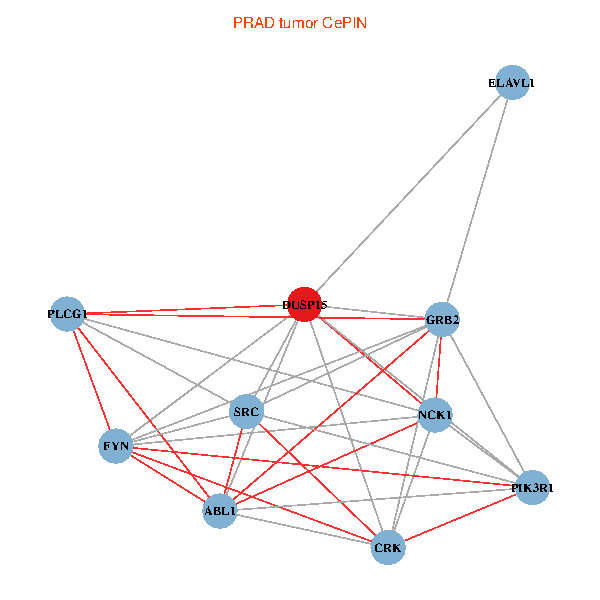
| TissGeneNet for DUSP15 |
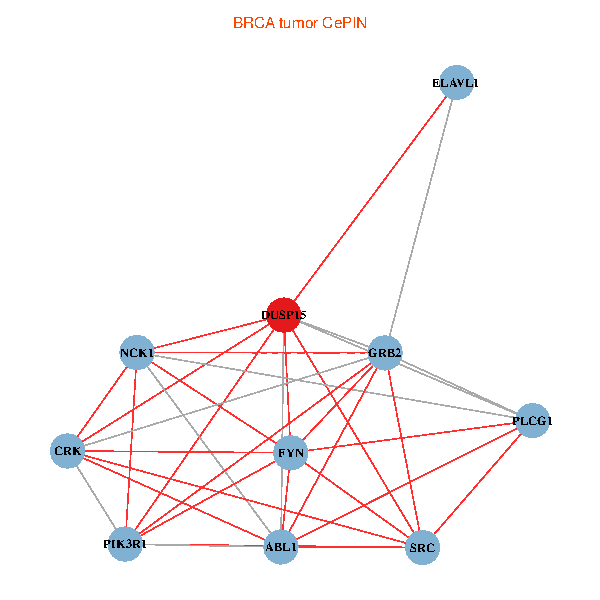
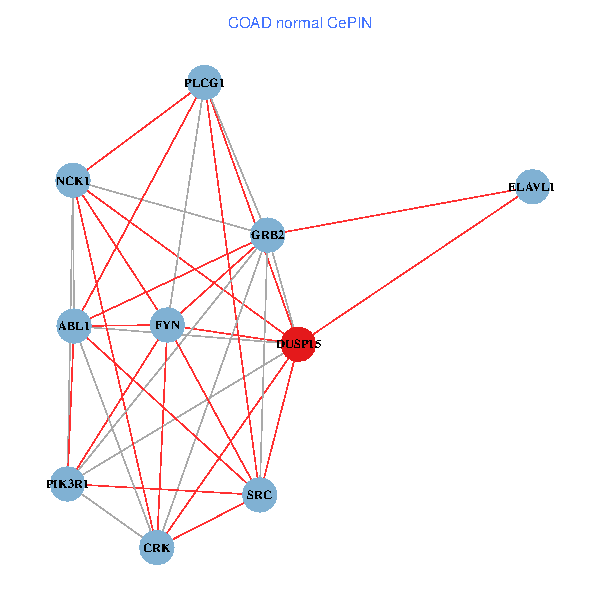
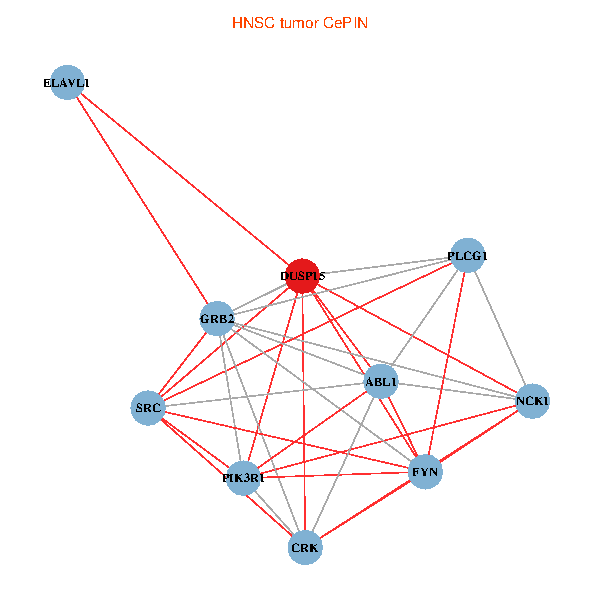
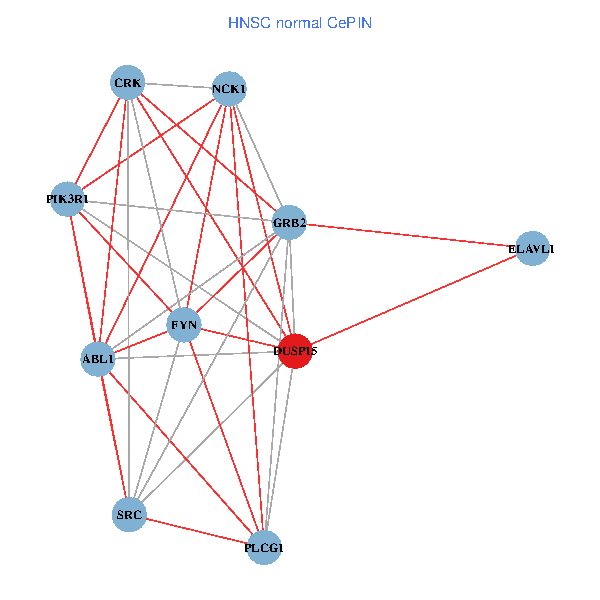
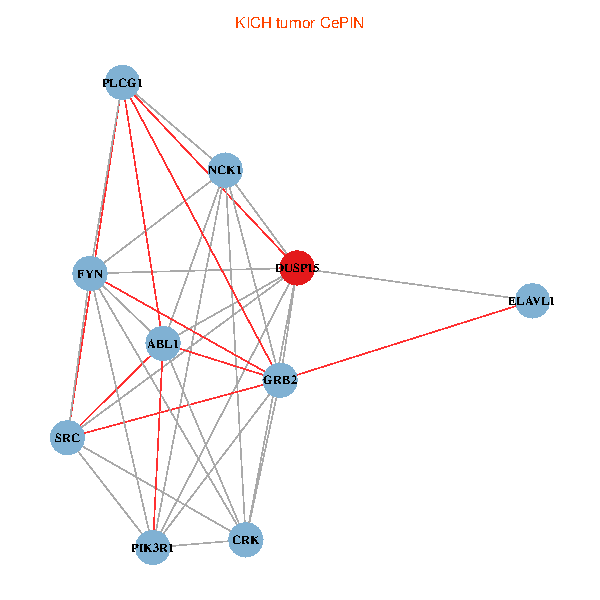
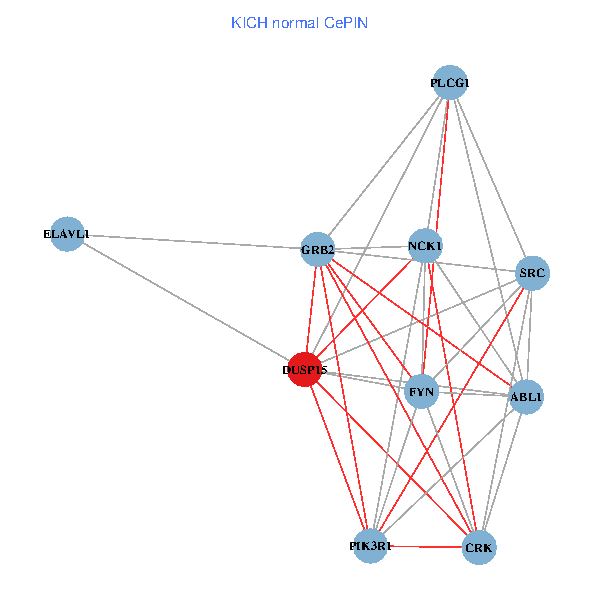
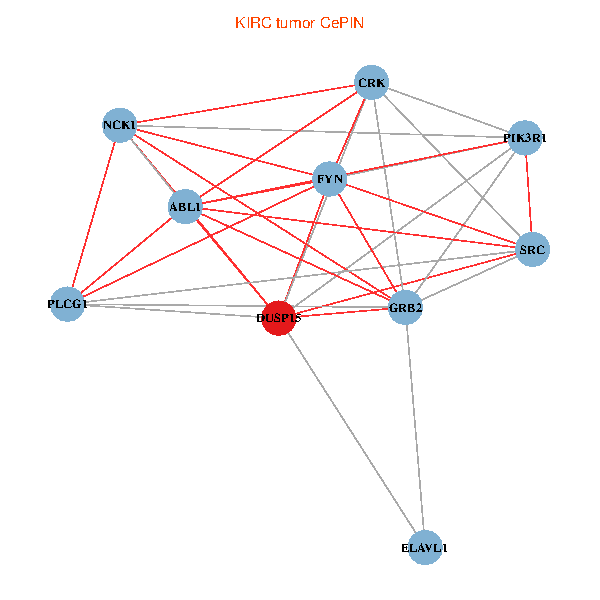
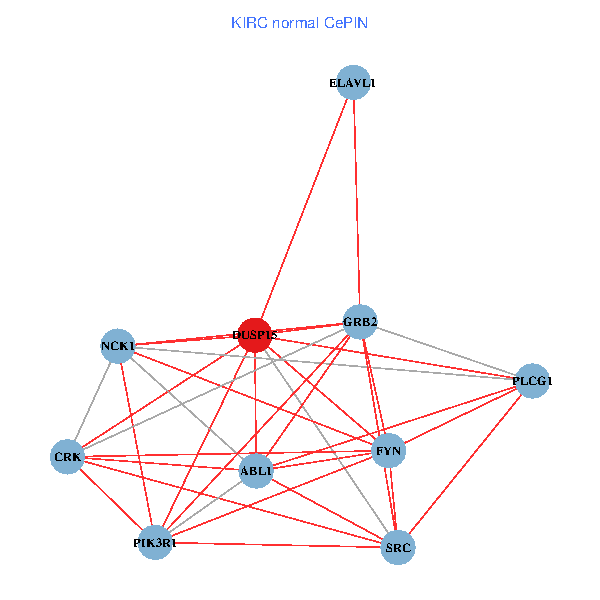
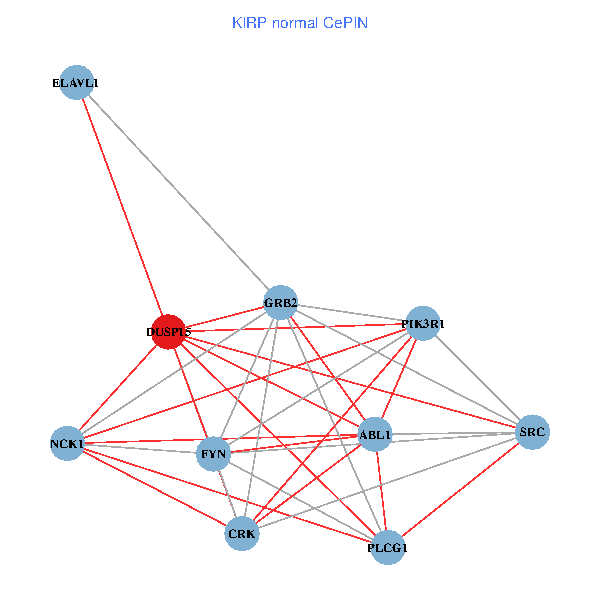
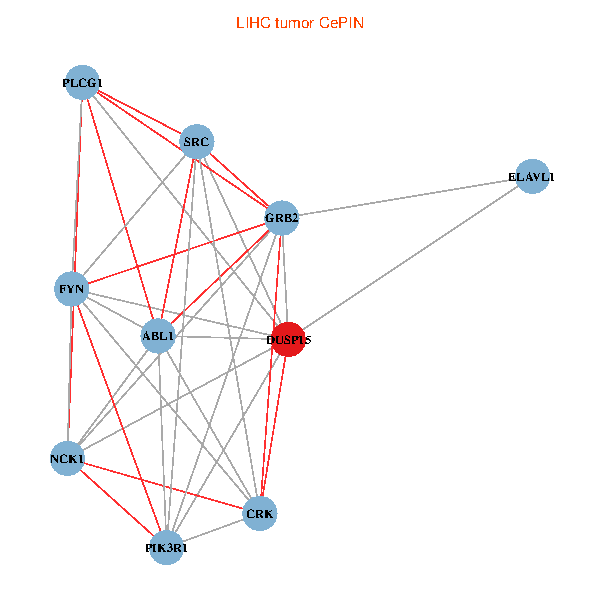
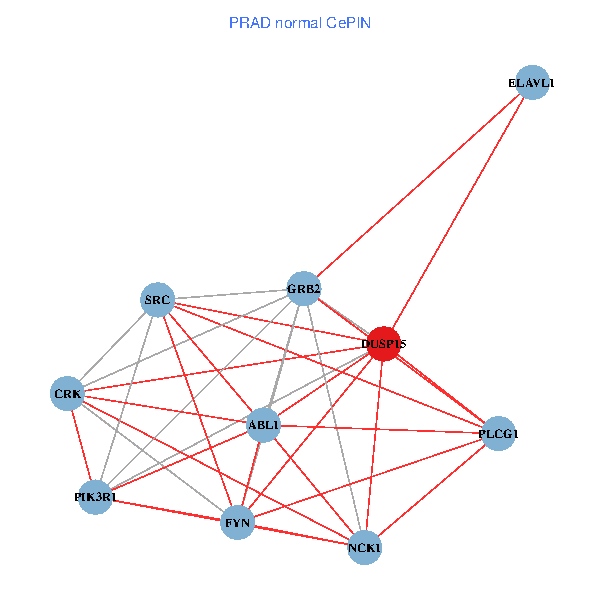
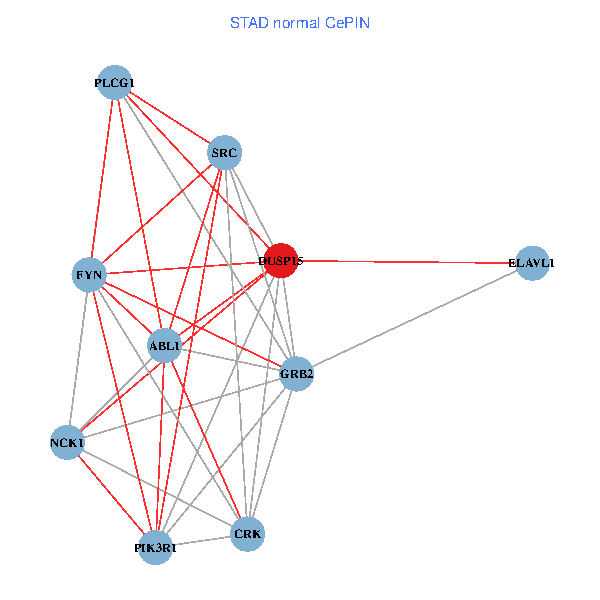
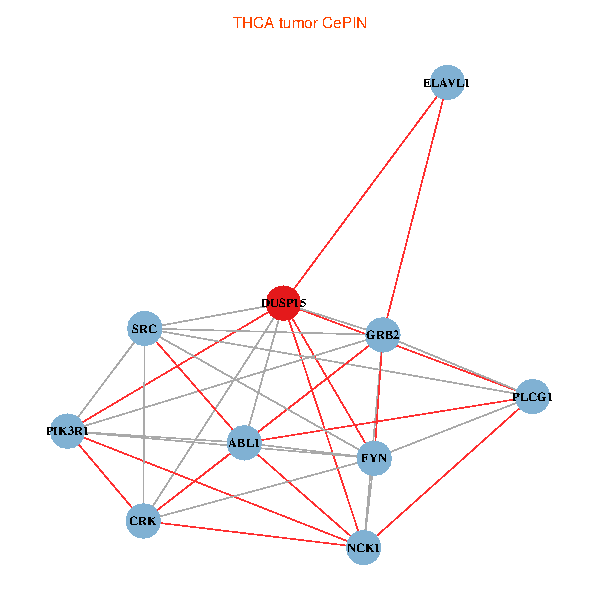
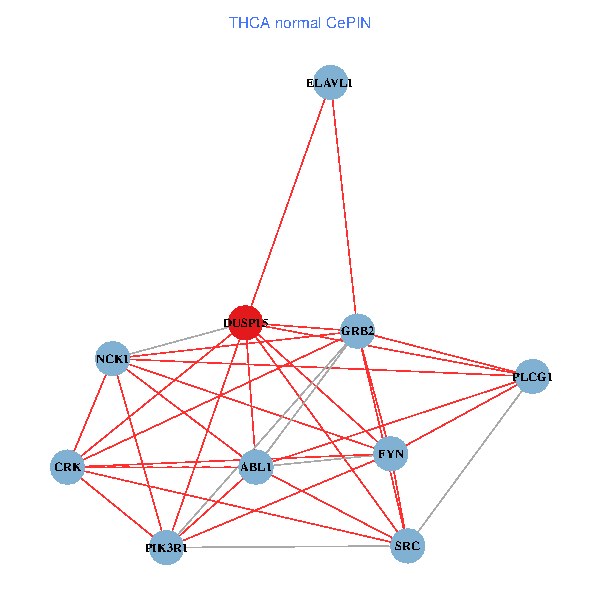
| Co-expressed gene networks based on protein-protein interaction data (CePIN) (TCGA IlluminaHiSeq_RNASeqV2, pan-cancer normalized log2(norm_counts+1) data, version 2016-08-16) (PINA2 ppi data) |
| BRCA (tumor) | BRCA (normal) |
| DUSP15, NCK1, ELAVL1, PLCG1, GRB2, SRC, FYN, PIK3R1, ABL1, CRK (tumor) | DUSP15, NCK1, ELAVL1, PLCG1, GRB2, SRC, FYN, PIK3R1, ABL1, CRK (normal) |
 |  |
| COAD (tumor) | COAD (normal) |
| DUSP15, NCK1, ELAVL1, PLCG1, GRB2, SRC, FYN, PIK3R1, ABL1, CRK (tumor) | DUSP15, NCK1, ELAVL1, PLCG1, GRB2, SRC, FYN, PIK3R1, ABL1, CRK (normal) |
 |  |
| HNSC (tumor) | HNSC (normal) |
| DUSP15, NCK1, ELAVL1, PLCG1, GRB2, SRC, FYN, PIK3R1, ABL1, CRK (tumor) | DUSP15, NCK1, ELAVL1, PLCG1, GRB2, SRC, FYN, PIK3R1, ABL1, CRK (normal) |
 |  |
| KICH (tumor) | KICH (normal) |
| DUSP15, NCK1, ELAVL1, PLCG1, GRB2, SRC, FYN, PIK3R1, ABL1, CRK (tumor) | DUSP15, NCK1, ELAVL1, PLCG1, GRB2, SRC, FYN, PIK3R1, ABL1, CRK (normal) |
 |  |
| KIRC (tumor) | KIRC (normal) |
| DUSP15, NCK1, ELAVL1, PLCG1, GRB2, SRC, FYN, PIK3R1, ABL1, CRK (tumor) | DUSP15, NCK1, ELAVL1, PLCG1, GRB2, SRC, FYN, PIK3R1, ABL1, CRK (normal) |
 |  |
| KIRP (tumor) | KIRP (normal) |
| DUSP15, NCK1, ELAVL1, PLCG1, GRB2, SRC, FYN, PIK3R1, ABL1, CRK (tumor) | DUSP15, NCK1, ELAVL1, PLCG1, GRB2, SRC, FYN, PIK3R1, ABL1, CRK (normal) |
 |  |
| LIHC (tumor) | LIHC (normal) |
| DUSP15, NCK1, ELAVL1, PLCG1, GRB2, SRC, FYN, PIK3R1, ABL1, CRK (tumor) | DUSP15, NCK1, ELAVL1, PLCG1, GRB2, SRC, FYN, PIK3R1, ABL1, CRK (normal) |
 |  |
| LUAD (tumor) | LUAD (normal) |
| DUSP15, NCK1, ELAVL1, PLCG1, GRB2, SRC, FYN, PIK3R1, ABL1, CRK (tumor) | DUSP15, NCK1, ELAVL1, PLCG1, GRB2, SRC, FYN, PIK3R1, ABL1, CRK (normal) |
 |  |
| LUSC (tumor) | LUSC (normal) |
| DUSP15, NCK1, ELAVL1, PLCG1, GRB2, SRC, FYN, PIK3R1, ABL1, CRK (tumor) | DUSP15, NCK1, ELAVL1, PLCG1, GRB2, SRC, FYN, PIK3R1, ABL1, CRK (normal) |
 |  |
| PRAD (tumor) | PRAD (normal) |
| DUSP15, NCK1, ELAVL1, PLCG1, GRB2, SRC, FYN, PIK3R1, ABL1, CRK (tumor) | DUSP15, NCK1, ELAVL1, PLCG1, GRB2, SRC, FYN, PIK3R1, ABL1, CRK (normal) |
 |  |
| STAD (tumor) | STAD (normal) |
| DUSP15, NCK1, ELAVL1, PLCG1, GRB2, SRC, FYN, PIK3R1, ABL1, CRK (tumor) | DUSP15, NCK1, ELAVL1, PLCG1, GRB2, SRC, FYN, PIK3R1, ABL1, CRK (normal) |
 |  |
| THCA (tumor) | THCA (normal) |
| DUSP15, NCK1, ELAVL1, PLCG1, GRB2, SRC, FYN, PIK3R1, ABL1, CRK (tumor) | DUSP15, NCK1, ELAVL1, PLCG1, GRB2, SRC, FYN, PIK3R1, ABL1, CRK (normal) |
 |  |
| Top |
| TissGeneProg for DUSP15 |
| Kaplan-Meier plots with logrank tests of overall survival (OS) using 28 cancer types (TCGA IlluminaHiSeq_RNASeqV2, pan-cancer normalized log2(norm_counts+1) data, version 2016-08-16) (TCGA clinicalMatrix, phenotype data, version 2016-04-27) * Click on the image to enlarge it in a new window. |
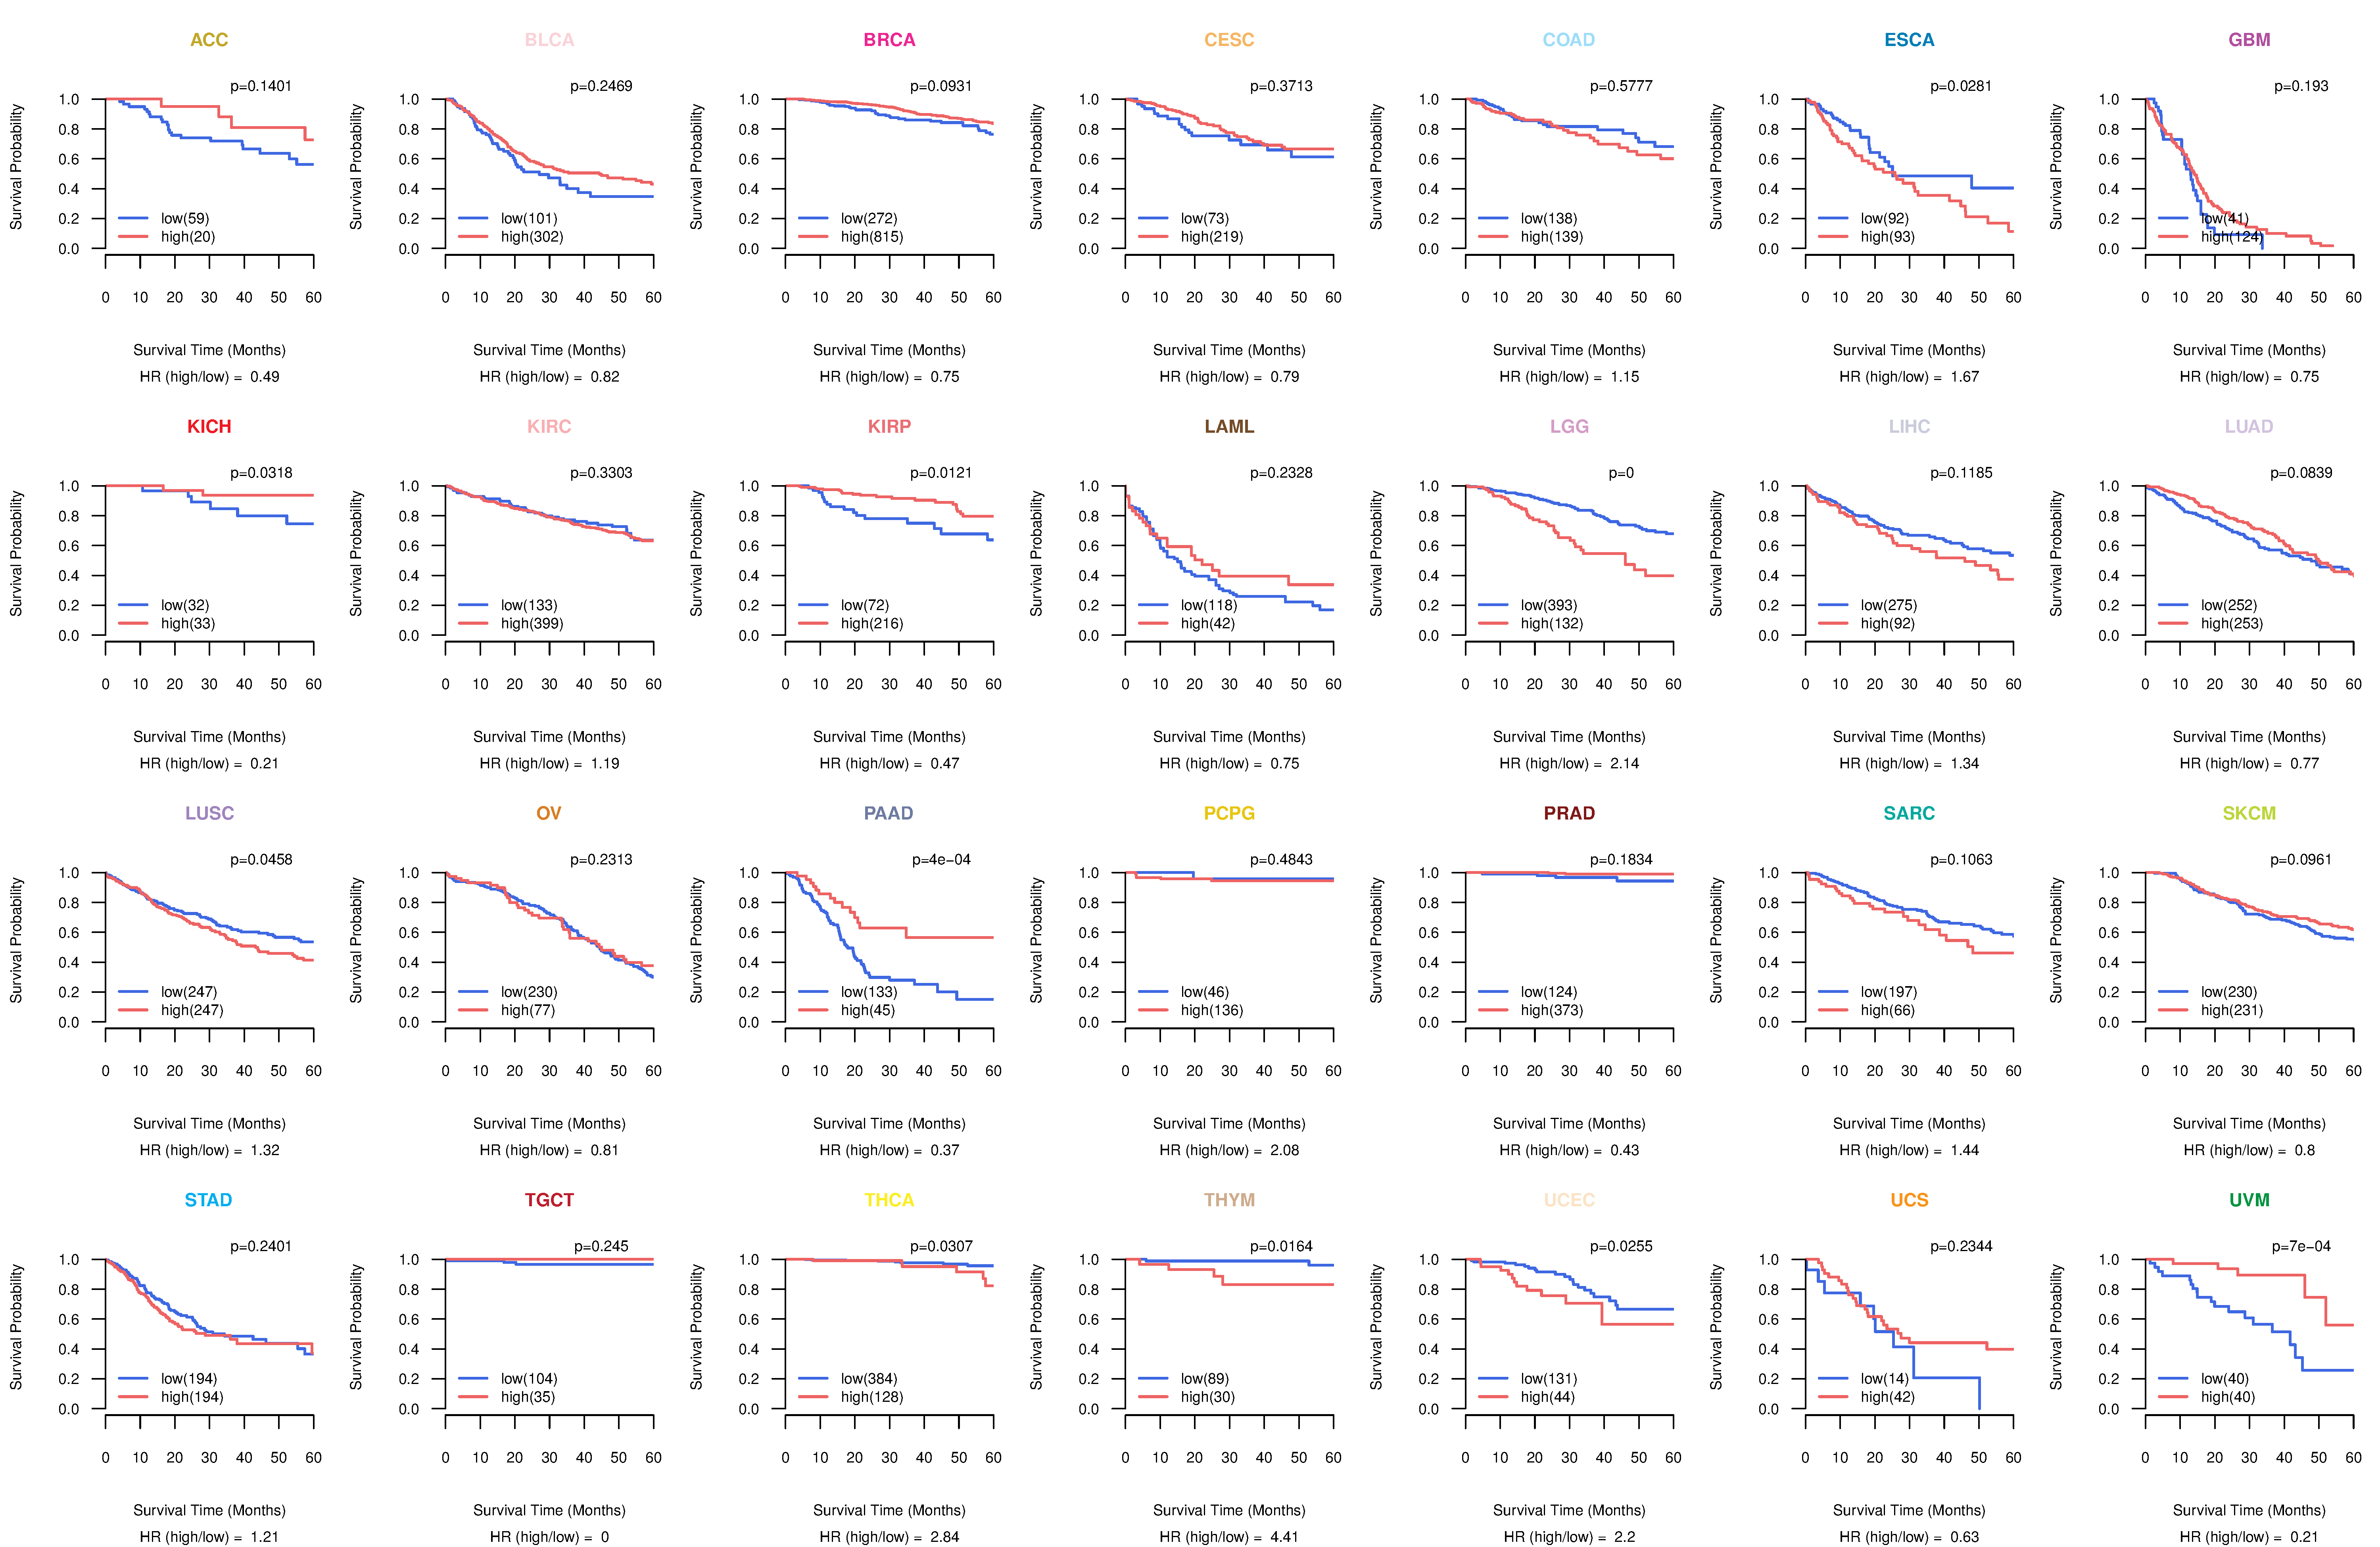 |
| Kaplan-Meier plots with logrank test of relapse free survival (RFS) using 28 cancer types (TCGA IlluminaHiSeq_RNASeqV2, pan-cancer normalized log2(norm_counts+1) data, version 2016-08-16) (TCGA clinicalMatrix, phenotype data, version 2016-04-27) * Click on the image enlarge it in a new window. |
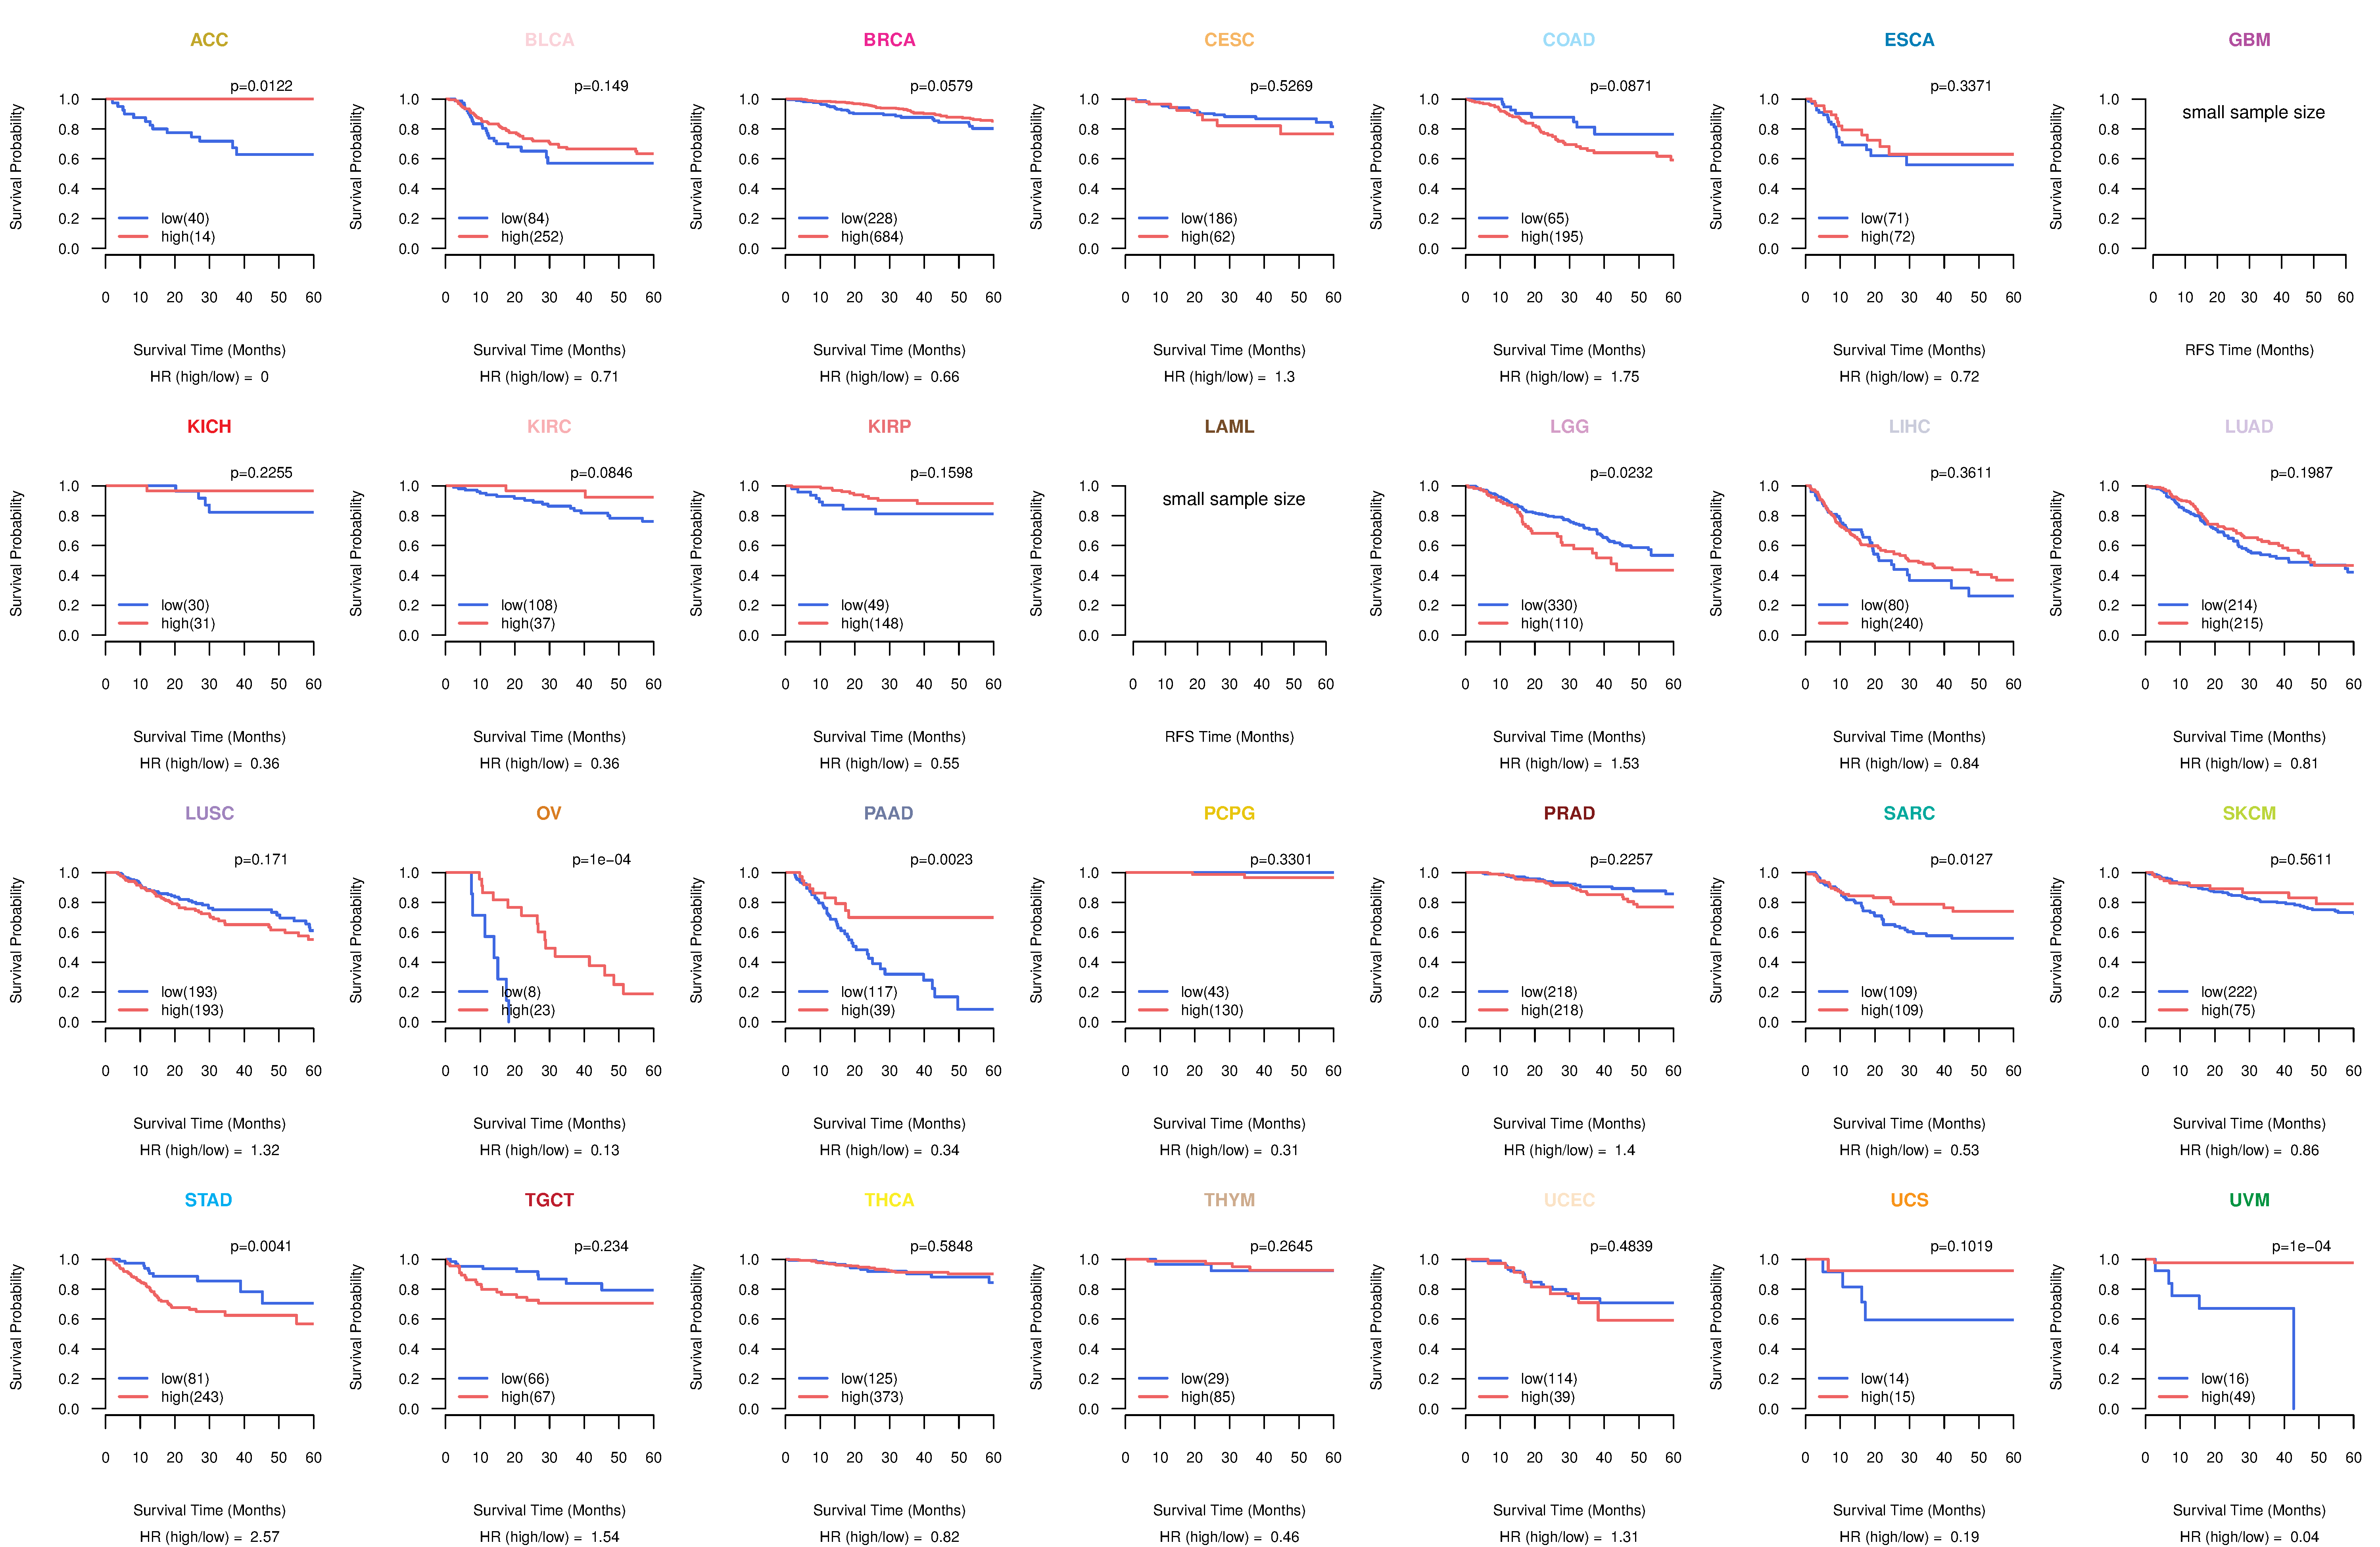 |
| Forest plot of Cox proportional hazard ratio (HR) and 95% CI of overall survival (OS) using 28 cancer types (TCGA IlluminaHiSeq_RNASeqV2, pan-cancer normalized log2(norm_counts+1) data, version 2016-08-16) (TCGA clinicalMatrix, phenotype data, version 2016-04-27) * Click on the image enlarge it in a new window. |
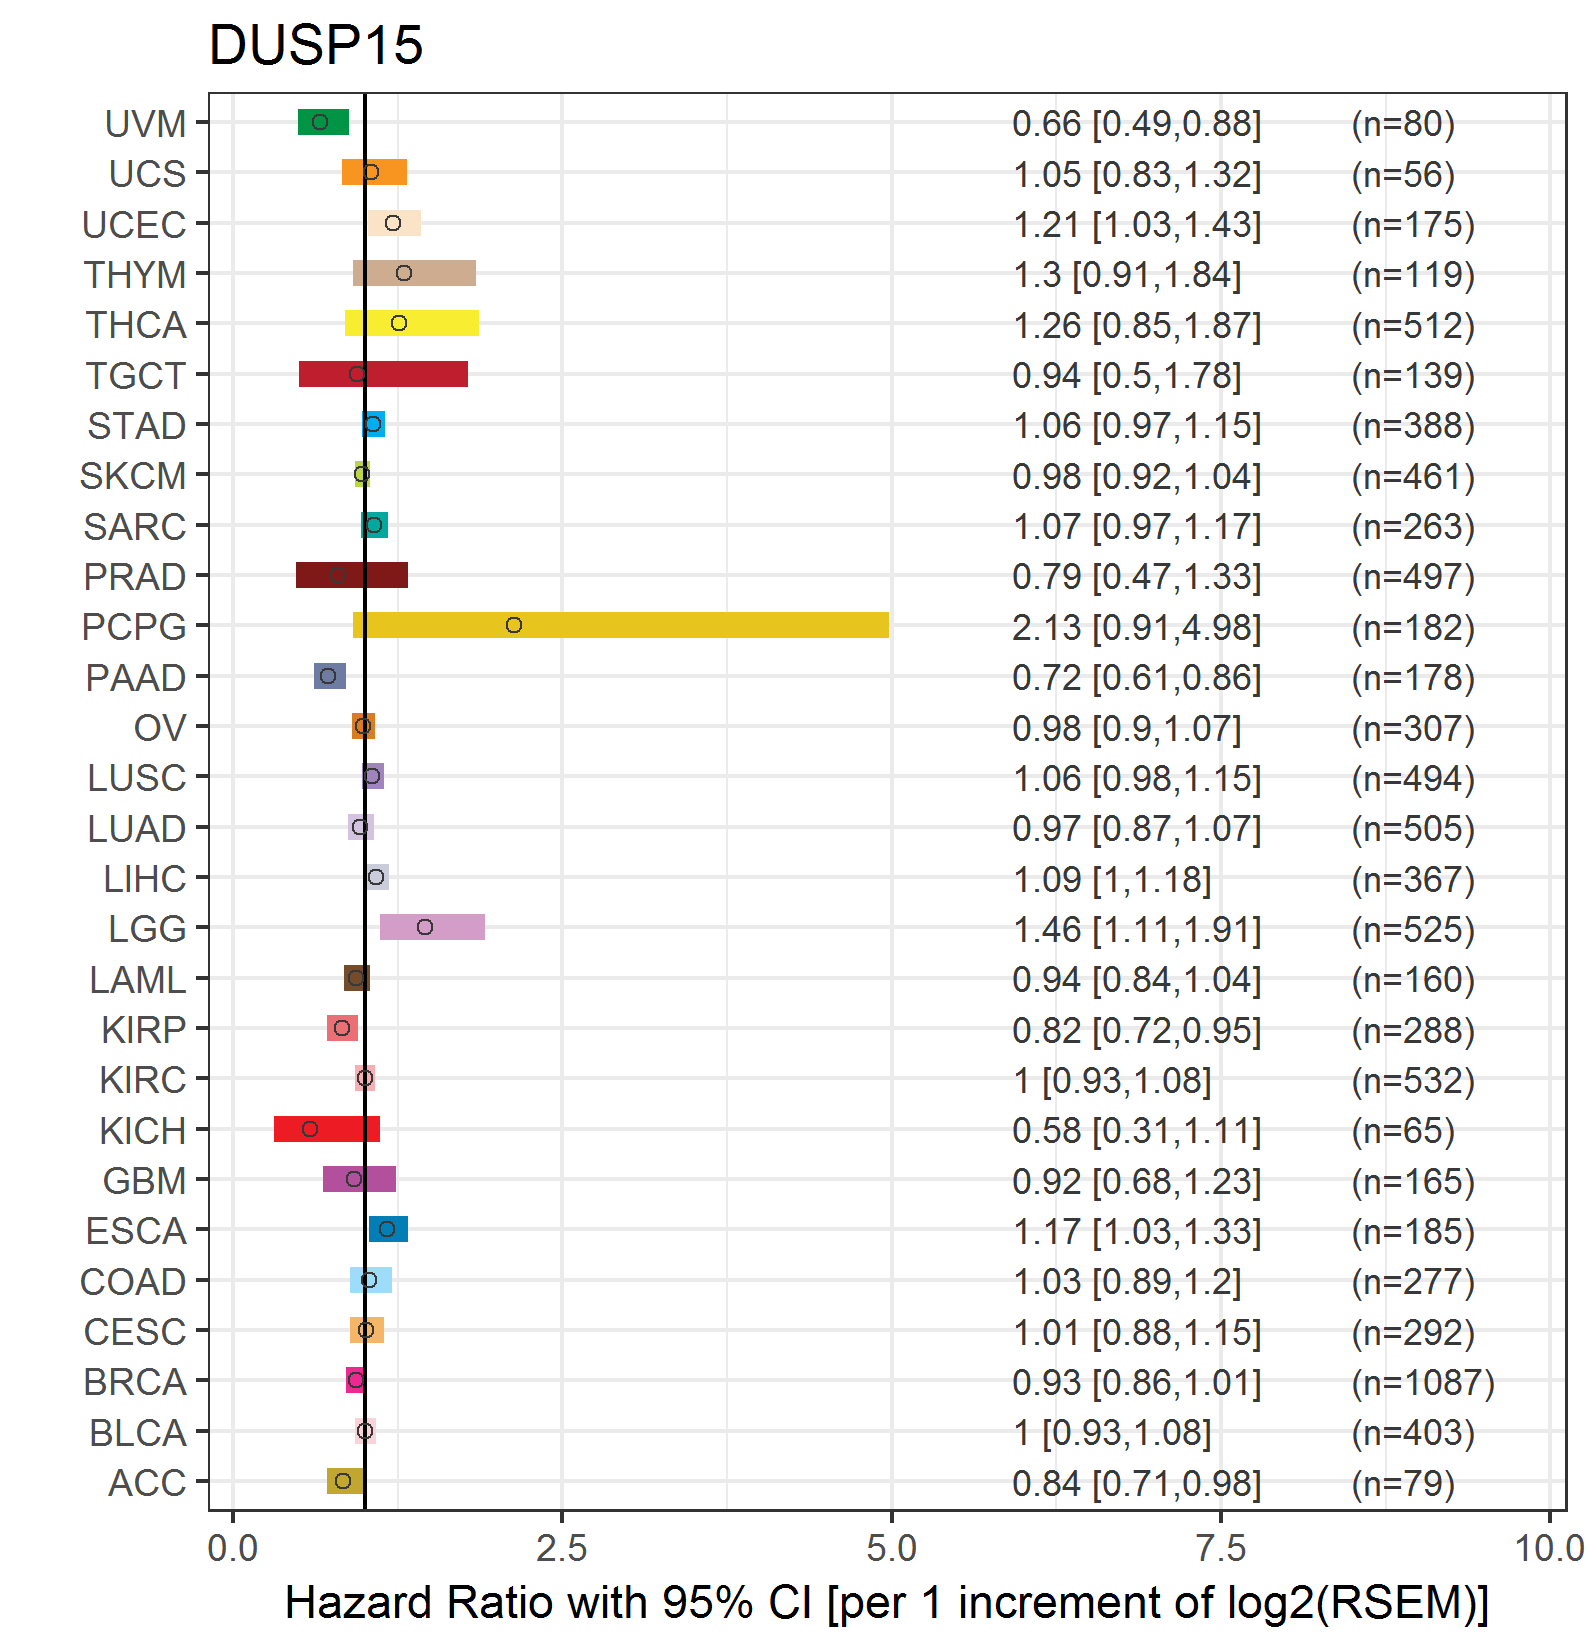 |
| Forest plot of Cox proportional hazard ratio (HR) and 95% CI of relapse free survival (RFS) using 28 cancer types (TCGA IlluminaHiSeq_RNASeqV2, pan-cancer normalized log2(norm_counts+1) data, version 2016-08-16) (TCGA clinicalMatrix, phenotype data, version 2016-04-27) * Click on the image enlarge it in a new window. |
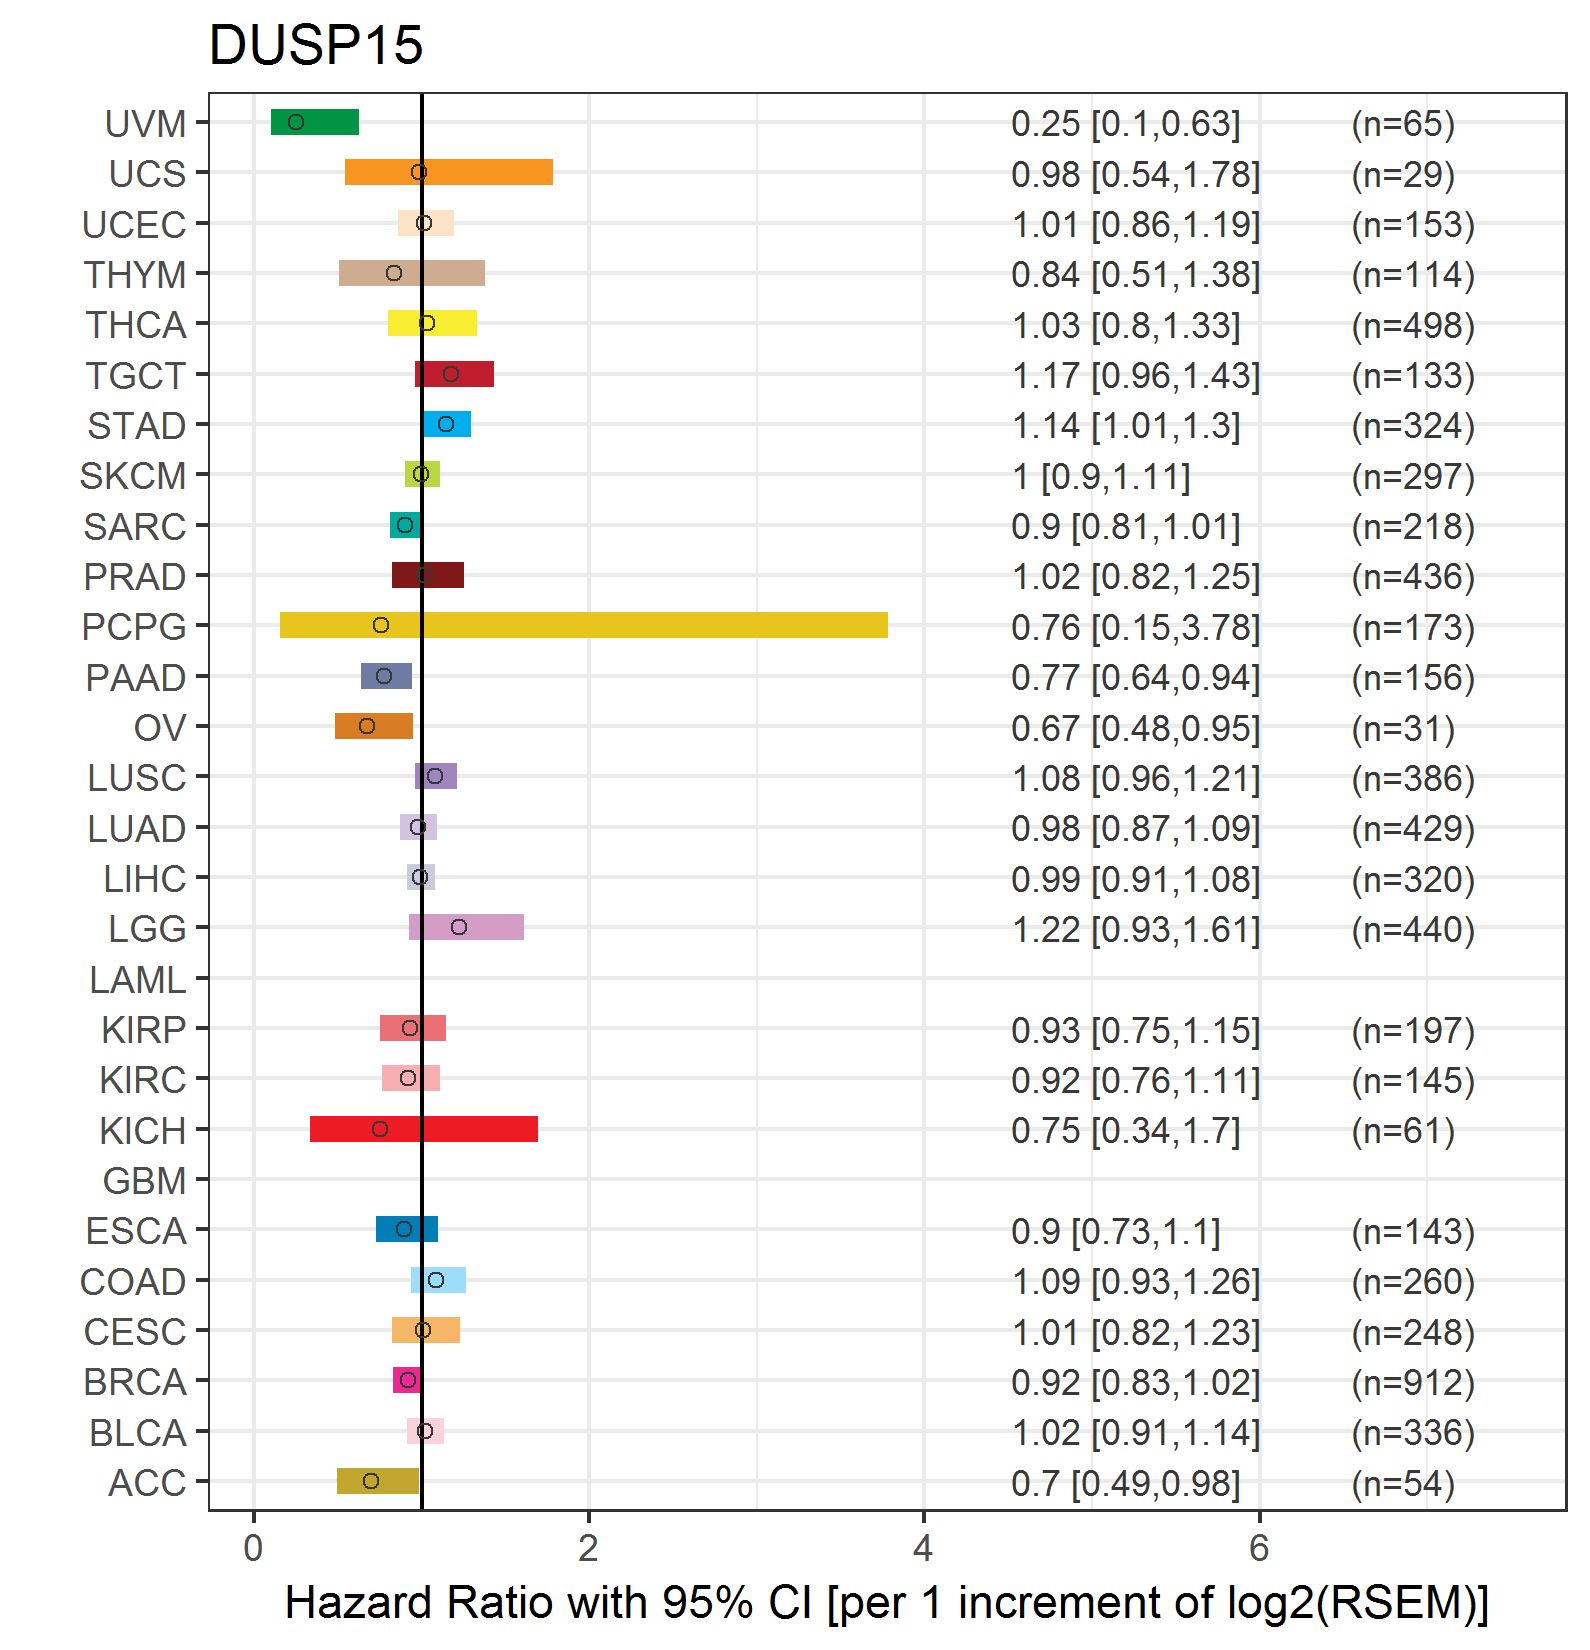 |
| Top |
| TissGeneClin for DUSP15 |
| TissGeneDrug for DUSP15 |
| Drug information targeting TissGene (DrugBank Version 5.0.6, 2017-04-01) |
| DrugBank ID | Drug name | Drug activity | Drug type | Drug status |
| Top |
| TissGeneDisease for DUSP15 |
| Disease information associated with TissGene (DisGeNet, 2016-06-01) |
| Disease ID | Disease name | # pubmeds | Source |
| umls:C0026269 | Mitral Valve Stenosis | 1 | BeFree |
| umls:C0026769 | Multiple Sclerosis | 1 | BeFree |
|
Copyright 2016-Present - The University of Texas Health Science Center at Houston (UTHealth) Web File Viewing | How to Report, Fraud, Waste and Abuse | State of Texas | Statewide Search | Texas Homeland Security | Site Policies |