 |
| |
| |
| |
| |
| |
| |
|

| TissGeneSummary for CPNE4 |
 Gene summary Gene summary |
| Basic gene information | Gene symbol | CPNE4 |
| Gene name | copine IV | |
| Synonyms | COPN4|CPN4 | |
| Cytomap | UCSC genome browser: 3q22.1 | |
| Type of gene | protein-coding | |
| RefGenes | NM_001289112.1, NM_130808.2,NM_153429.1, | |
| Description | copine 8copine-4 | |
| Modification date | 20141207 | |
| dbXrefs | MIM : 604208 | |
| HGNC : HGNC | ||
| Ensembl : ENSG00000196353 | ||
| HPRD : 05017 | ||
| Protein | UniProt: go to UniProt's Cross Reference DB Table | |
| Expression | CleanEX: HS_CPNE4 | |
| BioGPS: 131034 | ||
| Pathway | NCI Pathway Interaction Database: CPNE4 | |
| KEGG: CPNE4 | ||
| REACTOME: CPNE4 | ||
| Pathway Commons: CPNE4 | ||
| Context | iHOP: CPNE4 | |
| ligand binding site mutation search in PubMed: CPNE4 | ||
| UCL Cancer Institute: CPNE4 | ||
| Assigned class in TissGDB* | C | |
| Included tissue-specific gene expression resources | TiGER,GTEx | |
| Specific-tissues in normal samples (assigned by TissGDB using HPA, TiGER, and GTEx) | Prostate | |
| Cancer types related to the specific-tissues in cancer samples (assigned by TissGDB using TCGA) | PRAD | |
| Reference showing the relevant tissue of CPNE4 | ||
| Description by TissGene annotations | Fused withOncogene | |
| * Class A consists of genes with literature evidence and is part of the cTissGenes. Class B consists of only cTissGenes without additional evidence. The remaining genes belong to Class C. |
| Gene ontology having evidence of Inferred from Direct Assay (IDA) from Entrez |
| GO ID | GO term | PubMed ID |
| Top |
| TissGeneExp for CPNE4 |
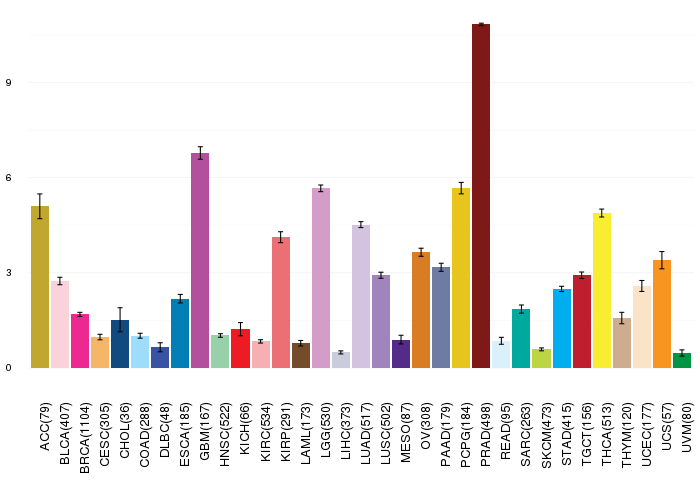
| Gene expressions across 28 cancer types (X-axis: cancer type and Y-axis: log2(norm_counts+1)) (TCGA IlluminaHiSeq_RNASeqV2, pan-cancer normalized log2(norm_counts+1) data, version 2016-08-16) |
 |
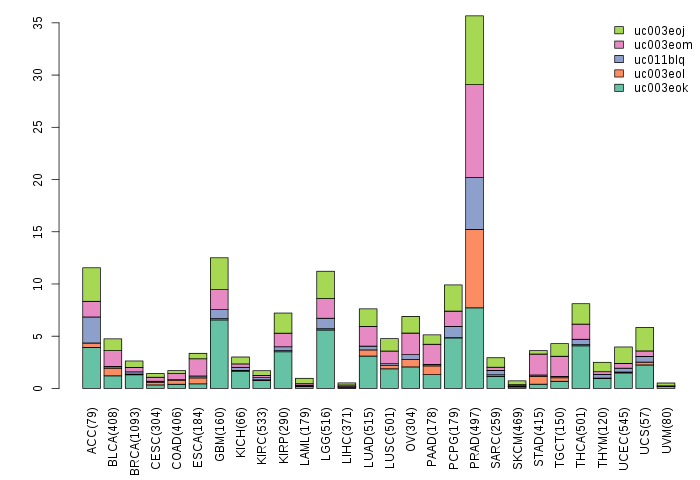
| Gene isoform expressions across 28 cancer types (X-axis: cancer type and Y-axis: log2(norm_counts+1)) (TCGA pan-cancer tcga_rsem_isoform_tpm, version 2016-09-01) |
 |
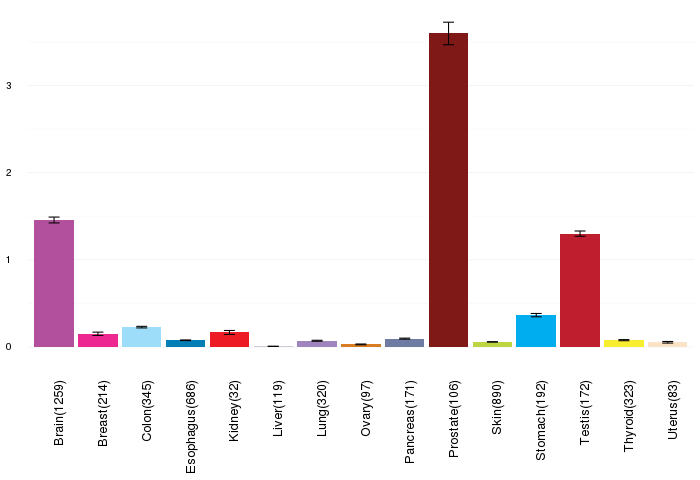
| Gene expressions across normal tissues of GTEx data (GTEx GTEx_Analysis_v6_RNA-seq_RNA-SeQCv1.1.8_gene_rpkm.gct) - Here, we shows the matched tissue types only among our 28 cancer types. |
 |
| Different expressions across 14 cancer types with more than 10 samples between matched tumors and normals (X-axis: cancer type and Y-axis: log2(norm_counts+1)) (TCGA IlluminaHiSeq_RNASeqV2, pan-cancer normalized log2(norm_counts+1) data, version 2016-08-16) |
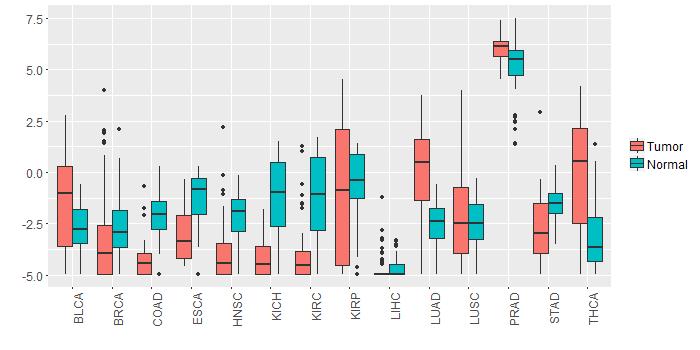 |
| - Significantly differentially expressed cancer types and information. (|Fold change|>1 and FDR<0.05) |
| Cancer type | Mean(exp) in tumor | Mean(exp) in matched normal | Log2FC | P-val. | FDR |
| THCA | -0.005930599 | -3.221788226 | 3.215857627 | 1.33E-11 | 9.98E-11 |
| COAD | -4.157576557 | -2.155941942 | -2.001634615 | 5.61E-08 | 4.20E-07 |
| KICH | -4.10806748 | -1.20241148 | -2.905656 | 5.97E-08 | 2.85E-07 |
| HNSC | -3.864647666 | -2.174589527 | -1.69005814 | 2.31E-07 | 2.05E-06 |
| LUAD | 0.064781002 | -2.468160377 | 2.532941379 | 2.45E-12 | 1.83E-11 |
| KIRC | -4.098057647 | -1.223999314 | -2.874058333 | 2.34E-18 | 1.58E-17 |
| STAD | -2.692800355 | -1.48444723 | -1.208353125 | 0.00126 | 0.006339463 |
| Top |
| TissGene-miRNA for CPNE4 |
| Significantly anti-correlated miRNAs of TissGene across 28 cancer types (Gene-miRNA relations from TargetScanHuman Relsease 7.1, Conserved_Site_Context_Scores.txt.zip, 06.01.2016) (TCGA IlluminaHiSeq_miRNASeq, log2(RPM+1) data, version 2016-11-21) (TCGA IlluminaHiSeq_RNASeqV2, log2(normalized_count+1) data, version 2016-08-16) (Spearman’s Rank Correlation (p-value<0.05 and coefficient<-0.25)) |
| Cancer type | miRNA id | miRNA accession | P-val. | Coeff. | # samples |
| Top |
| TissGeneMut for CPNE4 |
| TissGeneSNV for CPNE4 |
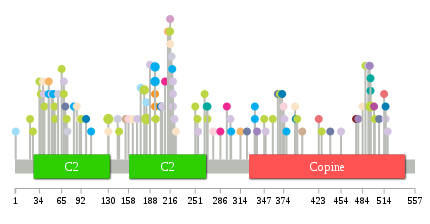
| nsSNV counts per each loci. Different colors of circles represent different cancer types. Circle size denotes number of samples. (TCGA somatic mutation (SNPs and small INDELs) data, version 2016-04-25) * Click on the image to enlarge it in a new window. |
 |
 |
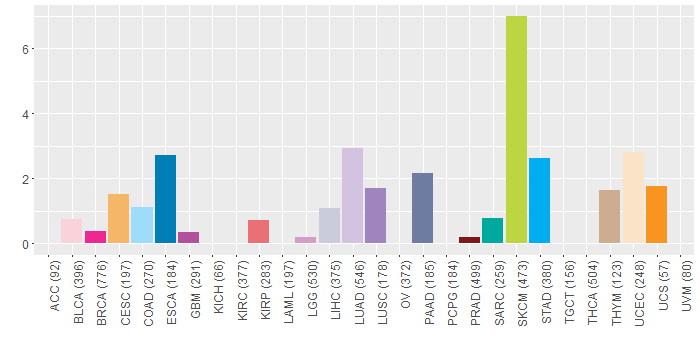
| Somatic nucleotide variants of TissGene across 28 cancer types (X-axis: cancer type and Y-axis: % of mutated samples) The numbers in parentheses are numbers of samples with mutation (nsSNVs). (TCGA somatic mutation (SNPs and small INDELs) data, version 2016-04-25) |
 |
| - nsSNVs sorted by frequency. |
| AAchange | Cancer type | # samples |
| p.R183C | SKCM | 4 |
| p.G495E | SKCM | 3 |
| p.S130F | SKCM | 3 |
| p.R195* | STAD | 2 |
| p.R195X | STAD | 2 |
| p.E180K | SKCM | 2 |
| p.G220* | LUAD | 1 |
| p.I300M | LUAD | 1 |
| p.R195* | UCS | 1 |
| p.S175Y | COAD | 1 |
| p.E60V | LIHC | 1 |
| p.S20R | HNSC | 1 |
| p.D154E | THYM | 1 |
| p.C70Y | PAAD | 1 |
| p.R86H | UCEC | 1 |
| p.R92W | SKCM | 1 |
| p.R47C | CESC | 1 |
| p.R68C | SKCM | 1 |
| p.C349* | LUAD | 1 |
| p.N286K | BRCA | 1 |
| p.T390_splice | UCEC | 1 |
| p.F210I | HNSC | 1 |
| p.N276K | BLCA | 1 |
| p.P21S | SKCM | 1 |
| p.A478D | LUSC | 1 |
| p.E347K | SKCM | 1 |
| p.G56R | SKCM | 1 |
| p.E65K | SKCM | 1 |
| p.N267K | SARC | 1 |
| p.T196I | SKCM | 1 |
| p.G495E | SARC | 1 |
| p.L41F | SKCM | 1 |
| p.R164W | UCEC | 1 |
| p.H55Y | SKCM | 1 |
| p.D452N | READ | 1 |
| p.P268S | SKCM | 1 |
| p.E251K | SKCM | 1 |
| p.G495R | SARC | 1 |
| p.S374F | BLCA | 1 |
| p.L439M | PAAD | 1 |
| p.D82N | STAD | 1 |
| p.E427K | SKCM | 1 |
| p.A255V | LUAD | 1 |
| p.P222Q | LUAD | 1 |
| p.S326P | HNSC | 1 |
| p.P73L | LIHC | 1 |
| p.R90H | UCEC | 1 |
| p.P507S | PAAD | 1 |
| p.K106T | STAD | 1 |
| p.Q334* | STAD | 1 |
| p.I181F | HNSC | 1 |
| p.P205S | LUAD | 1 |
| p.S209* | BRCA | 1 |
| p.F314V | CESC | 1 |
| p.K51N | LUAD | 1 |
| p.C218Y | LIHC | 1 |
| p.S216P | LGG | 1 |
| p.L519Q | LUAD | 1 |
| p.G34D | SKCM | 1 |
| p.E158Q | BLCA | 1 |
| p.D501N | SKCM | 1 |
| p.D494N | LUSC | 1 |
| p.V145M | SKCM | 1 |
| p.M500I | GBM | 1 |
| p.R224C | UCEC | 1 |
| p.Y8H | READ | 1 |
| p.P369L | SKCM | 1 |
| p.M301V | STAD | 1 |
| p.H375R | LUAD | 1 |
| p.P268T | SARC | 1 |
| p.S130Y | UCEC | 1 |
| p.L41H | HNSC | 1 |
| p.R213* | CESC | 1 |
| p.S216Y | UCEC | 1 |
| p.S423X | KIRP | 1 |
| p.S400I | THYM | 1 |
| p.S492* | LUAD | 1 |
| p.I391L | ESCA | 1 |
| p.A514V | KIRP | 1 |
| p.S123F | READ | 1 |
| p.N323K | PAAD | 1 |
| p.A188V | LUAD | 1 |
| p.N72Y | SKCM | 1 |
| p.P516Q | ESCA | 1 |
| p.Q53H | STAD | 1 |
| p.A378S | STAD | 1 |
| p.G337W | LUSC | 1 |
| p.K25N | SKCM | 1 |
| p.C47Y | STAD | 1 |
| p.G488E | SKCM | 1 |
| p.E426V | HNSC | 1 |
| p.A40G | LUAD | 1 |
| p.S216F | SKCM | 1 |
| p.S36F | SKCM | 1 |
| p.G254R | SKCM | 1 |
| p.L203V | ESCA | 1 |
| p.P359S | SKCM | 1 |
| p.E264K | SKCM | 1 |
| p.M1V | COAD | 1 |
| p.R366M | PAAD | 1 |
| p.Q334X | STAD | 1 |
| p.P516L | LUAD | 1 |
| p.F314L | READ | 1 |
| p.D484G | UCEC | 1 |
| p.R13K | CHOL | 1 |
| p.S219N | STAD | 1 |
| p.S99R | ESCA | 1 |
| p.R195X | UCS | 1 |
| p.T372M | ESCA | 1 |
| p.G220V | LUAD | 1 |
| p.E197K | HNSC | 1 |
| p.R68P | LUAD | 1 |
| p.D170Y | LUAD | 1 |
| p.S295Y | BRCA | 1 |
| p.R454Q | LUAD | 1 |
| p.G220L | LUAD | 1 |
| p.D39Y | UCEC | 1 |
| p.R183C | COAD | 1 |
| p.A475T | PRAD | 1 |
| p.I143F | LIHC | 1 |
| p.G393E | SKCM | 1 |
| Top |
| TissGeneCNV for CPNE4 |
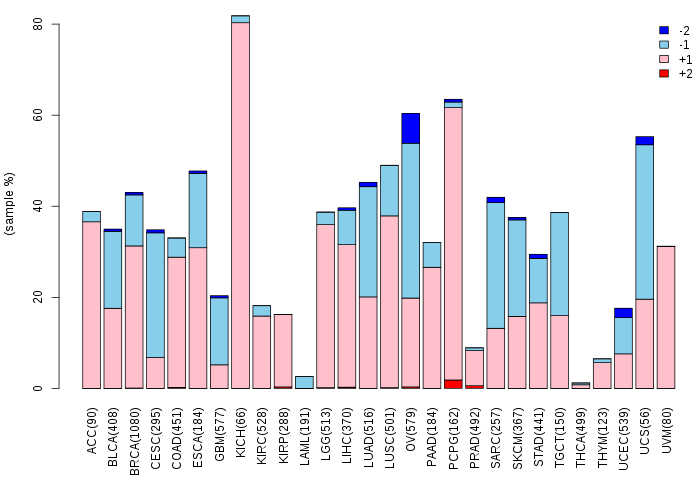
| Copy number variations of TissGene across 28 cancer types (X-axis: cancer type and Y-axis: % of CNV samples) (TCGA Gistic2_CopyNumber_Gistic2_all_data_by_genes, Gistic2 copy number data, version 2016-08-16) |
 |
| Top |
| TissGeneFusions for CPNE4 |
| Fusion genes including TissGene (ChimerDB 3.0, 2016-12-01 and TCGA fusion Portal 2015-12-01) |
| Database | Src | Cancer type | Sample | Fusion gene | ORF | 5'-gene BP | 3'-gene BP |
| Chimerdb3.0 | ChiTaRs | NA | AA580838 | CPNE4-CSF1R | chr3:131962431 | chr5:149474315 | |
| Chimerdb3.0 | ChiTaRs | NA | BF989450 | CPNE4-PSAT1 | chr3:131966685 | chr9:80944226 | |
| Chimerdb3.0 | ChiTaRs | NA | BP396500 | CPNE4-USP48 | chr3:131566318 | chr1:22054344 | |
| Chimerdb3.0 | ChiTaRs | NA | AA894897 | CPNE4-CPNE4 | chr3:131253937 | chr3:131253593 | |
| Chimerdb3.0 | ChiTaRs | NA | BQ638056 | CPNE4-ZDHHC5 | chr3:131763793 | chr11:57468162 | |
| Chimerdb3.0 | ChiTaRs | NA | BE005082 | ANKRD10-CPNE4 | chr13:111536136 | chr3:131804259 | |
| TCGAfusionPortal | PRADA | PRAD | TCGA-KK-A8IC-01A | LLGL2-CPNE4 | CDS-5UTR | Chr17:73559887 | Chr3:131759165 |
| Top |
| TissGeneNet for CPNE4 |
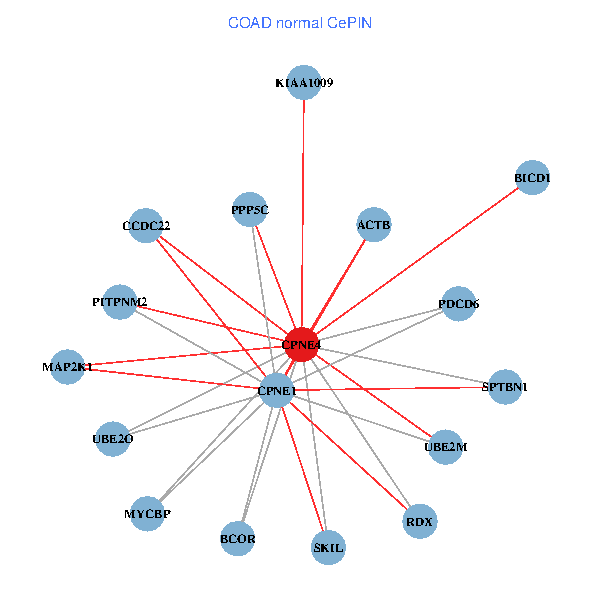
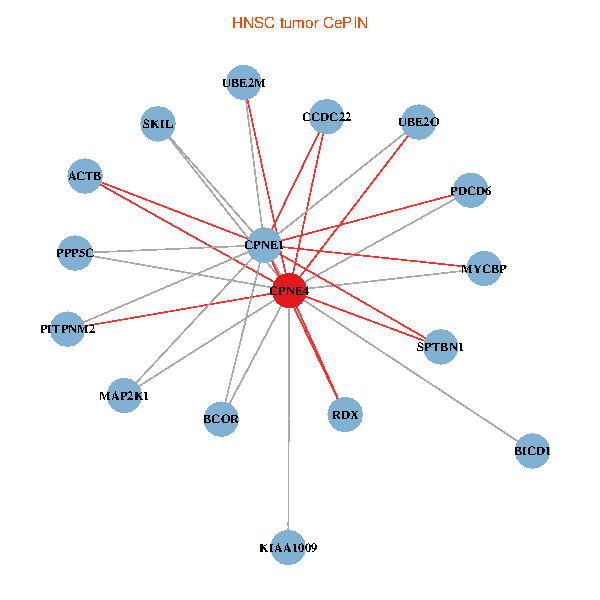
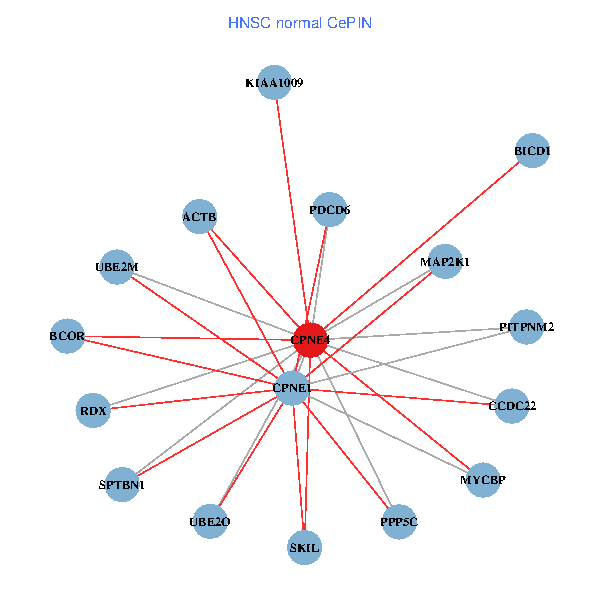
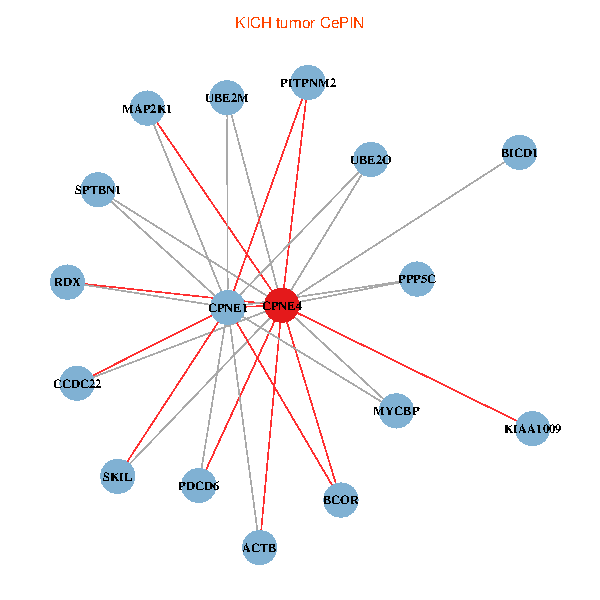
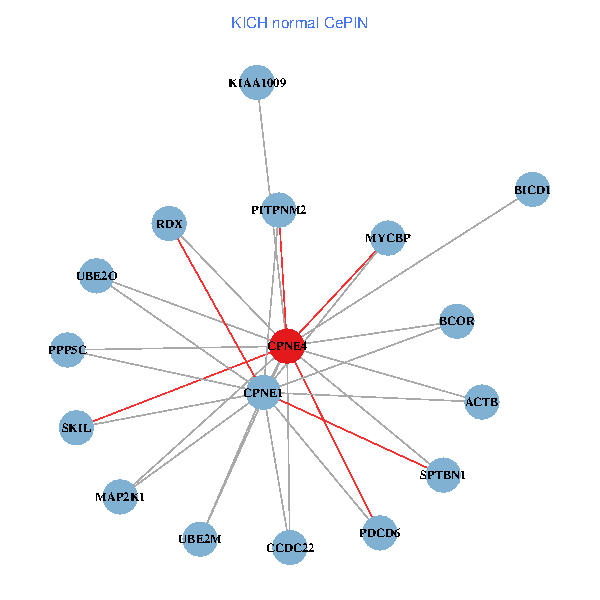
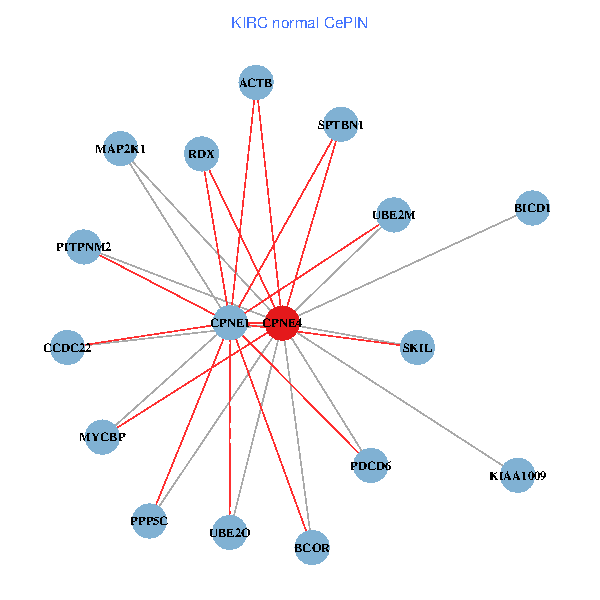
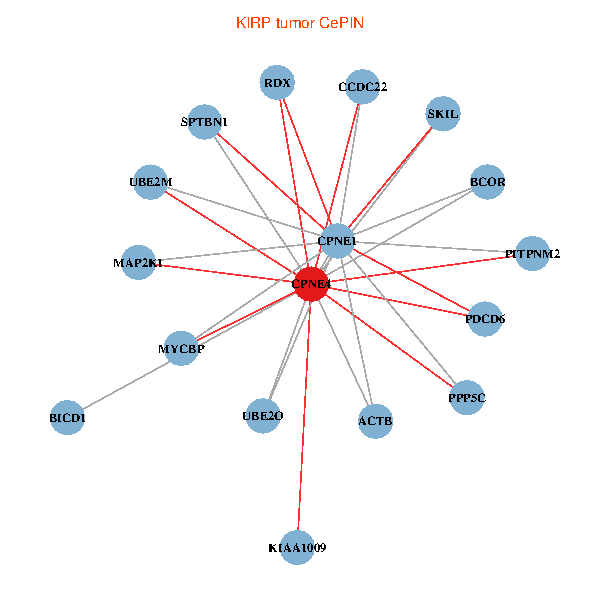
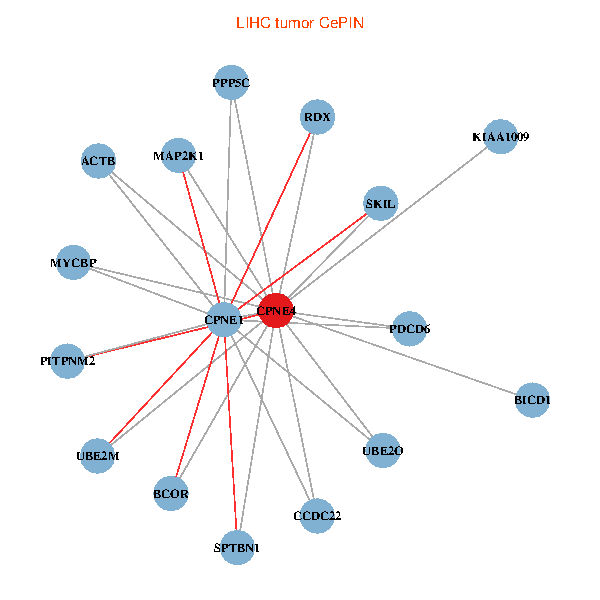
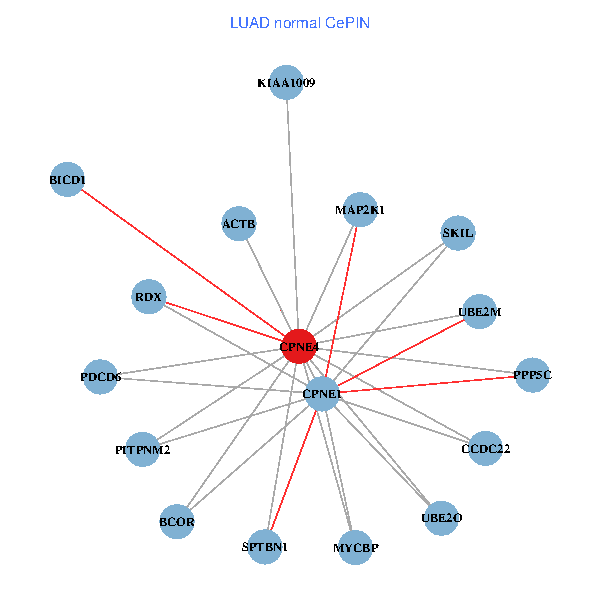
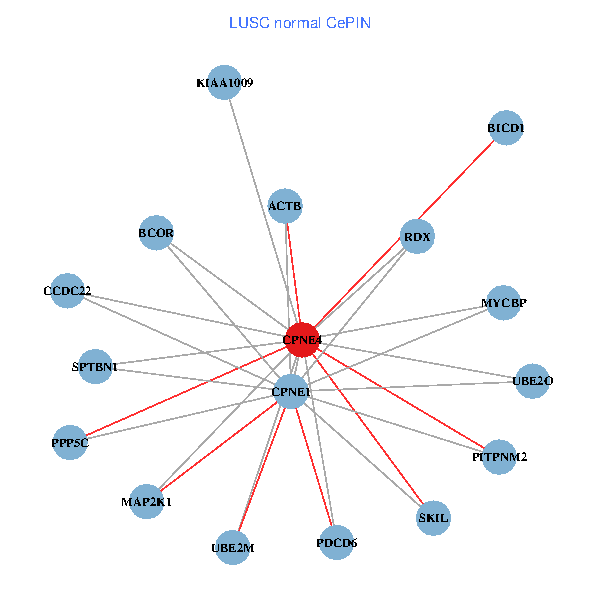
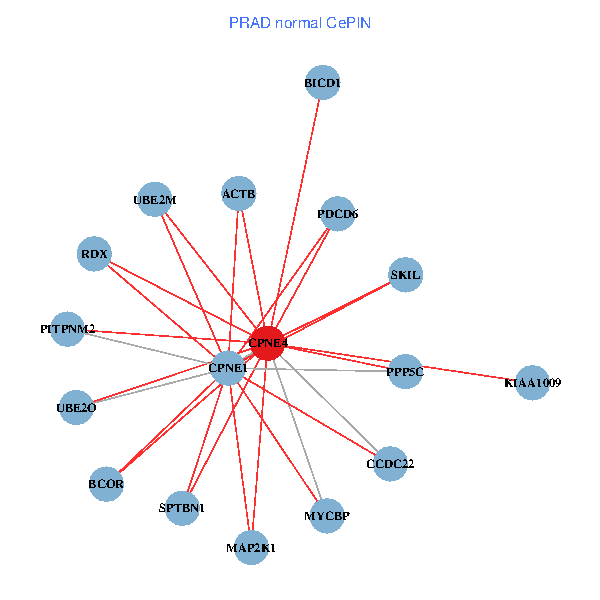
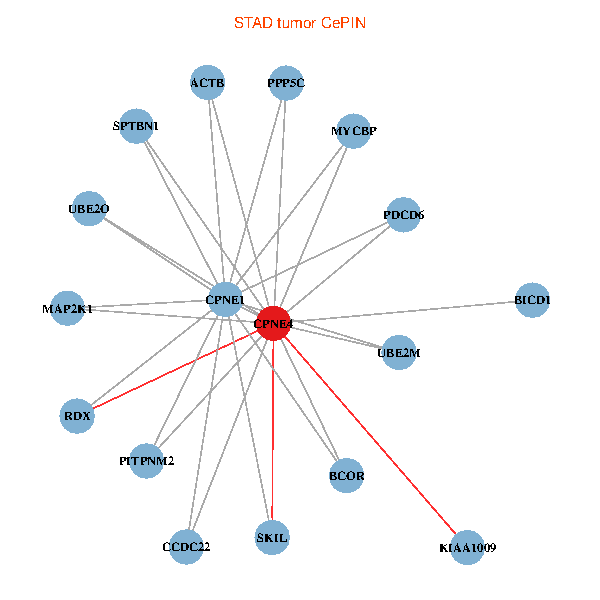
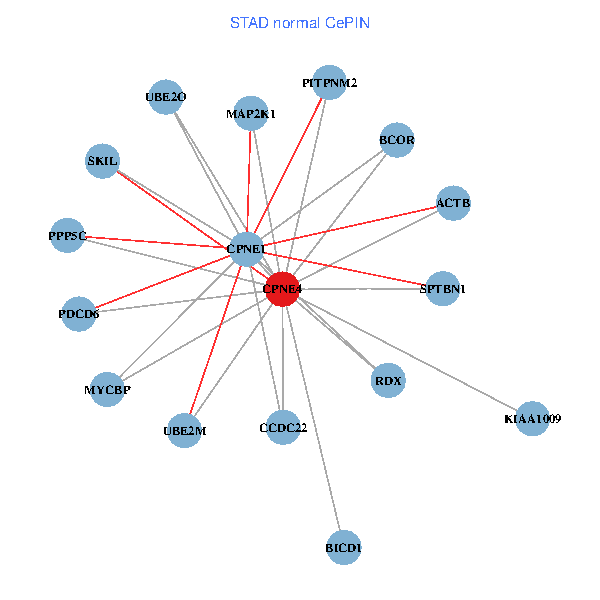
| Co-expressed gene networks based on protein-protein interaction data (CePIN) (TCGA IlluminaHiSeq_RNASeqV2, pan-cancer normalized log2(norm_counts+1) data, version 2016-08-16) (PINA2 ppi data) |
| BRCA (tumor) | BRCA (normal) |
| CPNE4, PPP5C, PDCD6, MAP2K1, UBE2M, ACTB, BICD1, BCOR, RDX, MYCBP, UBE2O, SPTBN1, SKIL, CPNE1, KIAA1009, CCDC22, PITPNM2 (tumor) | CPNE4, PPP5C, PDCD6, MAP2K1, UBE2M, ACTB, BICD1, BCOR, RDX, MYCBP, UBE2O, SPTBN1, SKIL, CPNE1, KIAA1009, CCDC22, PITPNM2 (normal) |
 |  |
| COAD (tumor) | COAD (normal) |
| CPNE4, PPP5C, PDCD6, MAP2K1, UBE2M, ACTB, BICD1, BCOR, RDX, MYCBP, UBE2O, SPTBN1, SKIL, CPNE1, KIAA1009, CCDC22, PITPNM2 (tumor) | CPNE4, PPP5C, PDCD6, MAP2K1, UBE2M, ACTB, BICD1, BCOR, RDX, MYCBP, UBE2O, SPTBN1, SKIL, CPNE1, KIAA1009, CCDC22, PITPNM2 (normal) |
 |  |
| HNSC (tumor) | HNSC (normal) |
| CPNE4, PPP5C, PDCD6, MAP2K1, UBE2M, ACTB, BICD1, BCOR, RDX, MYCBP, UBE2O, SPTBN1, SKIL, CPNE1, KIAA1009, CCDC22, PITPNM2 (tumor) | CPNE4, PPP5C, PDCD6, MAP2K1, UBE2M, ACTB, BICD1, BCOR, RDX, MYCBP, UBE2O, SPTBN1, SKIL, CPNE1, KIAA1009, CCDC22, PITPNM2 (normal) |
 |  |
| KICH (tumor) | KICH (normal) |
| CPNE4, PPP5C, PDCD6, MAP2K1, UBE2M, ACTB, BICD1, BCOR, RDX, MYCBP, UBE2O, SPTBN1, SKIL, CPNE1, KIAA1009, CCDC22, PITPNM2 (tumor) | CPNE4, PPP5C, PDCD6, MAP2K1, UBE2M, ACTB, BICD1, BCOR, RDX, MYCBP, UBE2O, SPTBN1, SKIL, CPNE1, KIAA1009, CCDC22, PITPNM2 (normal) |
 |  |
| KIRC (tumor) | KIRC (normal) |
| CPNE4, PPP5C, PDCD6, MAP2K1, UBE2M, ACTB, BICD1, BCOR, RDX, MYCBP, UBE2O, SPTBN1, SKIL, CPNE1, KIAA1009, CCDC22, PITPNM2 (tumor) | CPNE4, PPP5C, PDCD6, MAP2K1, UBE2M, ACTB, BICD1, BCOR, RDX, MYCBP, UBE2O, SPTBN1, SKIL, CPNE1, KIAA1009, CCDC22, PITPNM2 (normal) |
 |  |
| KIRP (tumor) | KIRP (normal) |
| CPNE4, PPP5C, PDCD6, MAP2K1, UBE2M, ACTB, BICD1, BCOR, RDX, MYCBP, UBE2O, SPTBN1, SKIL, CPNE1, KIAA1009, CCDC22, PITPNM2 (tumor) | CPNE4, PPP5C, PDCD6, MAP2K1, UBE2M, ACTB, BICD1, BCOR, RDX, MYCBP, UBE2O, SPTBN1, SKIL, CPNE1, KIAA1009, CCDC22, PITPNM2 (normal) |
 |  |
| LIHC (tumor) | LIHC (normal) |
| CPNE4, PPP5C, PDCD6, MAP2K1, UBE2M, ACTB, BICD1, BCOR, RDX, MYCBP, UBE2O, SPTBN1, SKIL, CPNE1, KIAA1009, CCDC22, PITPNM2 (tumor) | CPNE4, PPP5C, PDCD6, MAP2K1, UBE2M, ACTB, BICD1, BCOR, RDX, MYCBP, UBE2O, SPTBN1, SKIL, CPNE1, KIAA1009, CCDC22, PITPNM2 (normal) |
 |  |
| LUAD (tumor) | LUAD (normal) |
| CPNE4, PPP5C, PDCD6, MAP2K1, UBE2M, ACTB, BICD1, BCOR, RDX, MYCBP, UBE2O, SPTBN1, SKIL, CPNE1, KIAA1009, CCDC22, PITPNM2 (tumor) | CPNE4, PPP5C, PDCD6, MAP2K1, UBE2M, ACTB, BICD1, BCOR, RDX, MYCBP, UBE2O, SPTBN1, SKIL, CPNE1, KIAA1009, CCDC22, PITPNM2 (normal) |
 |  |
| LUSC (tumor) | LUSC (normal) |
| CPNE4, PPP5C, PDCD6, MAP2K1, UBE2M, ACTB, BICD1, BCOR, RDX, MYCBP, UBE2O, SPTBN1, SKIL, CPNE1, KIAA1009, CCDC22, PITPNM2 (tumor) | CPNE4, PPP5C, PDCD6, MAP2K1, UBE2M, ACTB, BICD1, BCOR, RDX, MYCBP, UBE2O, SPTBN1, SKIL, CPNE1, KIAA1009, CCDC22, PITPNM2 (normal) |
 |  |
| PRAD (tumor) | PRAD (normal) |
| CPNE4, PPP5C, PDCD6, MAP2K1, UBE2M, ACTB, BICD1, BCOR, RDX, MYCBP, UBE2O, SPTBN1, SKIL, CPNE1, KIAA1009, CCDC22, PITPNM2 (tumor) | CPNE4, PPP5C, PDCD6, MAP2K1, UBE2M, ACTB, BICD1, BCOR, RDX, MYCBP, UBE2O, SPTBN1, SKIL, CPNE1, KIAA1009, CCDC22, PITPNM2 (normal) |
 |  |
| STAD (tumor) | STAD (normal) |
| CPNE4, PPP5C, PDCD6, MAP2K1, UBE2M, ACTB, BICD1, BCOR, RDX, MYCBP, UBE2O, SPTBN1, SKIL, CPNE1, KIAA1009, CCDC22, PITPNM2 (tumor) | CPNE4, PPP5C, PDCD6, MAP2K1, UBE2M, ACTB, BICD1, BCOR, RDX, MYCBP, UBE2O, SPTBN1, SKIL, CPNE1, KIAA1009, CCDC22, PITPNM2 (normal) |
 |  |
| THCA (tumor) | THCA (normal) |
| CPNE4, PPP5C, PDCD6, MAP2K1, UBE2M, ACTB, BICD1, BCOR, RDX, MYCBP, UBE2O, SPTBN1, SKIL, CPNE1, KIAA1009, CCDC22, PITPNM2 (tumor) | CPNE4, PPP5C, PDCD6, MAP2K1, UBE2M, ACTB, BICD1, BCOR, RDX, MYCBP, UBE2O, SPTBN1, SKIL, CPNE1, KIAA1009, CCDC22, PITPNM2 (normal) |
 |  |
| Top |
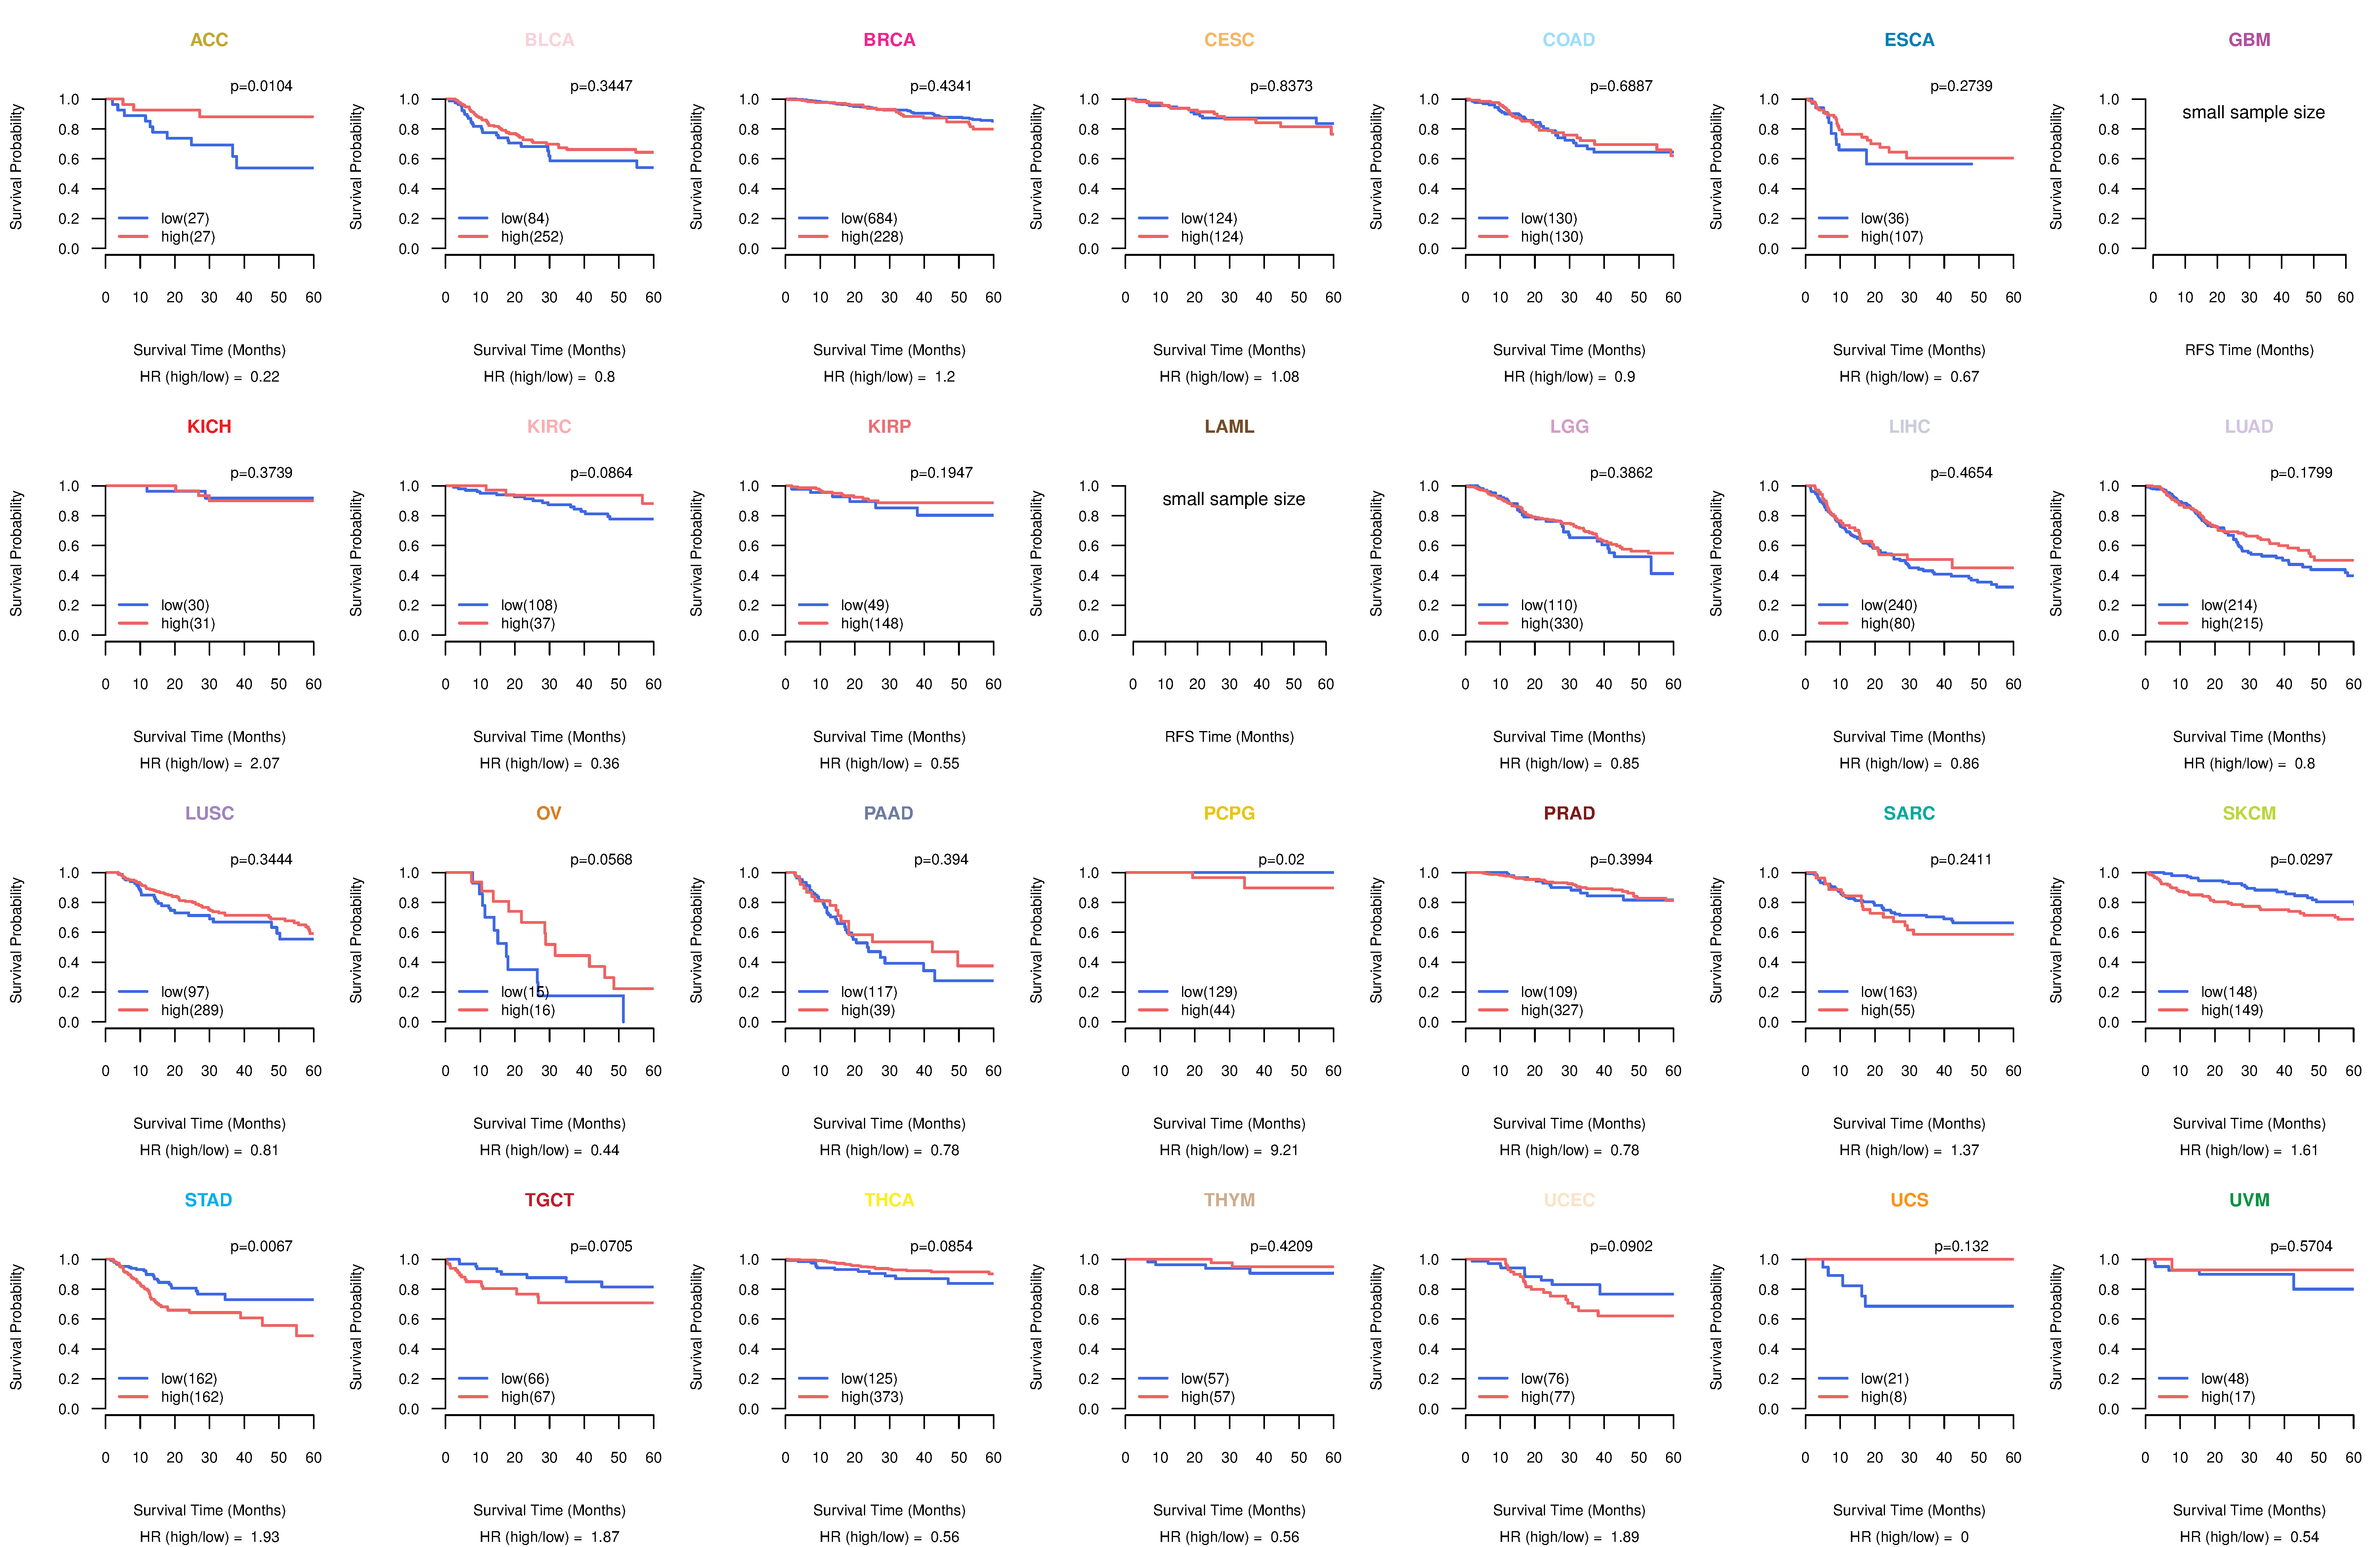
| TissGeneProg for CPNE4 |
| Kaplan-Meier plots with logrank tests of overall survival (OS) using 28 cancer types (TCGA IlluminaHiSeq_RNASeqV2, pan-cancer normalized log2(norm_counts+1) data, version 2016-08-16) (TCGA clinicalMatrix, phenotype data, version 2016-04-27) * Click on the image to enlarge it in a new window. |
 |
| Kaplan-Meier plots with logrank test of relapse free survival (RFS) using 28 cancer types (TCGA IlluminaHiSeq_RNASeqV2, pan-cancer normalized log2(norm_counts+1) data, version 2016-08-16) (TCGA clinicalMatrix, phenotype data, version 2016-04-27) * Click on the image enlarge it in a new window. |
 |
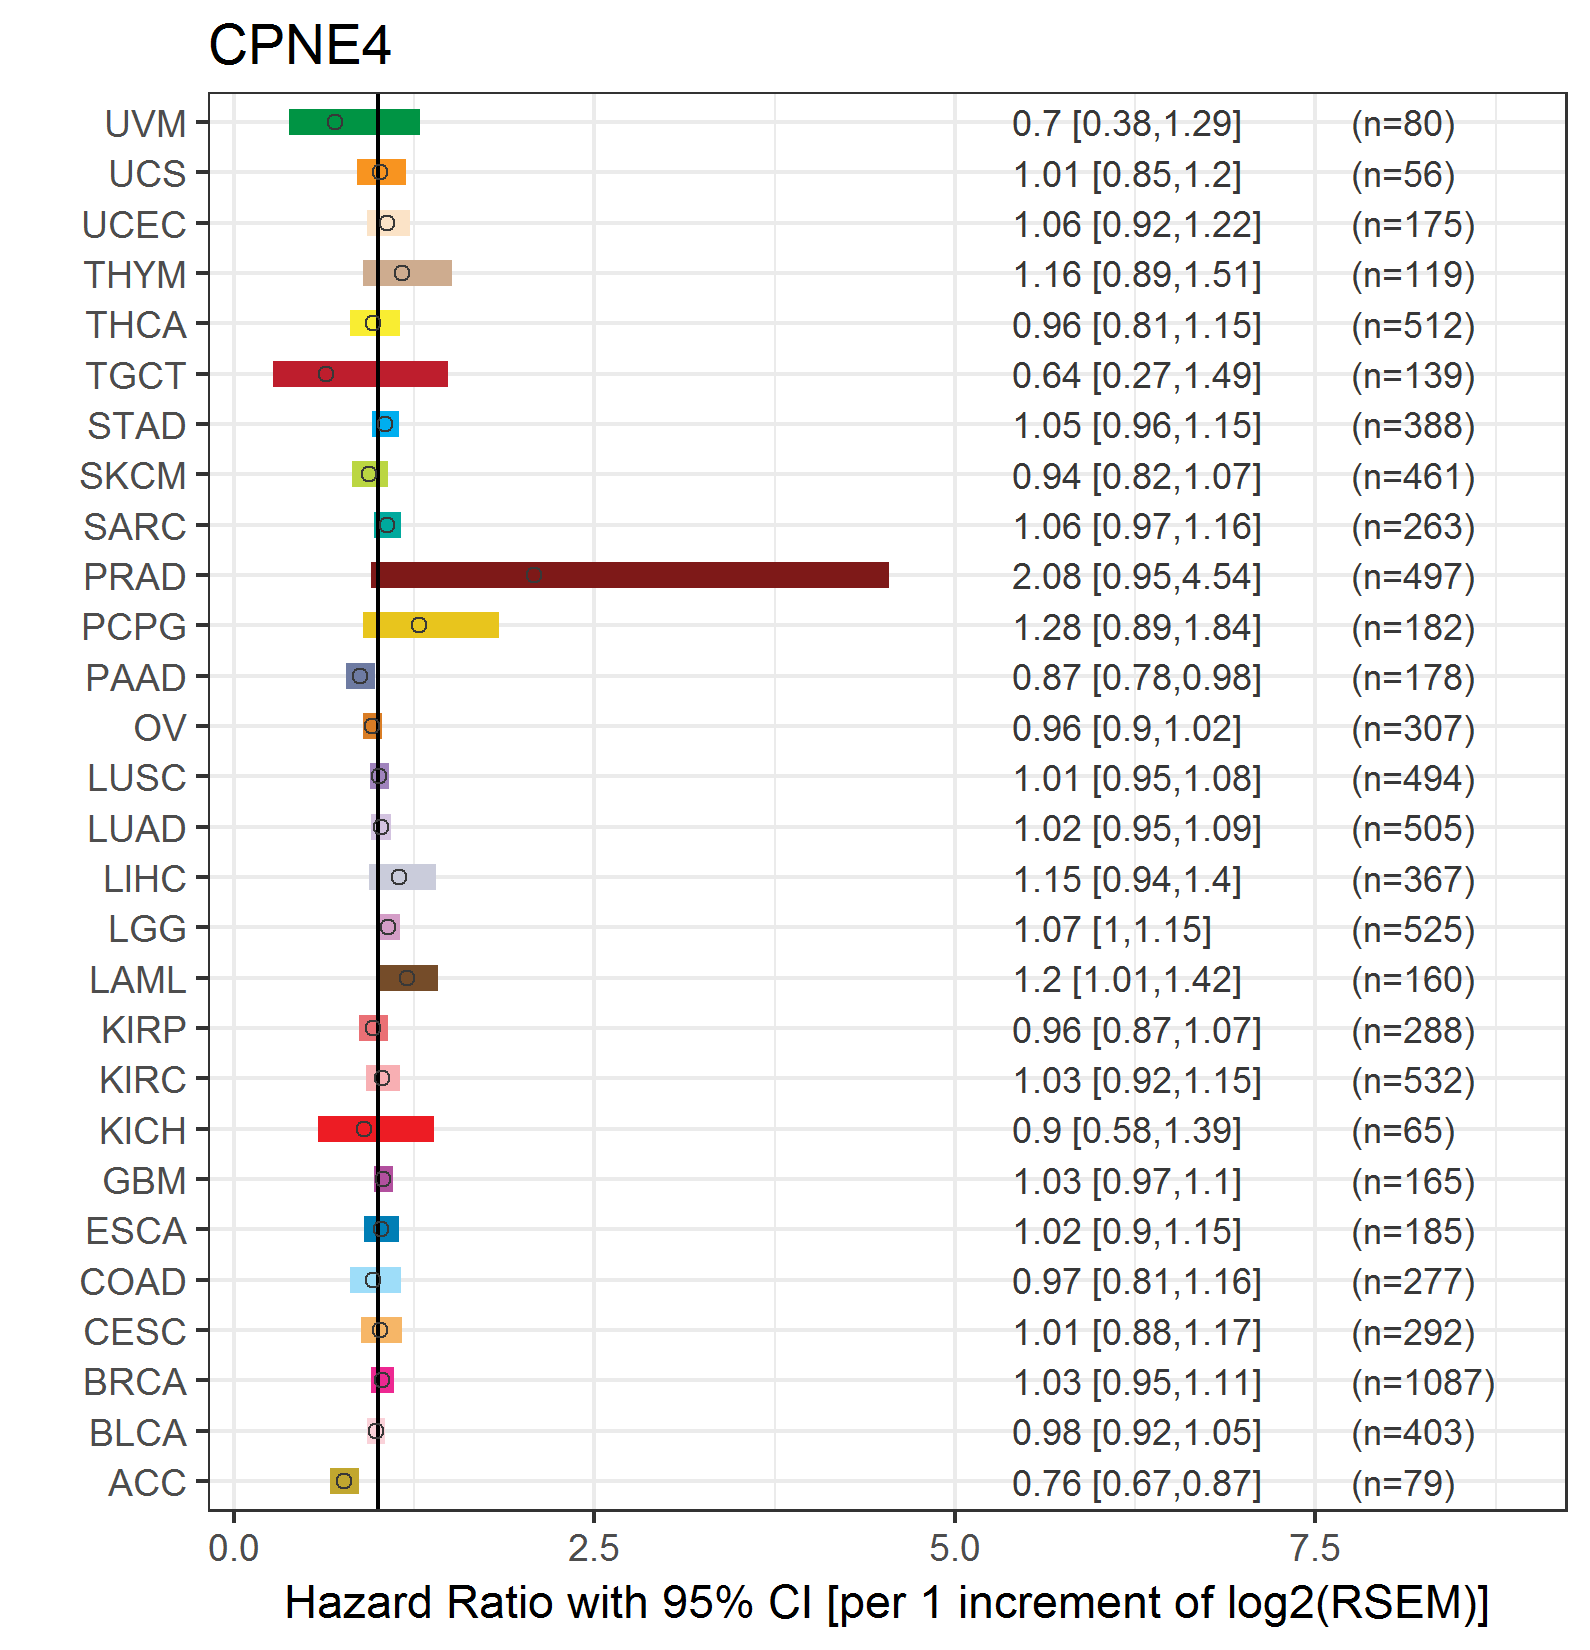
| Forest plot of Cox proportional hazard ratio (HR) and 95% CI of overall survival (OS) using 28 cancer types (TCGA IlluminaHiSeq_RNASeqV2, pan-cancer normalized log2(norm_counts+1) data, version 2016-08-16) (TCGA clinicalMatrix, phenotype data, version 2016-04-27) * Click on the image enlarge it in a new window. |
 |
| Forest plot of Cox proportional hazard ratio (HR) and 95% CI of relapse free survival (RFS) using 28 cancer types (TCGA IlluminaHiSeq_RNASeqV2, pan-cancer normalized log2(norm_counts+1) data, version 2016-08-16) (TCGA clinicalMatrix, phenotype data, version 2016-04-27) * Click on the image enlarge it in a new window. |
 |
| Top |
| TissGeneClin for CPNE4 |
| TissGeneDrug for CPNE4 |
| Drug information targeting TissGene (DrugBank Version 5.0.6, 2017-04-01) |
| DrugBank ID | Drug name | Drug activity | Drug type | Drug status |
| Top |
| TissGeneDisease for CPNE4 |
| Disease information associated with TissGene (DisGeNet, 2016-06-01) |
| Disease ID | Disease name | # pubmeds | Source |
| umls:C0026603 | Motion Sickness | 1 | GWASCAT |
| umls:C0040336 | Tobacco Use Disorder | 1 | GAD |
|
Copyright 2016-Present - The University of Texas Health Science Center at Houston (UTHealth) Web File Viewing | How to Report, Fraud, Waste and Abuse | State of Texas | Statewide Search | Texas Homeland Security | Site Policies |