 |
| |
| |
| |
| |
| |
| |
|

| TissGeneSummary for IL17RE |
 Gene summary Gene summary |
| Basic gene information | Gene symbol | IL17RE |
| Gene name | interleukin 17 receptor E | |
| Synonyms | - | |
| Cytomap | UCSC genome browser: 3p25.3 | |
| Type of gene | protein-coding | |
| RefGenes | NM_001193380.1, NM_153480.1,NM_153481.1,NM_153483.2,NR_104198.1, NM_144640.2, | |
| Description | IL-17 receptor Einterleukin-17 receptor E | |
| Modification date | 20141207 | |
| dbXrefs | MIM : 614995 | |
| HGNC : HGNC | ||
| Ensembl : ENSG00000163701 | ||
| HPRD : 17143 | ||
| Vega : OTTHUMG00000128649 | ||
| Protein | UniProt: go to UniProt's Cross Reference DB Table | |
| Expression | CleanEX: HS_IL17RE | |
| BioGPS: 132014 | ||
| Pathway | NCI Pathway Interaction Database: IL17RE | |
| KEGG: IL17RE | ||
| REACTOME: IL17RE | ||
| Pathway Commons: IL17RE | ||
| Context | iHOP: IL17RE | |
| ligand binding site mutation search in PubMed: IL17RE | ||
| UCL Cancer Institute: IL17RE | ||
| Assigned class in TissGDB* | C | |
| Included tissue-specific gene expression resources | TiGER,GTEx | |
| Specific-tissues in normal samples (assigned by TissGDB using HPA, TiGER, and GTEx) | SkinStomach | |
| Cancer types related to the specific-tissues in cancer samples (assigned by TissGDB using TCGA) | SKCMSTAD | |
| Reference showing the relevant tissue of IL17RE | ||
| Description by TissGene annotations | ||
| * Class A consists of genes with literature evidence and is part of the cTissGenes. Class B consists of only cTissGenes without additional evidence. The remaining genes belong to Class C. |
| Gene ontology having evidence of Inferred from Direct Assay (IDA) from Entrez |
| GO ID | GO term | PubMed ID |
| Top |
| TissGeneExp for IL17RE |
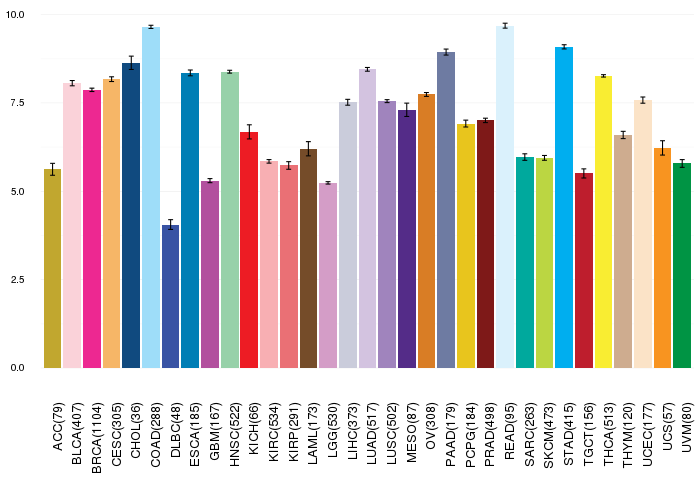
| Gene expressions across 28 cancer types (X-axis: cancer type and Y-axis: log2(norm_counts+1)) (TCGA IlluminaHiSeq_RNASeqV2, pan-cancer normalized log2(norm_counts+1) data, version 2016-08-16) |
 |
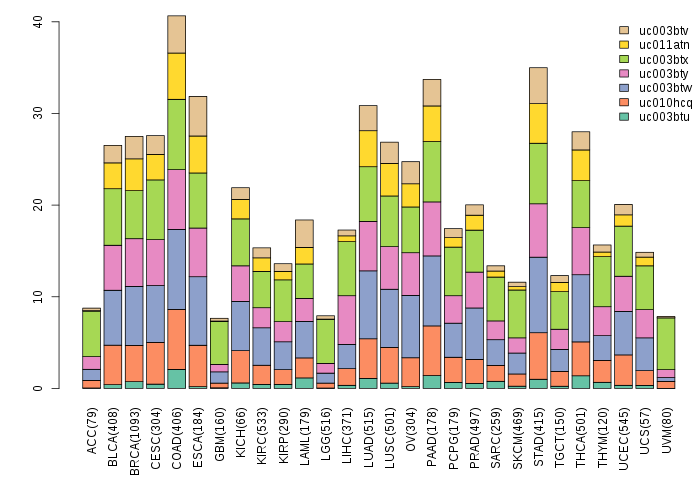
| Gene isoform expressions across 28 cancer types (X-axis: cancer type and Y-axis: log2(norm_counts+1)) (TCGA pan-cancer tcga_rsem_isoform_tpm, version 2016-09-01) |
 |
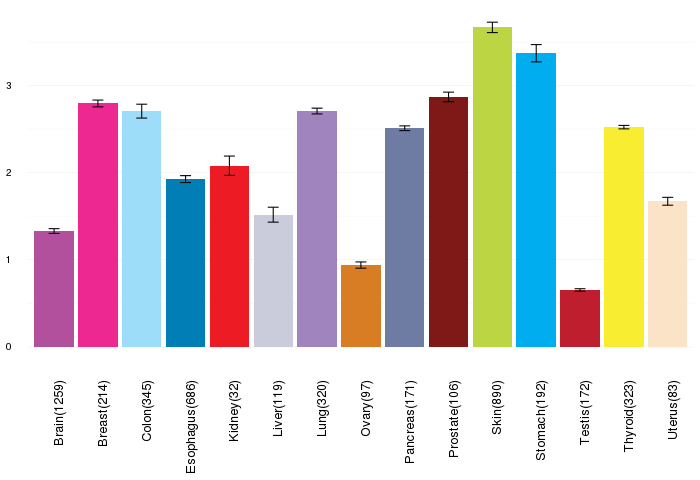
| Gene expressions across normal tissues of GTEx data (GTEx GTEx_Analysis_v6_RNA-seq_RNA-SeQCv1.1.8_gene_rpkm.gct) - Here, we shows the matched tissue types only among our 28 cancer types. |
 |
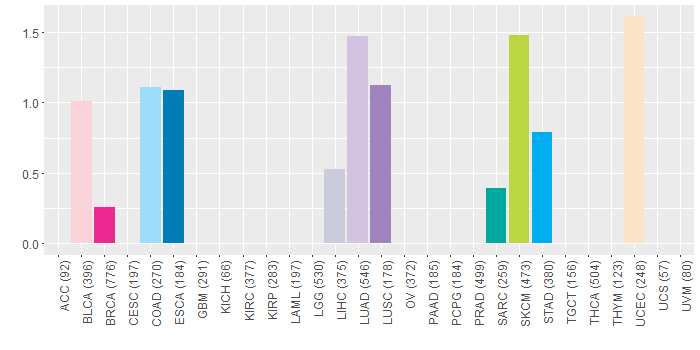
| Different expressions across 14 cancer types with more than 10 samples between matched tumors and normals (X-axis: cancer type and Y-axis: log2(norm_counts+1)) (TCGA IlluminaHiSeq_RNASeqV2, pan-cancer normalized log2(norm_counts+1) data, version 2016-08-16) |
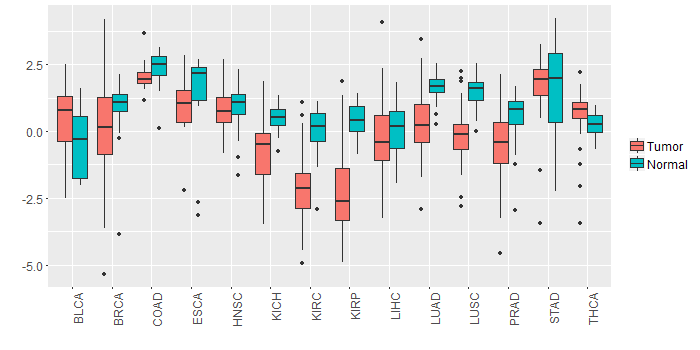 |
| - Significantly differentially expressed cancer types and information. (|Fold change|>1 and FDR<0.05) |
| Cancer type | Mean(exp) in tumor | Mean(exp) in matched normal | Log2FC | P-val. | FDR |
| LUSC | -0.113005023 | 1.476118506 | -1.589123529 | 1.39E-15 | 9.40E-15 |
| PRAD | -0.601970031 | 0.595201123 | -1.197171154 | 4.19E-07 | 3.25E-06 |
| LUAD | 0.282521481 | 1.692107688 | -1.409586207 | 2.66E-13 | 2.23E-12 |
| KIRP | -2.024769791 | 0.416802084 | -2.441571875 | 1.95E-08 | 1.41E-07 |
| KIRC | -2.132946527 | 0.099984029 | -2.232930556 | 7.13E-29 | 1.23E-27 |
| KICH | -0.875713416 | 0.505766584 | -1.38148 | 5.08E-05 | 0.000141012 |
| Top |
| TissGene-miRNA for IL17RE |
| Significantly anti-correlated miRNAs of TissGene across 28 cancer types (Gene-miRNA relations from TargetScanHuman Relsease 7.1, Conserved_Site_Context_Scores.txt.zip, 06.01.2016) (TCGA IlluminaHiSeq_miRNASeq, log2(RPM+1) data, version 2016-11-21) (TCGA IlluminaHiSeq_RNASeqV2, log2(normalized_count+1) data, version 2016-08-16) (Spearman’s Rank Correlation (p-value<0.05 and coefficient<-0.25)) |
| Cancer type | miRNA id | miRNA accession | P-val. | Coeff. | # samples |
| Top |
| TissGeneMut for IL17RE |
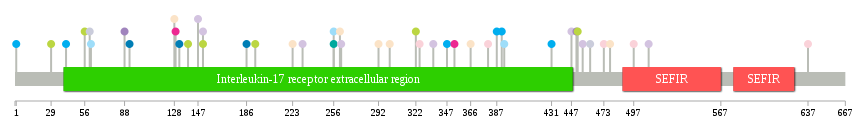
| TissGeneSNV for IL17RE |
| nsSNV counts per each loci. Different colors of circles represent different cancer types. Circle size denotes number of samples. (TCGA somatic mutation (SNPs and small INDELs) data, version 2016-04-25) * Click on the image to enlarge it in a new window. |
 |
 |
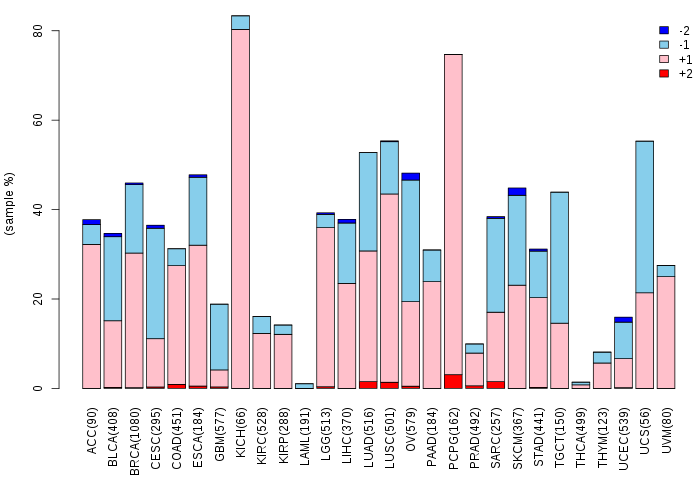
| Somatic nucleotide variants of TissGene across 28 cancer types (X-axis: cancer type and Y-axis: % of mutated samples) The numbers in parentheses are numbers of samples with mutation (nsSNVs). (TCGA somatic mutation (SNPs and small INDELs) data, version 2016-04-25) |
 |
| - nsSNVs sorted by frequency. |
| AAchange | Cancer type | # samples |
| p.R129P | BRCA | 1 |
| p.K223T | UCEC | 1 |
| p.H336Y | LUAD | 1 |
| p.T49N | HNSC | 1 |
| p.M41T | STAD | 1 |
| p.W637* | BLCA | 1 |
| p.F301S | UCEC | 1 |
| p.W61R | COAD | 1 |
| p.R322Q | SKCM | 1 |
| p.N347S | STAD | 1 |
| p.G456V | LUAD | 1 |
| p.M1T | STAD | 1 |
| p.R151C | SKCM | 1 |
| p.P393A | COAD | 1 |
| p.S431N | STAD | 1 |
| p.L40V | HNSC | 1 |
| p.R151C | LUAD | 1 |
| p.I462V | LIHC | 1 |
| p.P56S | SKCM | 1 |
| p.L473V | BLCA | 1 |
| p.T193I | SKCM | 1 |
| p.D325N | BLCA | 1 |
| p.R451W | LUSC | 1 |
| p.Q132E | ESCA | 1 |
| p.P20L | MESO | 1 |
| p.S497C | BLCA | 1 |
| p.F88L | LUSC | 1 |
| p.S366R | UCEC | 1 |
| p.Q262* | LUAD | 1 |
| p.S139F | SKCM | 1 |
| p.G509E | LUAD | 1 |
| p.R256H | COAD | 1 |
| p.R256C | SARC | 1 |
| p.S380* | BLCA | 1 |
| p.Q92E | ESCA | 1 |
| p.T292I | UCEC | 1 |
| p.L447P | LUAD | 1 |
| p.V231L | LUAD | 1 |
| p.N387S | STAD | 1 |
| p.G452S | SKCM | 1 |
| p.S186F | ESCA | 1 |
| p.R29C | SKCM | 1 |
| p.C353R | BRCA | 1 |
| p.R128H | UCEC | 1 |
| p.L60P | LIHC | 1 |
| p.F261S | UCEC | 1 |
| p.S391N | STAD | 1 |
| p.H147L | LUAD | 1 |
| p.R478W | UCEC | 1 |
| Top |
| TissGeneCNV for IL17RE |
| Copy number variations of TissGene across 28 cancer types (X-axis: cancer type and Y-axis: % of CNV samples) (TCGA Gistic2_CopyNumber_Gistic2_all_data_by_genes, Gistic2 copy number data, version 2016-08-16) |
 |
| Top |
| TissGeneFusions for IL17RE |
| Fusion genes including TissGene (ChimerDB 3.0, 2016-12-01 and TCGA fusion Portal 2015-12-01) |
| Database | Src | Cancer type | Sample | Fusion gene | ORF | 5'-gene BP | 3'-gene BP |
| Top |
| TissGeneNet for IL17RE |
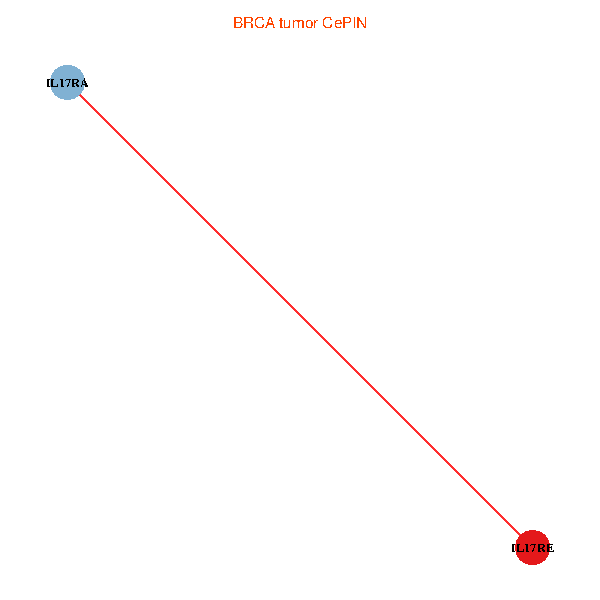
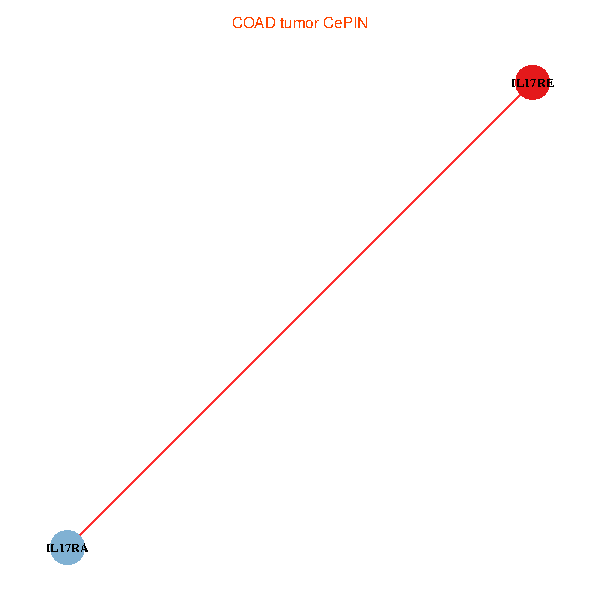
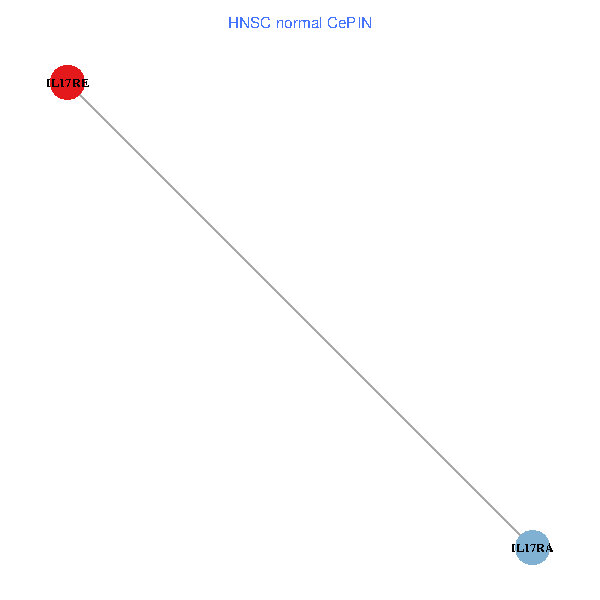
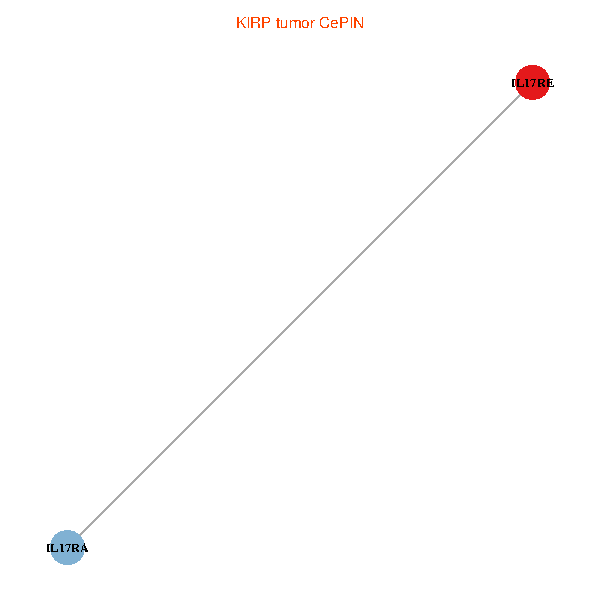
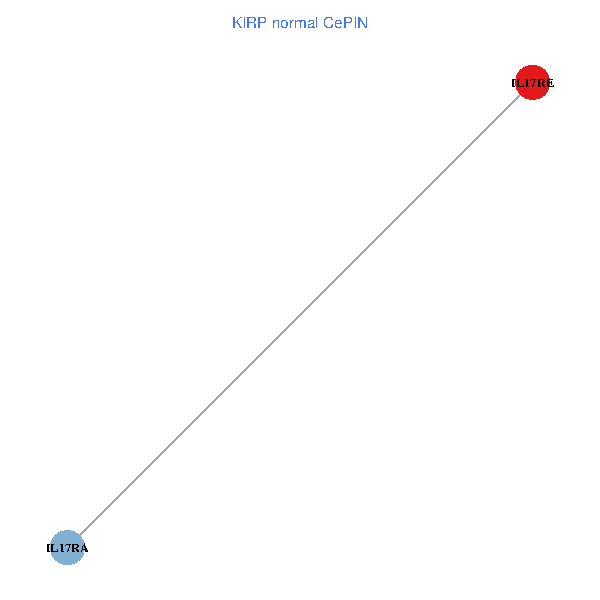
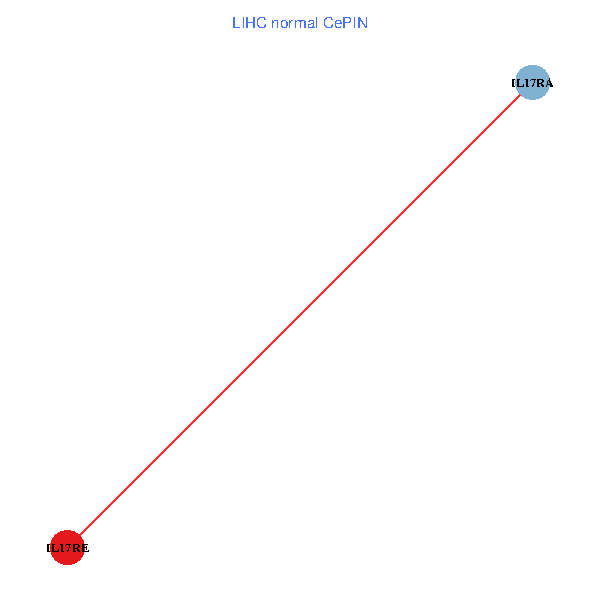
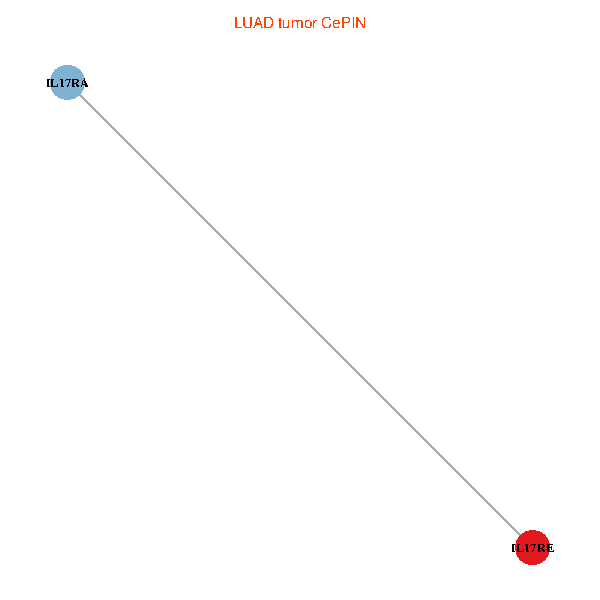
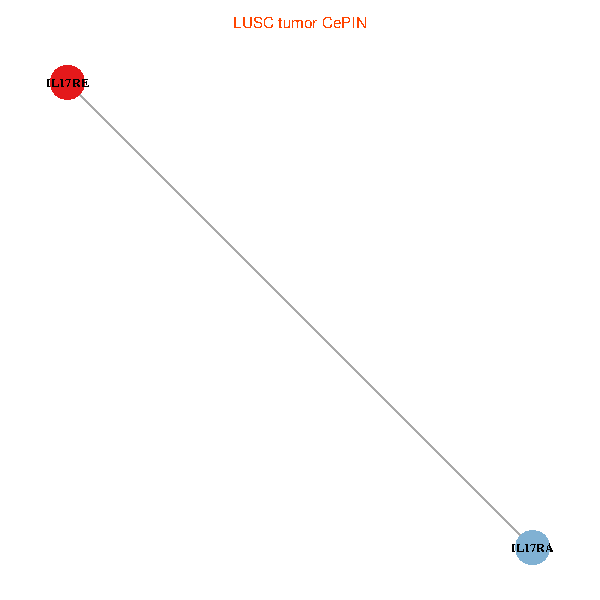
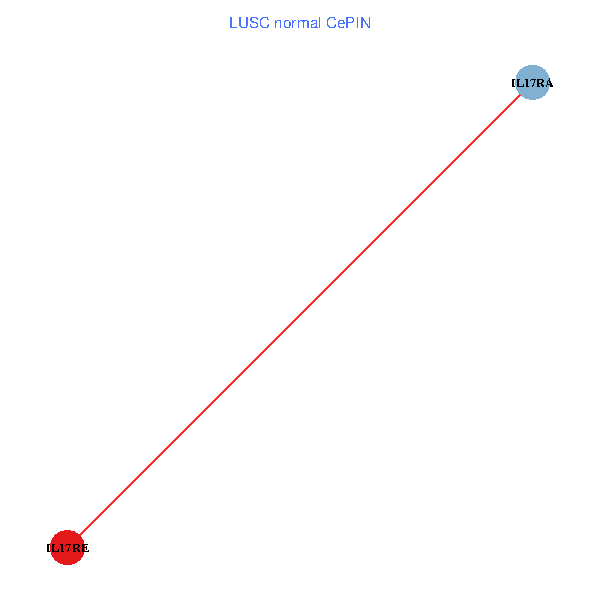
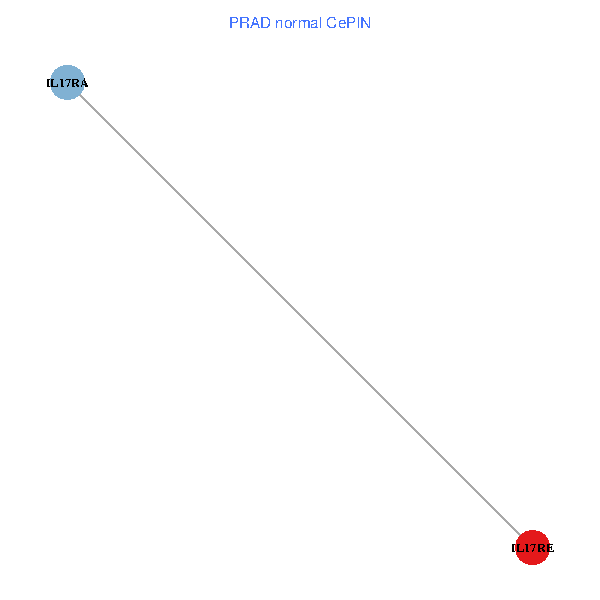
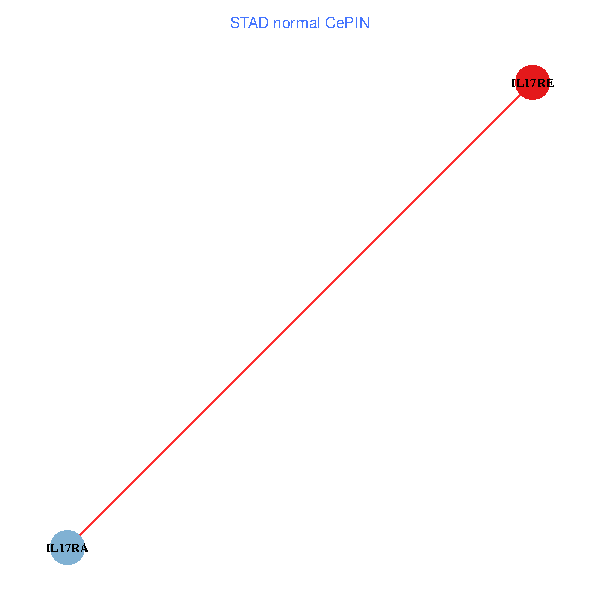
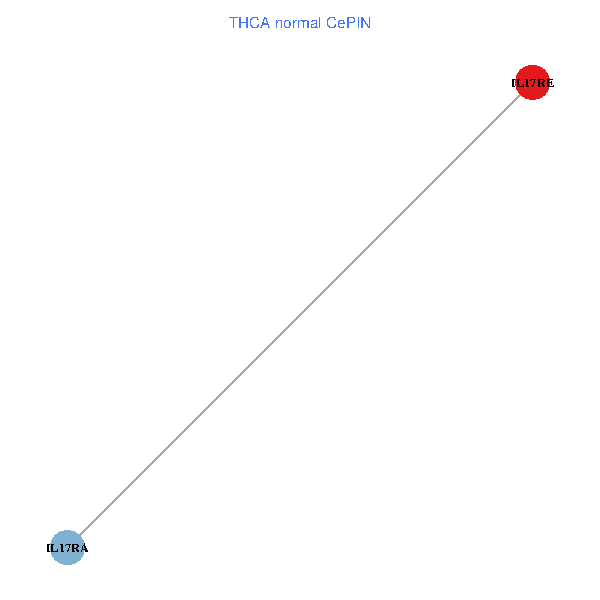
| Co-expressed gene networks based on protein-protein interaction data (CePIN) (TCGA IlluminaHiSeq_RNASeqV2, pan-cancer normalized log2(norm_counts+1) data, version 2016-08-16) (PINA2 ppi data) |
| BRCA (tumor) | BRCA (normal) |
| IL17RE, IL17RA (tumor) | IL17RE, IL17RA (normal) |
 |  |
| COAD (tumor) | COAD (normal) |
| IL17RE, IL17RA (tumor) | IL17RE, IL17RA (normal) |
 |  |
| HNSC (tumor) | HNSC (normal) |
| IL17RE, IL17RA (tumor) | IL17RE, IL17RA (normal) |
 |  |
| KICH (tumor) | KICH (normal) |
| IL17RE, IL17RA (tumor) | IL17RE, IL17RA (normal) |
 |  |
| KIRC (tumor) | KIRC (normal) |
| IL17RE, IL17RA (tumor) | IL17RE, IL17RA (normal) |
 |  |
| KIRP (tumor) | KIRP (normal) |
| IL17RE, IL17RA (tumor) | IL17RE, IL17RA (normal) |
 |  |
| LIHC (tumor) | LIHC (normal) |
| IL17RE, IL17RA (tumor) | IL17RE, IL17RA (normal) |
 |  |
| LUAD (tumor) | LUAD (normal) |
| IL17RE, IL17RA (tumor) | IL17RE, IL17RA (normal) |
 |  |
| LUSC (tumor) | LUSC (normal) |
| IL17RE, IL17RA (tumor) | IL17RE, IL17RA (normal) |
 |  |
| PRAD (tumor) | PRAD (normal) |
| IL17RE, IL17RA (tumor) | IL17RE, IL17RA (normal) |
 |  |
| STAD (tumor) | STAD (normal) |
| IL17RE, IL17RA (tumor) | IL17RE, IL17RA (normal) |
 |  |
| THCA (tumor) | THCA (normal) |
| IL17RE, IL17RA (tumor) | IL17RE, IL17RA (normal) |
 |  |
| Top |
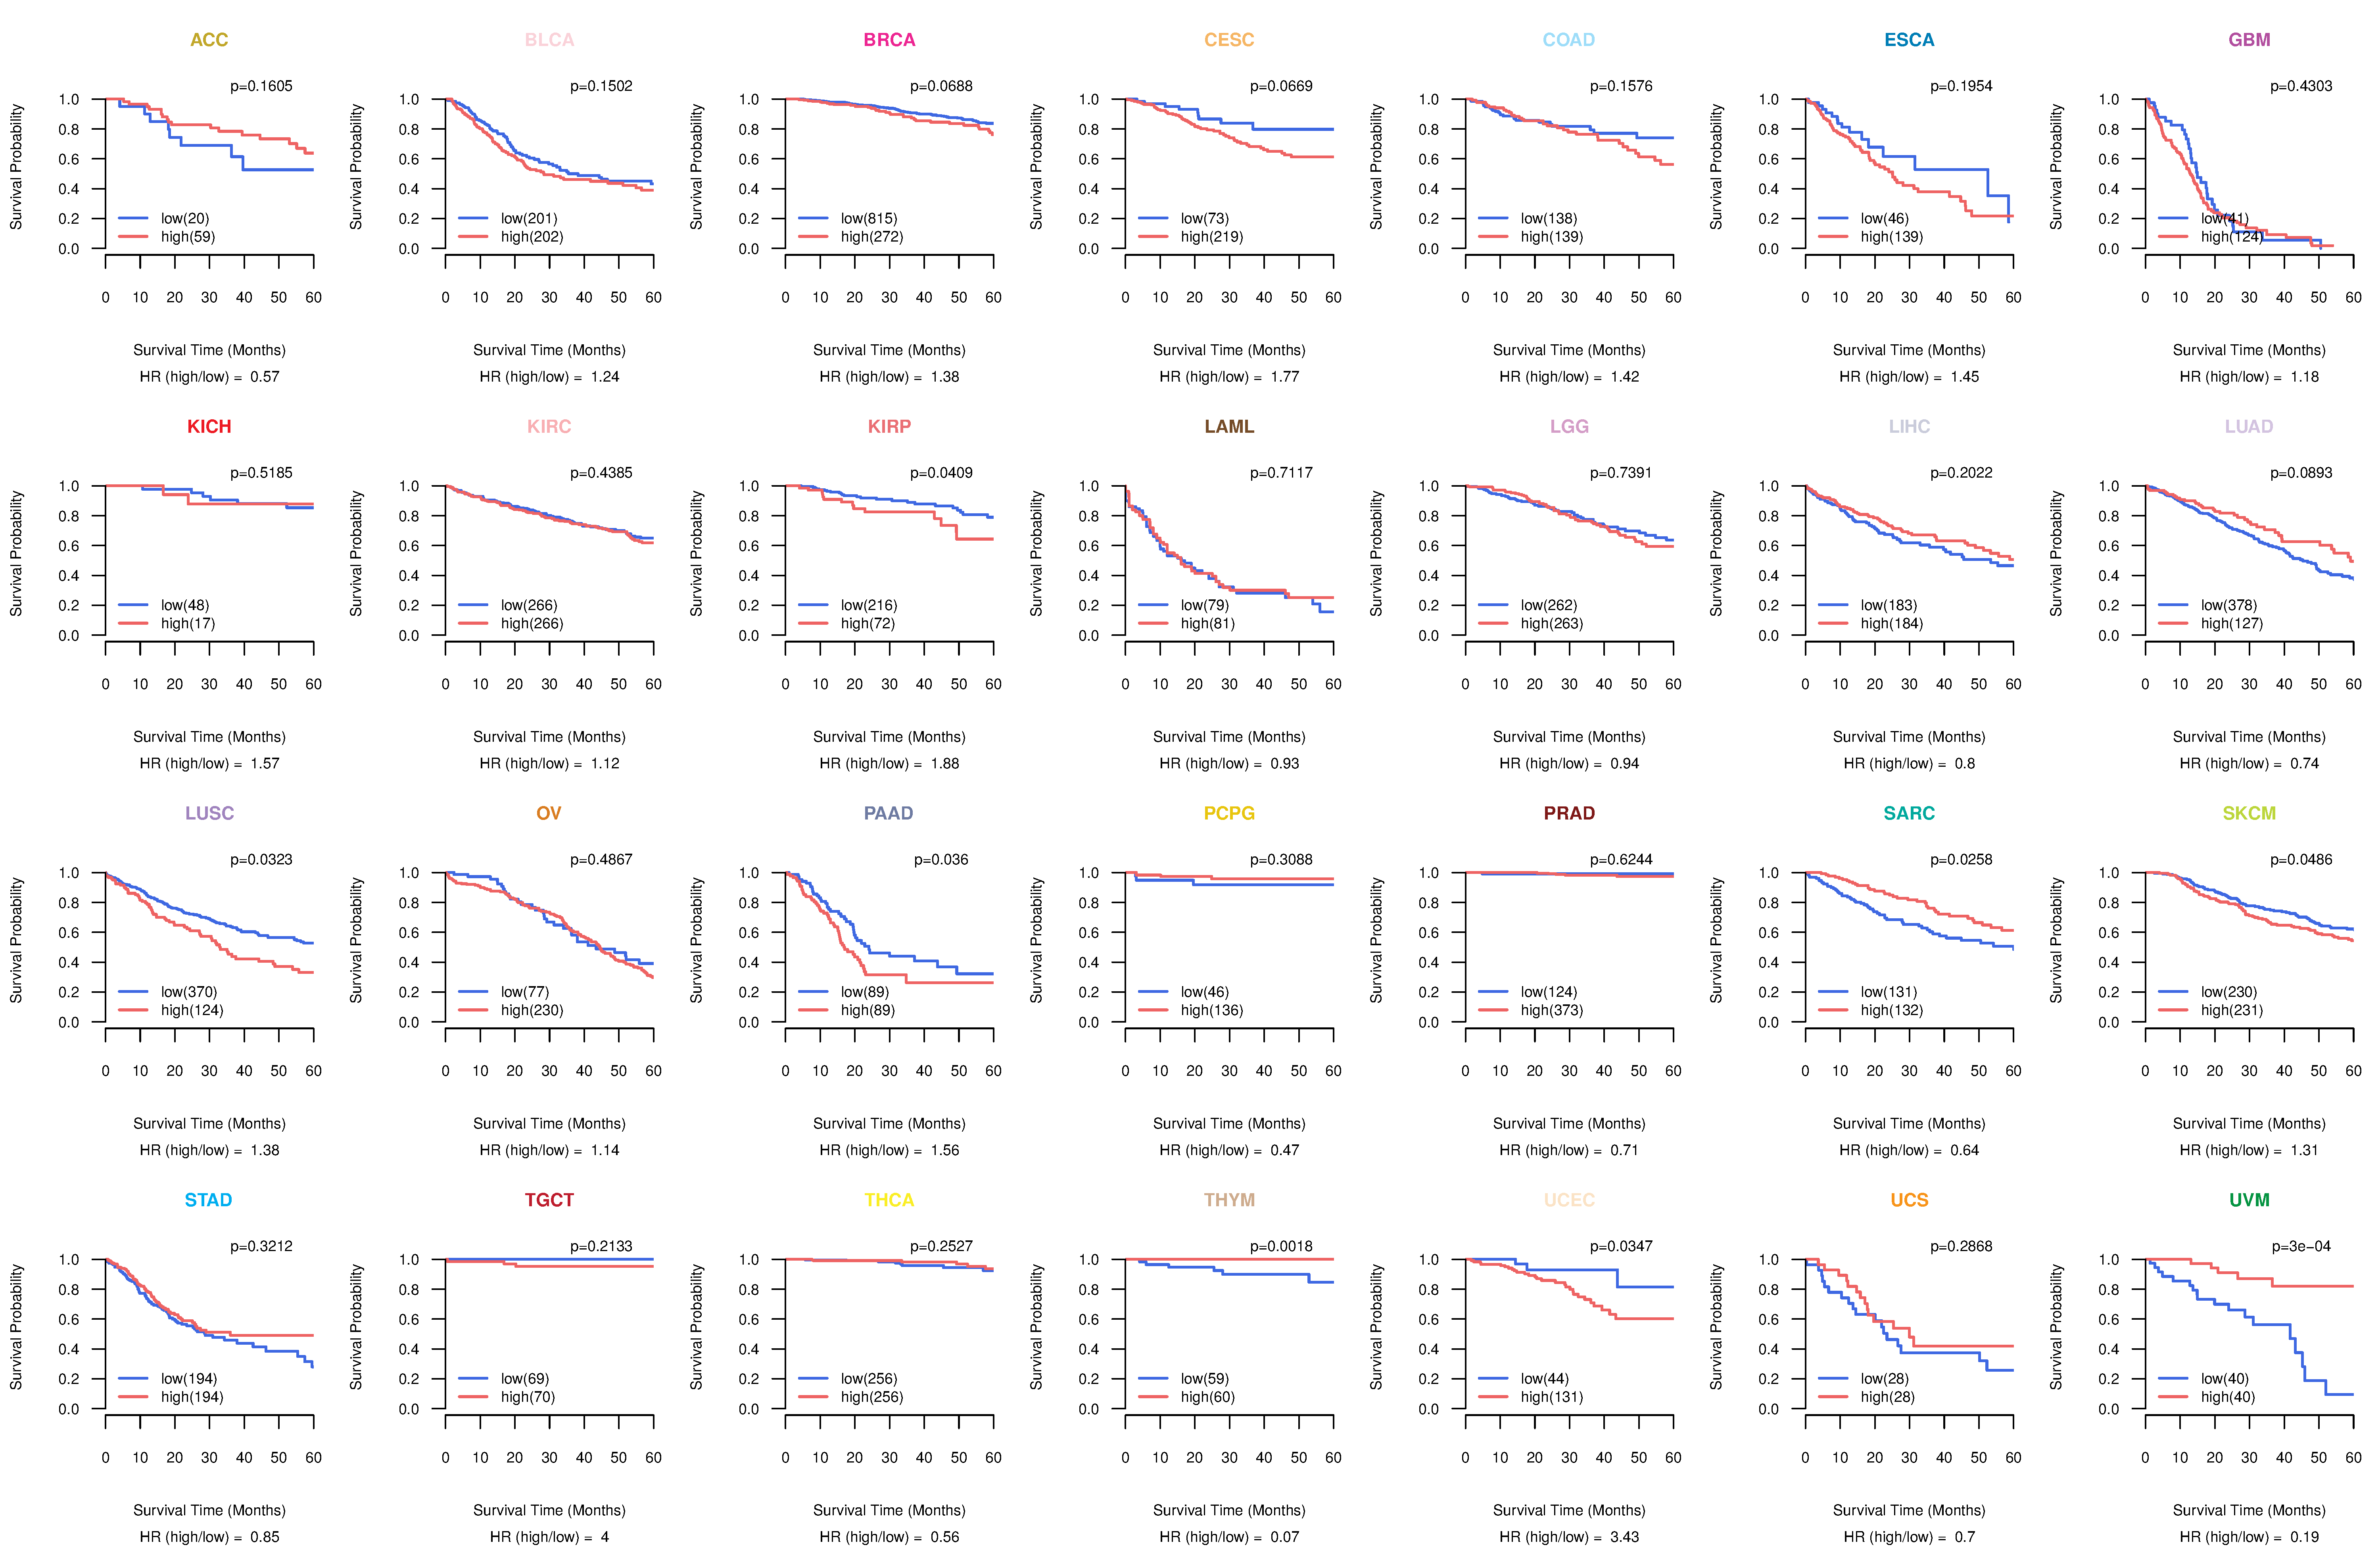
| TissGeneProg for IL17RE |
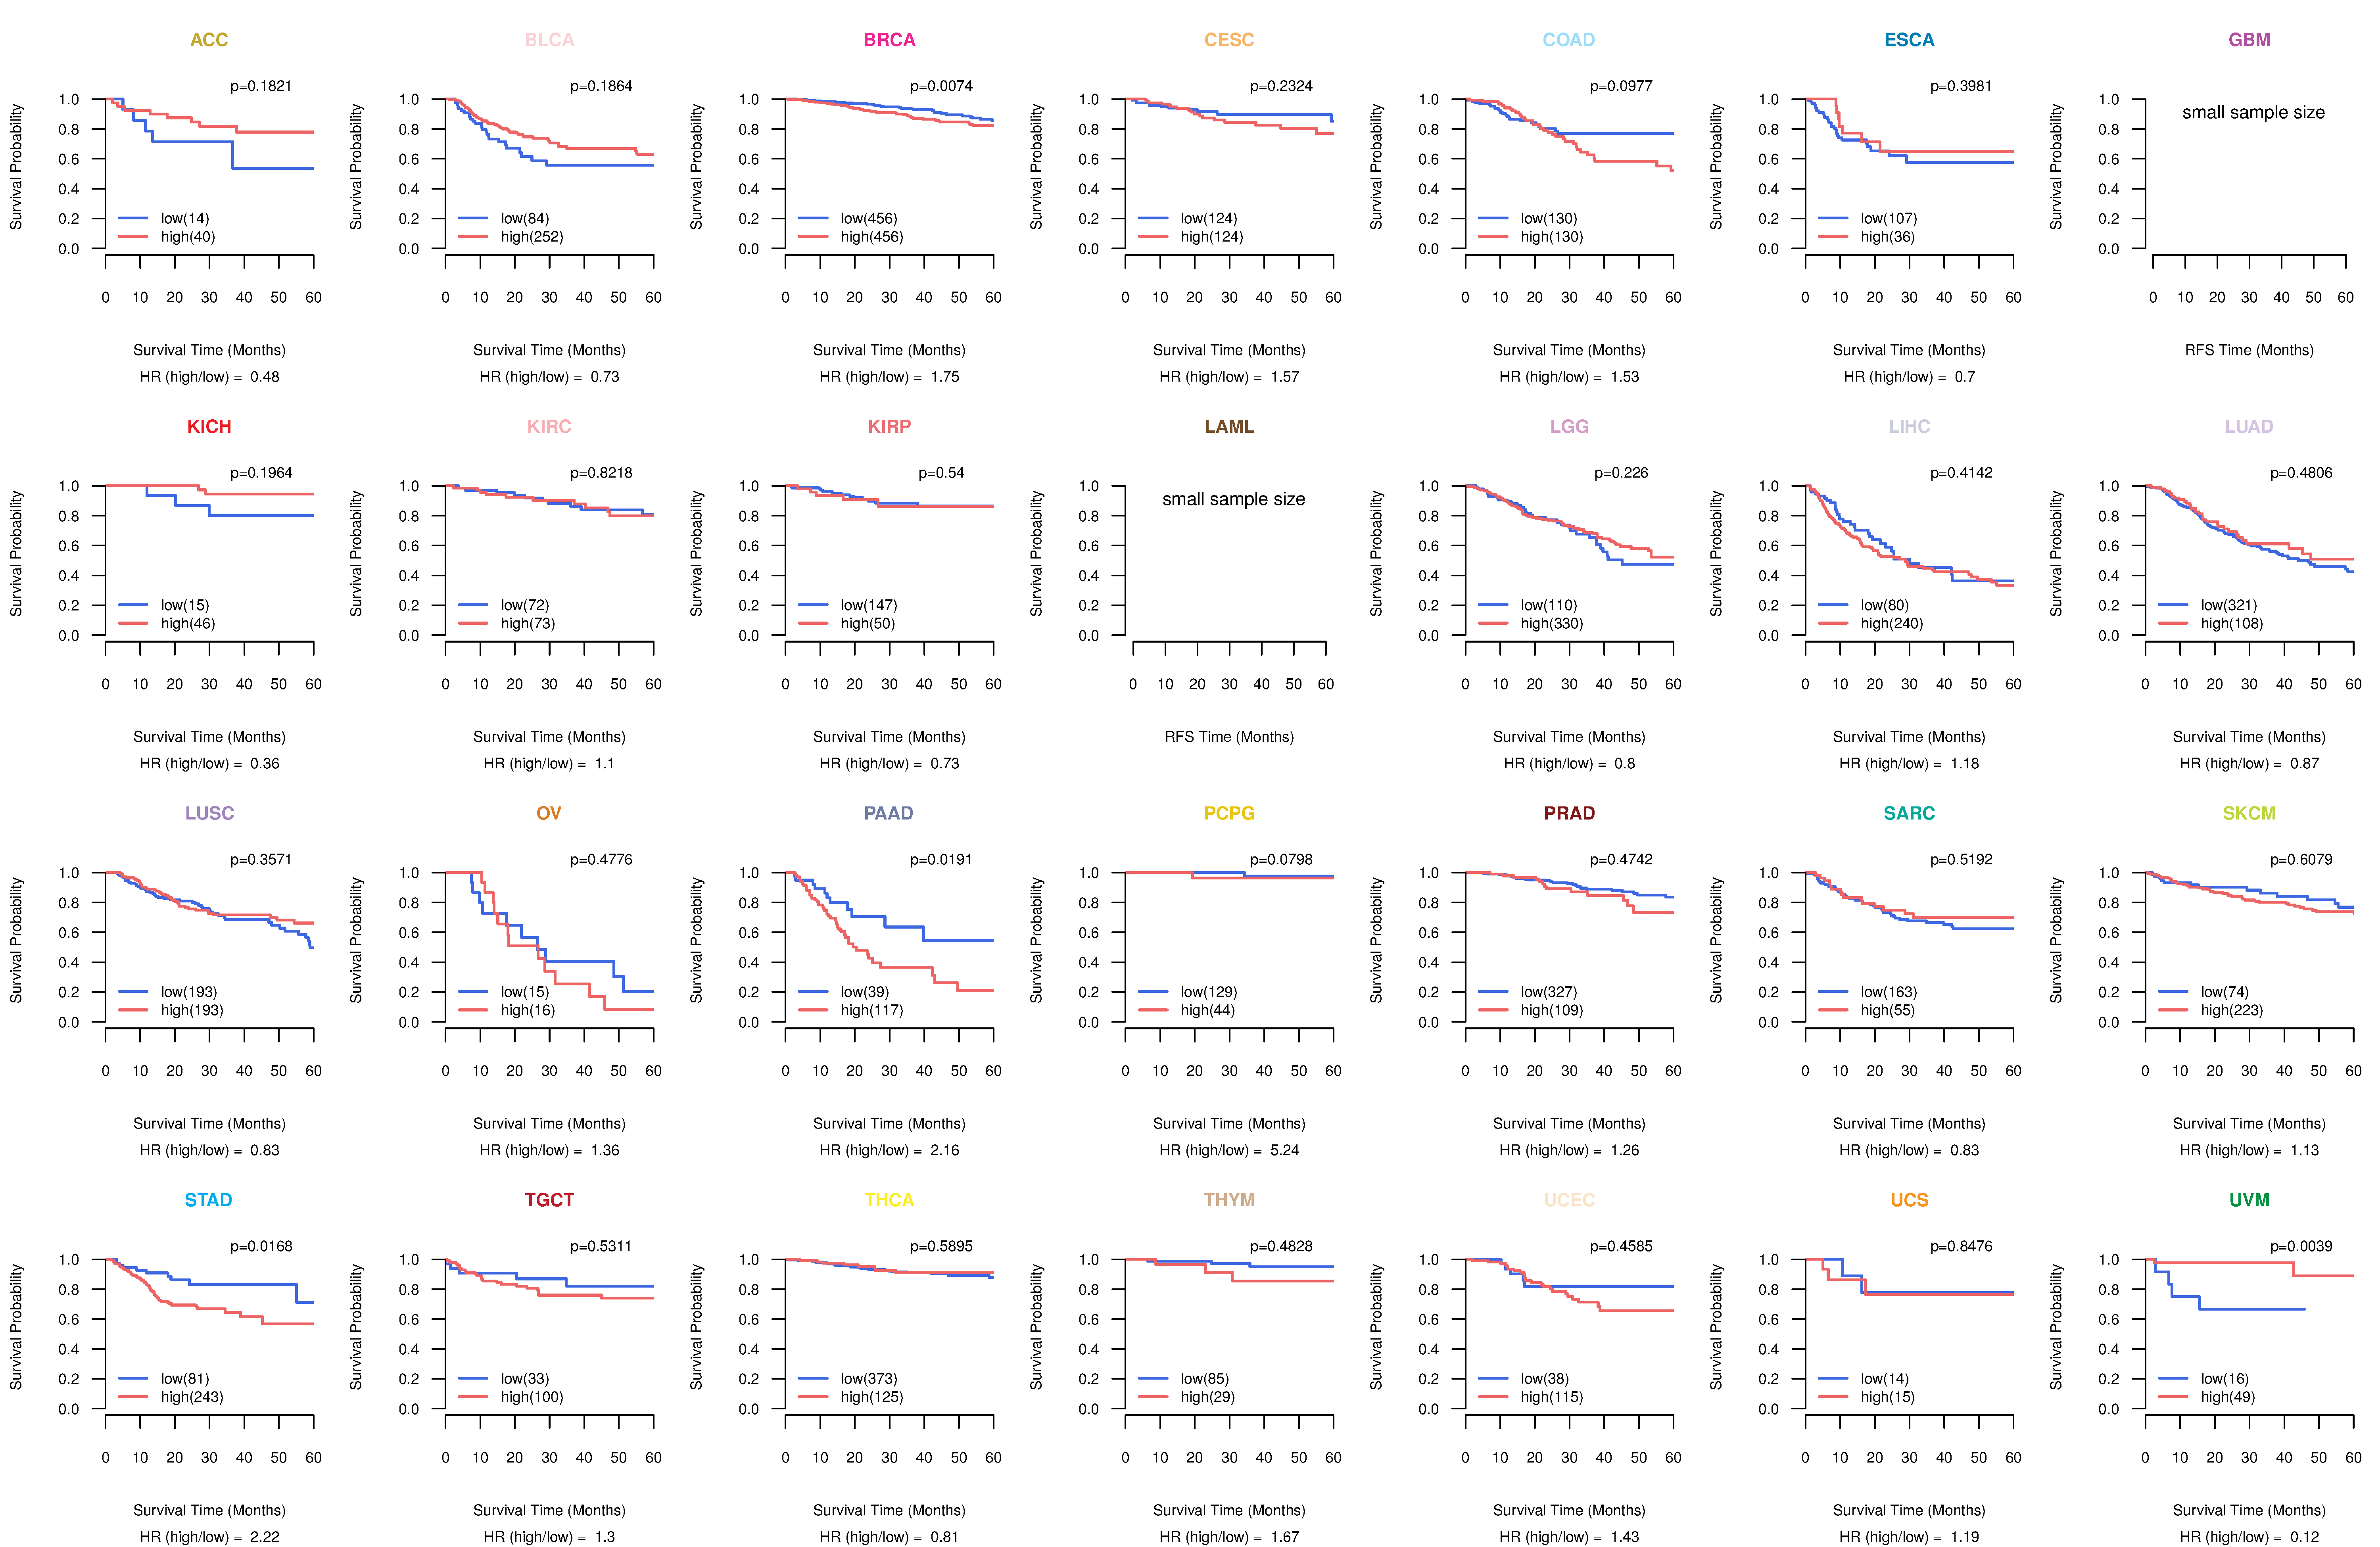
| Kaplan-Meier plots with logrank tests of overall survival (OS) using 28 cancer types (TCGA IlluminaHiSeq_RNASeqV2, pan-cancer normalized log2(norm_counts+1) data, version 2016-08-16) (TCGA clinicalMatrix, phenotype data, version 2016-04-27) * Click on the image to enlarge it in a new window. |
 |
| Kaplan-Meier plots with logrank test of relapse free survival (RFS) using 28 cancer types (TCGA IlluminaHiSeq_RNASeqV2, pan-cancer normalized log2(norm_counts+1) data, version 2016-08-16) (TCGA clinicalMatrix, phenotype data, version 2016-04-27) * Click on the image enlarge it in a new window. |
 |
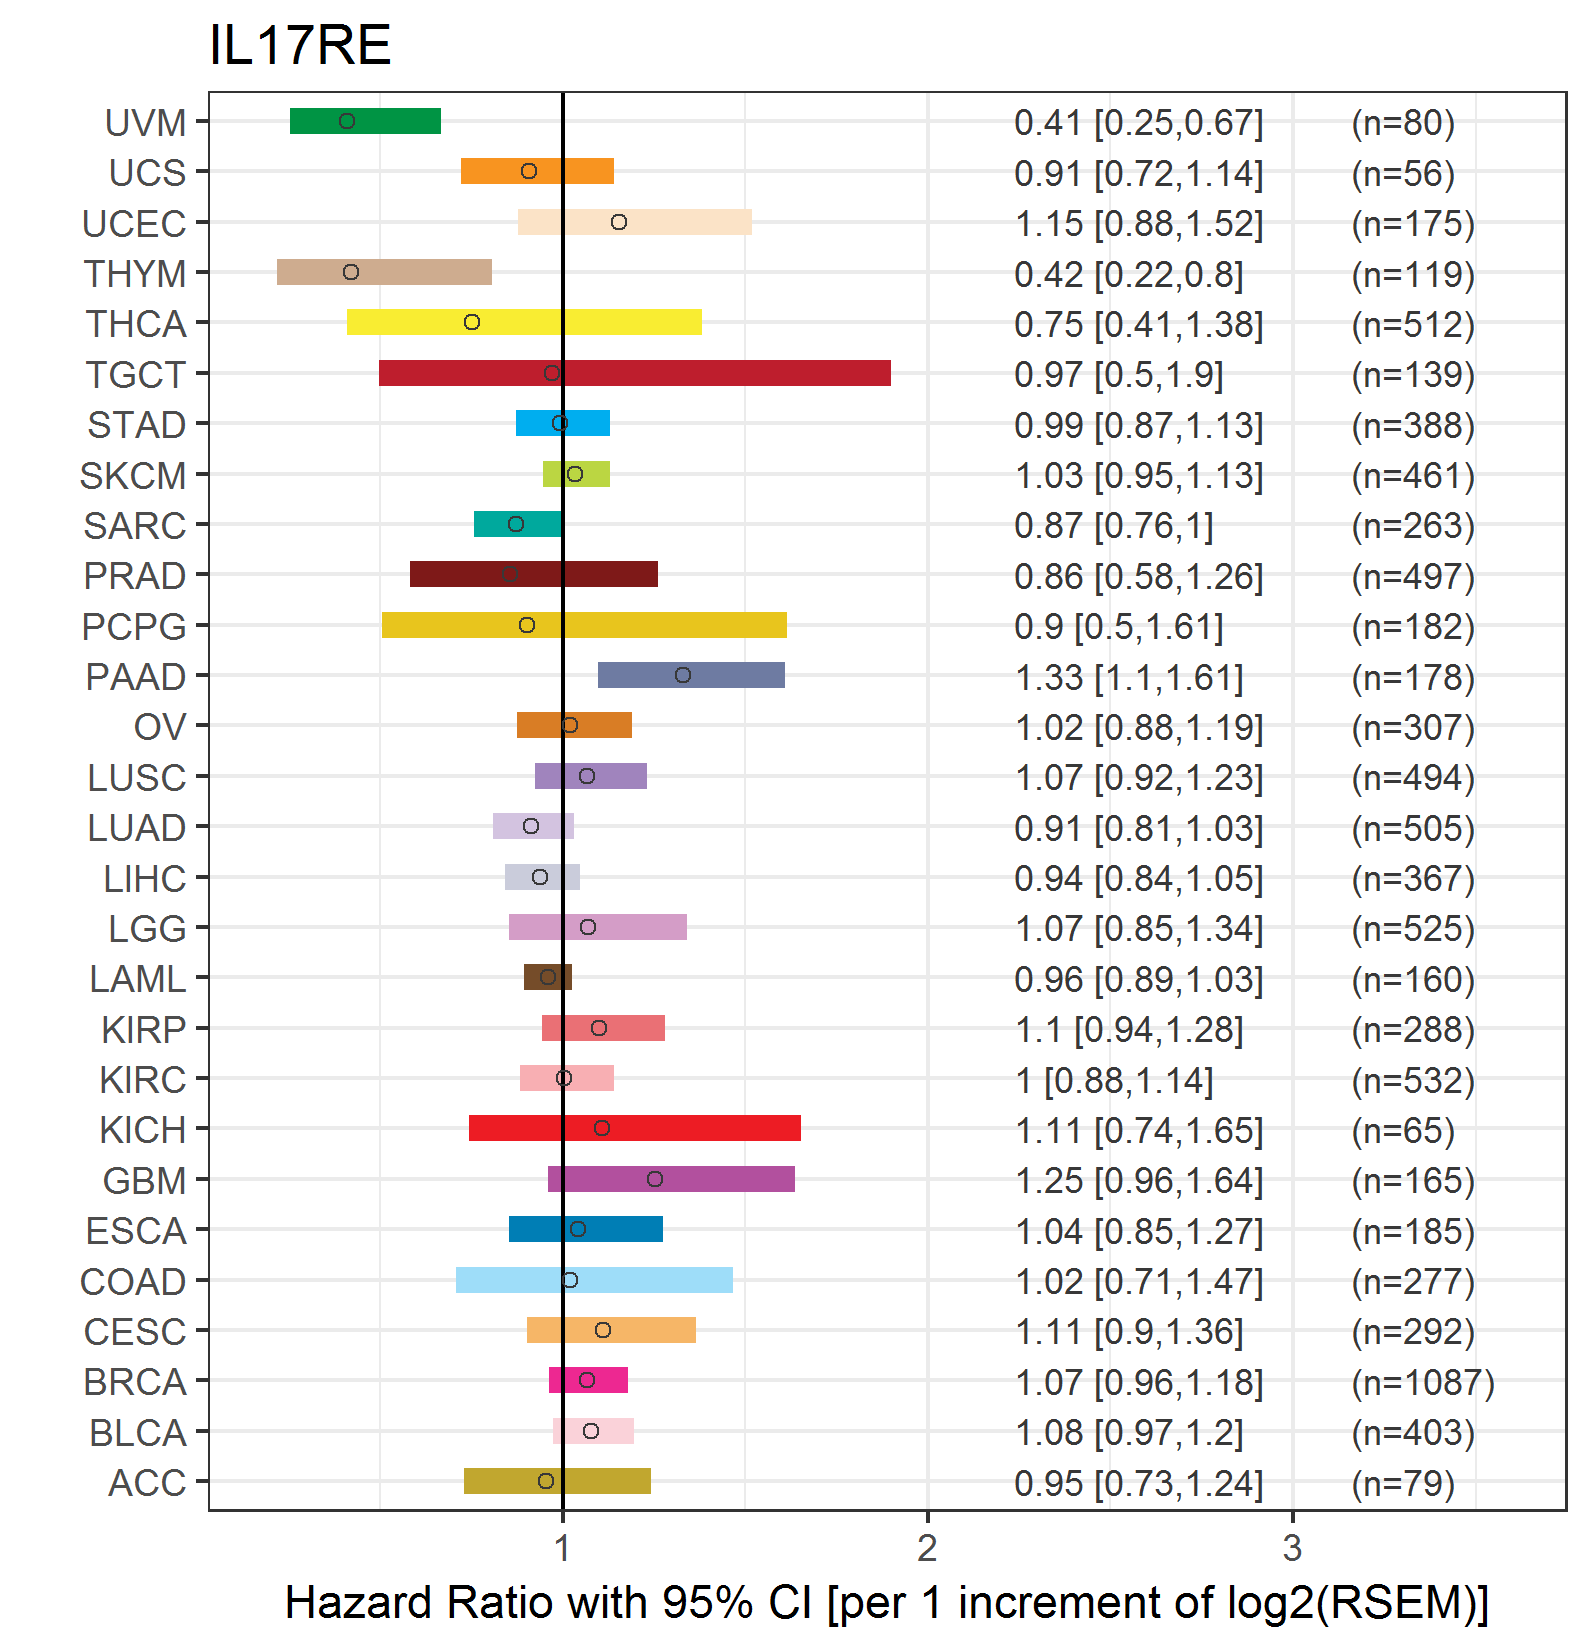
| Forest plot of Cox proportional hazard ratio (HR) and 95% CI of overall survival (OS) using 28 cancer types (TCGA IlluminaHiSeq_RNASeqV2, pan-cancer normalized log2(norm_counts+1) data, version 2016-08-16) (TCGA clinicalMatrix, phenotype data, version 2016-04-27) * Click on the image enlarge it in a new window. |
 |
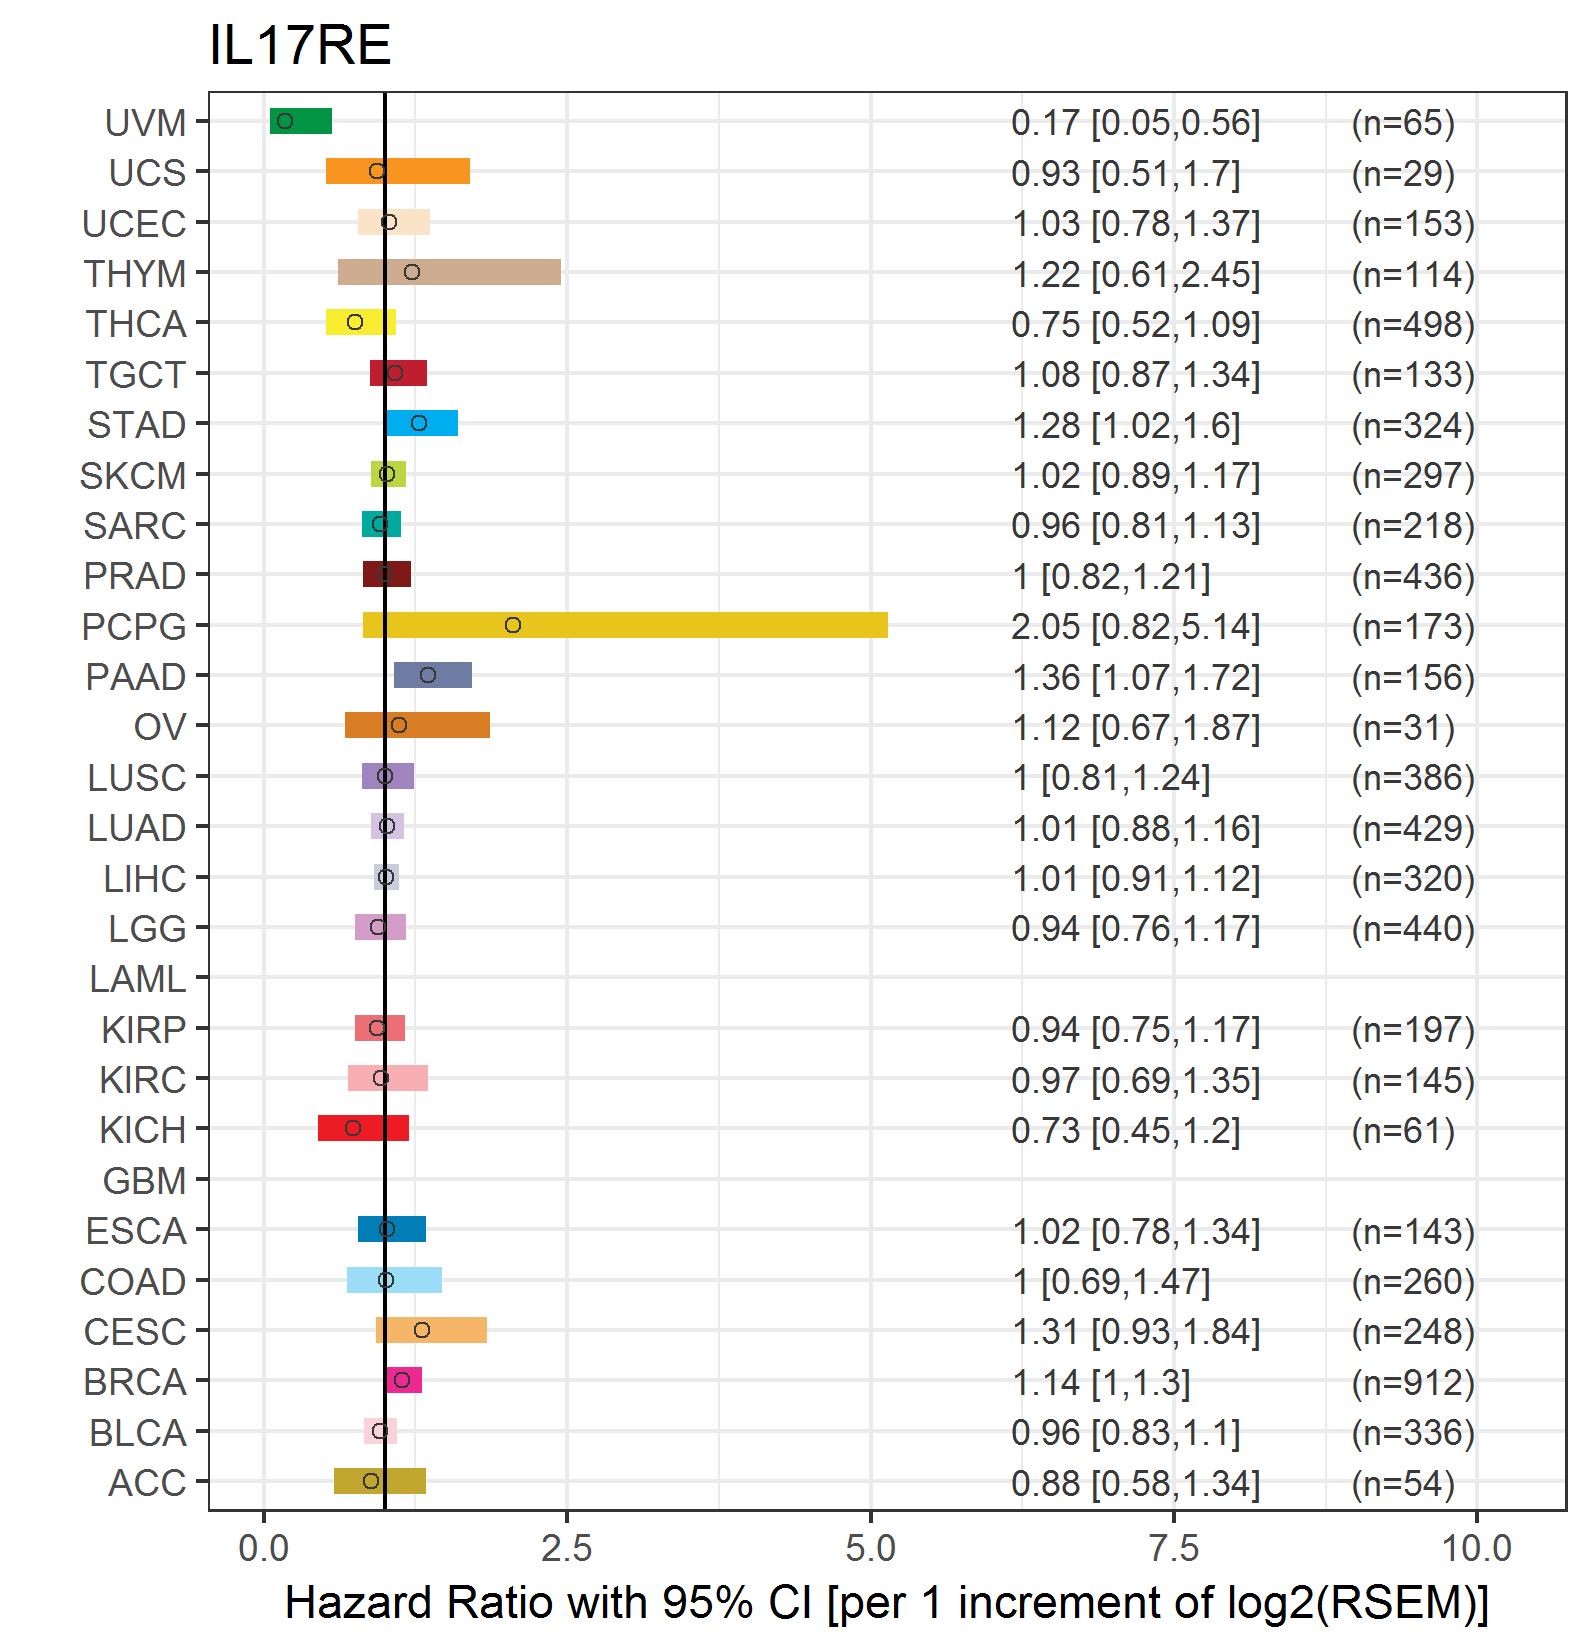
| Forest plot of Cox proportional hazard ratio (HR) and 95% CI of relapse free survival (RFS) using 28 cancer types (TCGA IlluminaHiSeq_RNASeqV2, pan-cancer normalized log2(norm_counts+1) data, version 2016-08-16) (TCGA clinicalMatrix, phenotype data, version 2016-04-27) * Click on the image enlarge it in a new window. |
 |
| Top |
| TissGeneClin for IL17RE |
| TissGeneDrug for IL17RE |
| Drug information targeting TissGene (DrugBank Version 5.0.6, 2017-04-01) |
| DrugBank ID | Drug name | Drug activity | Drug type | Drug status |
| Top |
| TissGeneDisease for IL17RE |
| Disease information associated with TissGene (DisGeNet, 2016-06-01) |
| Disease ID | Disease name | # pubmeds | Source |
| umls:C0002871 | Anemia | 1 | BeFree |
| umls:C0024530 | Malaria | 1 | BeFree |
| umls:C0024535 | Malaria, Falciparum | 1 | GAD |
|
Copyright 2016-Present - The University of Texas Health Science Center at Houston (UTHealth) Web File Viewing | How to Report, Fraud, Waste and Abuse | State of Texas | Statewide Search | Texas Homeland Security | Site Policies |