 |
| |
| |
| |
| |
| |
| |
|

| TissGeneSummary for CPA1 |
 Gene summary Gene summary |
| Basic gene information | Gene symbol | CPA1 |
| Gene name | carboxypeptidase A1 (pancreatic) | |
| Synonyms | CPA | |
| Cytomap | UCSC genome browser: 7q32 | |
| Type of gene | protein-coding | |
| RefGenes | NM_001868.2, | |
| Description | carboxypeptidase A1pancreatic carboxypeptidase A | |
| Modification date | 20141207 | |
| dbXrefs | MIM : 114850 | |
| HGNC : HGNC | ||
| Ensembl : ENSG00000091704 | ||
| HPRD : 00269 | ||
| Vega : OTTHUMG00000157826 | ||
| Protein | UniProt: go to UniProt's Cross Reference DB Table | |
| Expression | CleanEX: HS_CPA1 | |
| BioGPS: 1357 | ||
| Pathway | NCI Pathway Interaction Database: CPA1 | |
| KEGG: CPA1 | ||
| REACTOME: CPA1 | ||
| Pathway Commons: CPA1 | ||
| Context | iHOP: CPA1 | |
| ligand binding site mutation search in PubMed: CPA1 | ||
| UCL Cancer Institute: CPA1 | ||
| Assigned class in TissGDB* | A | |
| Included tissue-specific gene expression resources | HPA,TiGER,GTEx | |
| Specific-tissues in normal samples (assigned by TissGDB using HPA, TiGER, and GTEx) | Pancreas | |
| Cancer types related to the specific-tissues in cancer samples (assigned by TissGDB using TCGA) | PAAD | |
| Reference showing the relevant tissue of CPA1 | Analysis of gene expression on ngn3 gene signaling pathway in endocrine pancreatic cancer. Nagaraja P, Parashivamurthy K, Sidnal N, Mali S, Nagaraja D, Reddy S. Bioinformation. 2013 Aug 7;9(14):739-47. doi: 10.6026/97320630009739. eCollection 2013. (pmid:23976832) go to article | |
| Description by TissGene annotations | TissgsKTS | |
| * Class A consists of genes with literature evidence and is part of the cTissGenes. Class B consists of only cTissGenes without additional evidence. The remaining genes belong to Class C. |
| Gene ontology having evidence of Inferred from Direct Assay (IDA) from Entrez |
| GO ID | GO term | PubMed ID |
| Top |
| TissGeneExp for CPA1 |
| Gene expressions across 28 cancer types (X-axis: cancer type and Y-axis: log2(norm_counts+1)) (TCGA IlluminaHiSeq_RNASeqV2, pan-cancer normalized log2(norm_counts+1) data, version 2016-08-16) |
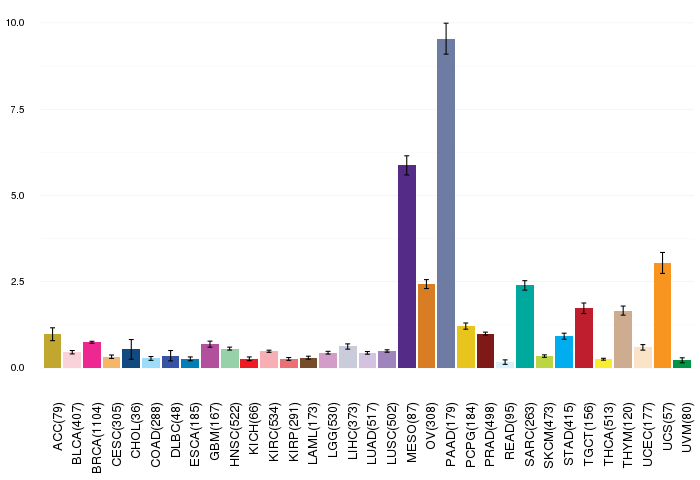 |
| Gene isoform expressions across 28 cancer types (X-axis: cancer type and Y-axis: log2(norm_counts+1)) (TCGA pan-cancer tcga_rsem_isoform_tpm, version 2016-09-01) |
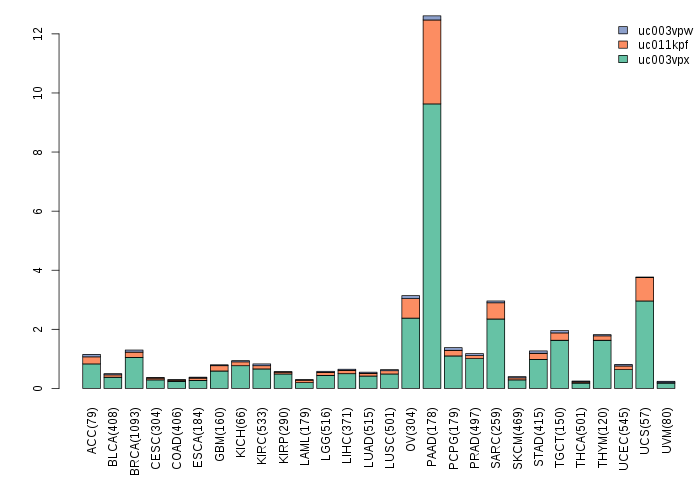 |
| Gene expressions across normal tissues of GTEx data (GTEx GTEx_Analysis_v6_RNA-seq_RNA-SeQCv1.1.8_gene_rpkm.gct) - Here, we shows the matched tissue types only among our 28 cancer types. |
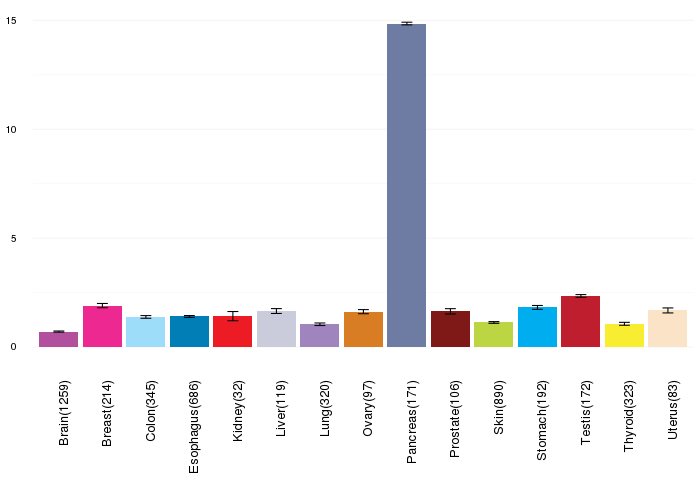 |
| Different expressions across 14 cancer types with more than 10 samples between matched tumors and normals (X-axis: cancer type and Y-axis: log2(norm_counts+1)) (TCGA IlluminaHiSeq_RNASeqV2, pan-cancer normalized log2(norm_counts+1) data, version 2016-08-16) |
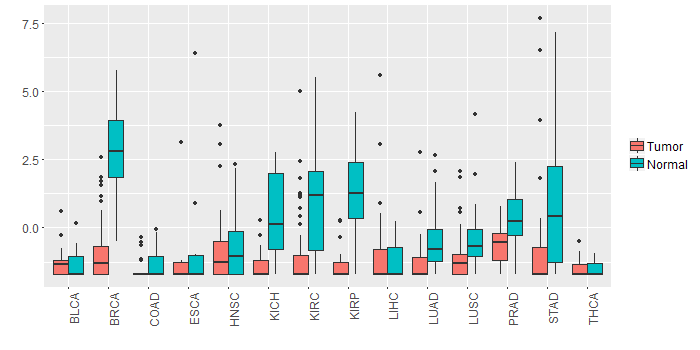 |
| - Significantly differentially expressed cancer types and information. (|Fold change|>1 and FDR<0.05) |
| Cancer type | Mean(exp) in tumor | Mean(exp) in matched normal | Log2FC | P-val. | FDR |
| BRCA | -1.003319306 | 2.900703501 | -3.904022807 | 8.91E-62 | 5.02E-59 |
| KIRC | -1.063983707 | 0.848944071 | -1.912927778 | 4.53E-13 | 1.99E-12 |
| KICH | -1.369937096 | 0.554770904 | -1.924708 | 3.42E-06 | 1.17E-05 |
| KIRP | -1.418085096 | 1.166143029 | -2.584228125 | 9.66E-11 | 1.10E-09 |
| Top |
| TissGene-miRNA for CPA1 |
| Significantly anti-correlated miRNAs of TissGene across 28 cancer types (Gene-miRNA relations from TargetScanHuman Relsease 7.1, Conserved_Site_Context_Scores.txt.zip, 06.01.2016) (TCGA IlluminaHiSeq_miRNASeq, log2(RPM+1) data, version 2016-11-21) (TCGA IlluminaHiSeq_RNASeqV2, log2(normalized_count+1) data, version 2016-08-16) (Spearman’s Rank Correlation (p-value<0.05 and coefficient<-0.25)) |
| Cancer type | miRNA id | miRNA accession | P-val. | Coeff. | # samples |
| Top |
| TissGeneMut for CPA1 |
| TissGeneSNV for CPA1 |
| nsSNV counts per each loci. Different colors of circles represent different cancer types. Circle size denotes number of samples. (TCGA somatic mutation (SNPs and small INDELs) data, version 2016-04-25) * Click on the image to enlarge it in a new window. |
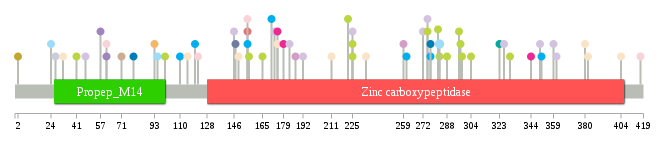 |
 |
| Somatic nucleotide variants of TissGene across 28 cancer types (X-axis: cancer type and Y-axis: % of mutated samples) The numbers in parentheses are numbers of samples with mutation (nsSNVs). (TCGA somatic mutation (SNPs and small INDELs) data, version 2016-04-25) |
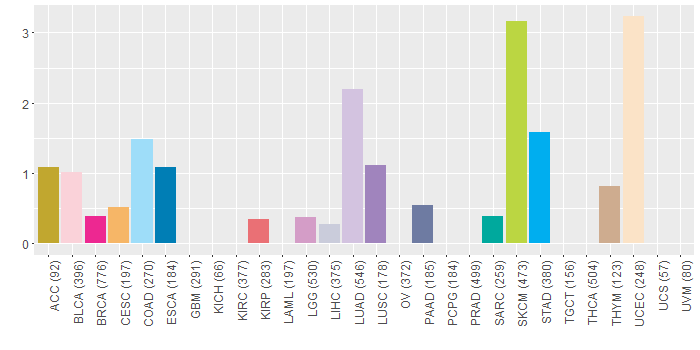 |
| - nsSNVs sorted by frequency. |
| AAchange | Cancer type | # samples |
| p.E283K | COAD | 2 |
| p.Q24X | COAD | 1 |
| p.F192L | LUAD | 1 |
| p.G277S | STAD | 1 |
| p.G277D | ESCA | 1 |
| p.R155C | KIRP | 1 |
| p.R2Q | ACC | 1 |
| p.R110Q | READ | 1 |
| p.D115N | UCEC | 1 |
| p.Y275H | SKCM | 1 |
| p.S361I | LUAD | 1 |
| p.Y122H | BLCA | 1 |
| p.R382W | UCEC | 1 |
| p.D291H | HNSC | 1 |
| p.S61F | LUSC | 1 |
| p.D211N | UCEC | 1 |
| p.A57S | LUSC | 1 |
| p.E41K | SKCM | 1 |
| p.V93M | CESC | 1 |
| p.Y275* | LUAD | 1 |
| p.S272L | LUAD | 1 |
| p.E283K | SKCM | 1 |
| p.G225S | SKCM | 1 |
| p.W183* | LUAD | 1 |
| p.G351D | STAD | 1 |
| p.S304F | SKCM | 1 |
| p.Q359E | LUAD | 1 |
| p.S288F | SKCM | 1 |
| p.Q147H | PAAD | 1 |
| p.S95L | COAD | 1 |
| p.H417Y | BLCA | 1 |
| p.R155H | BLCA | 1 |
| p.N222S | SKCM | 1 |
| p.Q326K | LUAD | 1 |
| p.G297R | SKCM | 1 |
| p.E100K | SKCM | 1 |
| p.G149D | UCEC | 1 |
| p.A259T | LGG | 1 |
| p.S61F | BLCA | 1 |
| p.D32N | UCEC | 1 |
| p.G225D | SKCM | 1 |
| p.R110Q | STAD | 1 |
| p.W404* | UCEC | 1 |
| p.F261L | STAD | 1 |
| p.V323I | SARC | 1 |
| p.Y350C | LUAD | 1 |
| p.A171S | STAD | 1 |
| p.W173S | LUAD | 1 |
| p.G165R | SKCM | 1 |
| p.H296Y | SKCM | 1 |
| p.R155H | STAD | 1 |
| p.S71N | THYM | 1 |
| p.P156S | SKCM | 1 |
| p.L79V | ESCA | 1 |
| p.H47Y | LUAD | 1 |
| p.I146T | LUAD | 1 |
| p.R234H | UCEC | 1 |
| p.A120V | STAD | 1 |
| p.H179R | BRCA | 1 |
| p.D175N | UCEC | 1 |
| p.R27P | LIHC | 1 |
| p.G225C | LUAD | 1 |
| p.S282F | SKCM | 1 |
| p.R27Q | READ | 1 |
| p.N298Y | SKCM | 1 |
| p.E380K | UCEC | 1 |
| p.D175N | BRCA | 1 |
| p.Y344C | BRCA | 1 |
| p.A187V | LGG | 1 |
| p.D330N | SKCM | 1 |
| Top |
| TissGeneCNV for CPA1 |
| Copy number variations of TissGene across 28 cancer types (X-axis: cancer type and Y-axis: % of CNV samples) (TCGA Gistic2_CopyNumber_Gistic2_all_data_by_genes, Gistic2 copy number data, version 2016-08-16) |
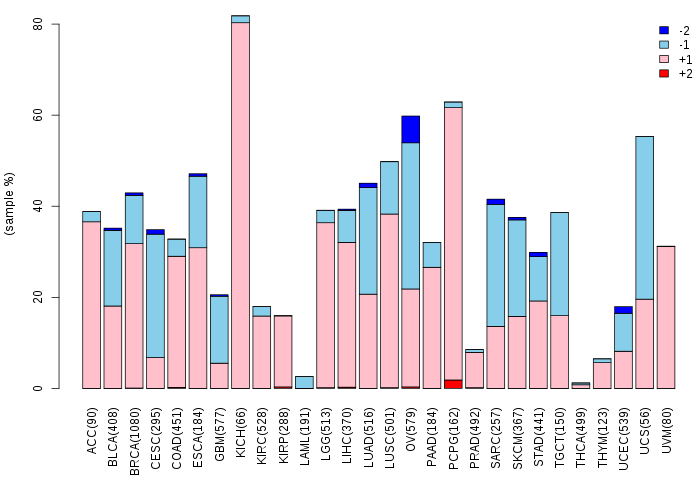 |
| Top |
| TissGeneFusions for CPA1 |
| Fusion genes including TissGene (ChimerDB 3.0, 2016-12-01 and TCGA fusion Portal 2015-12-01) |
| Database | Src | Cancer type | Sample | Fusion gene | ORF | 5'-gene BP | 3'-gene BP |
| Chimerdb3.0 | ChiTaRs | NA | W40131 | CPA1-CPA1 | chr7:130023587 | chr7:130023582 |
| Top |
| TissGeneNet for CPA1 |
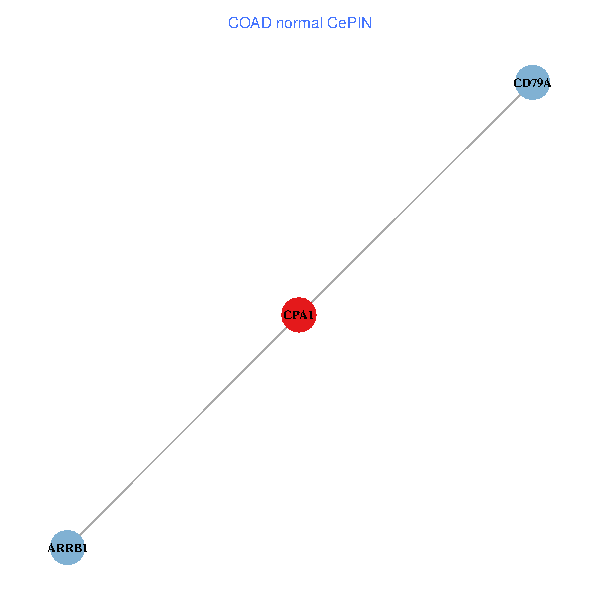
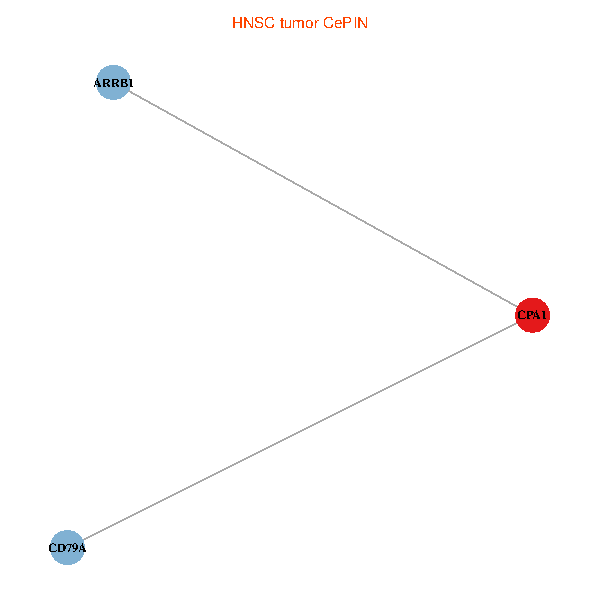
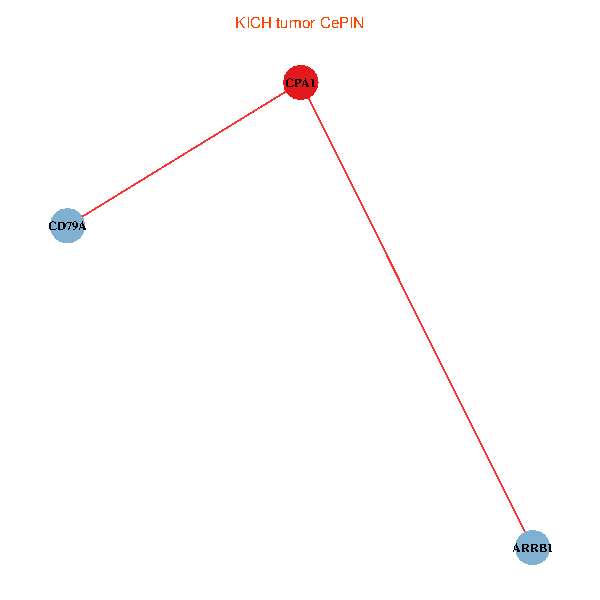
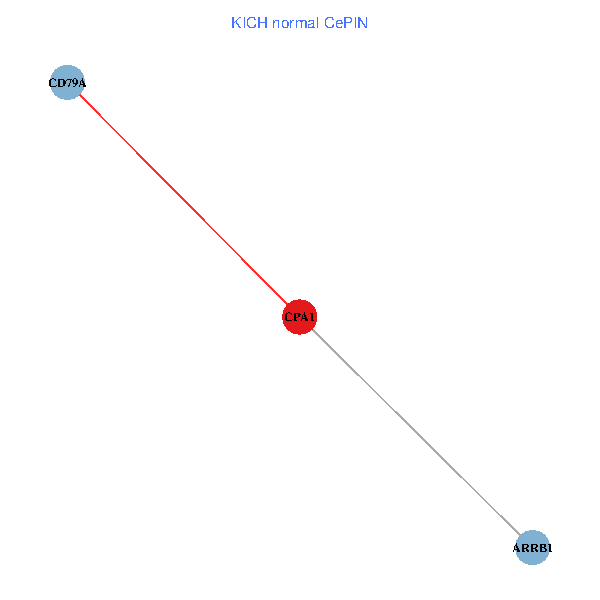
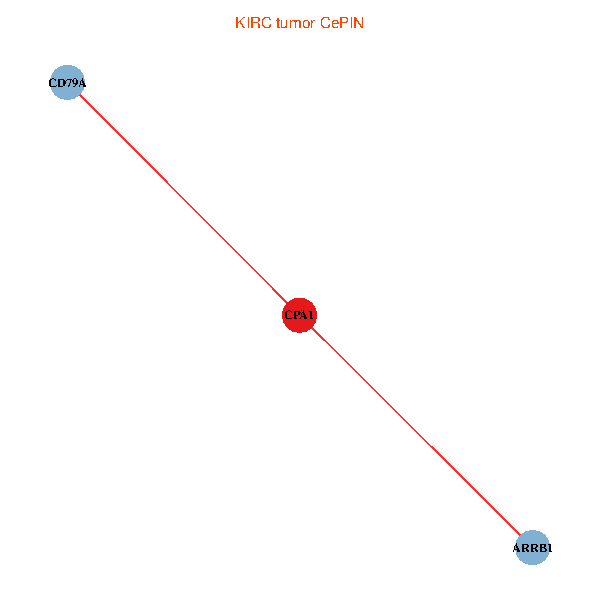
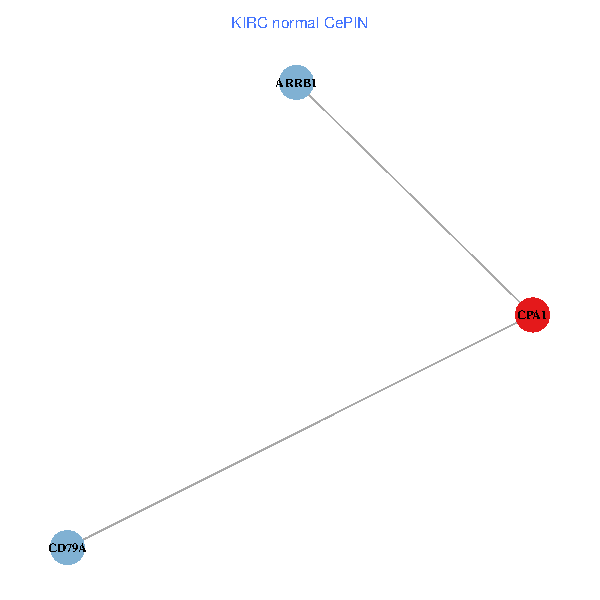
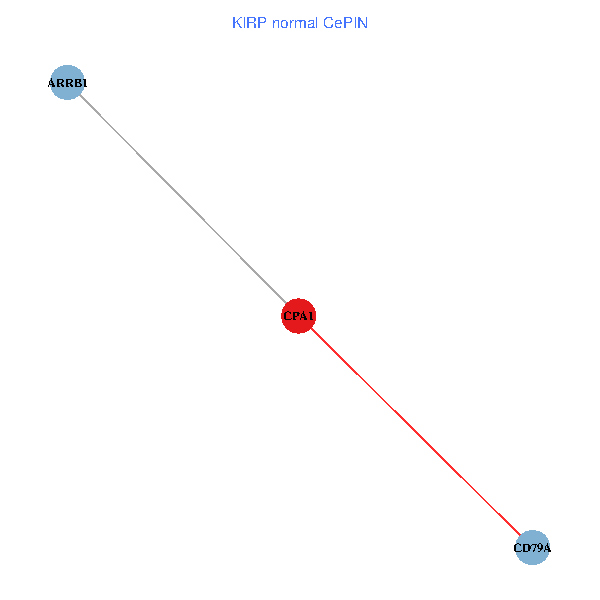
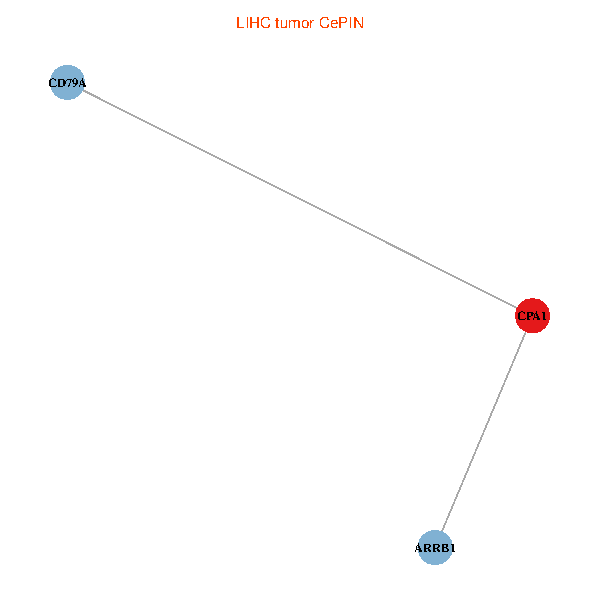
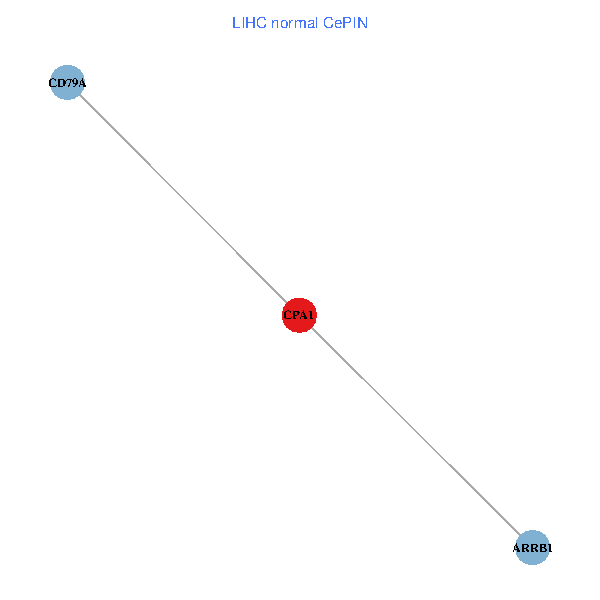
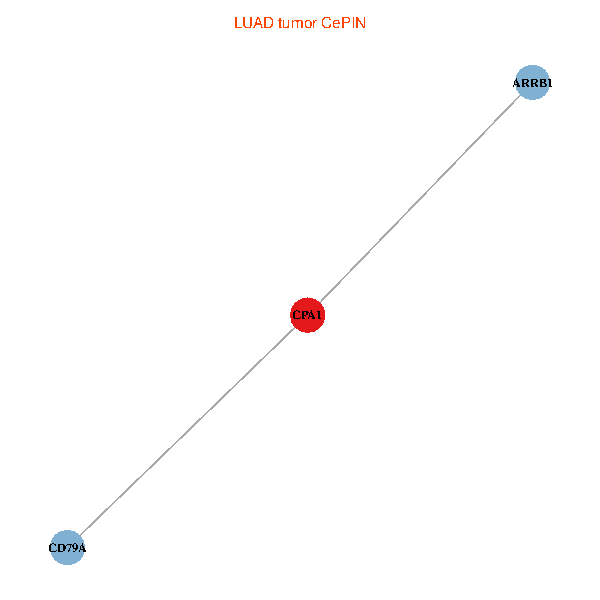
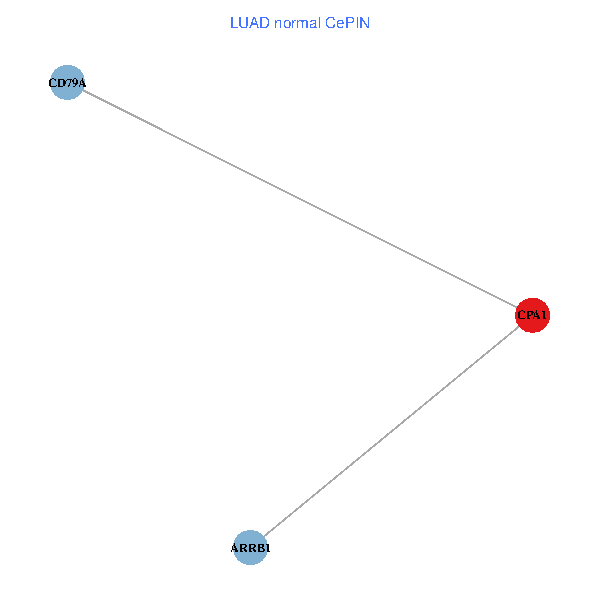
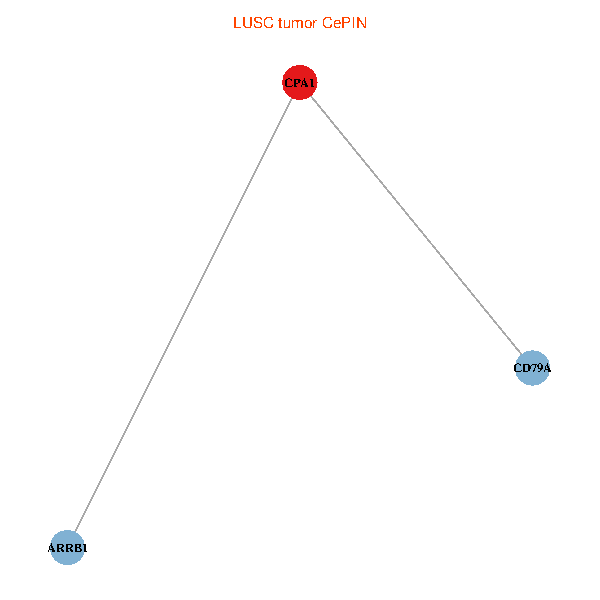
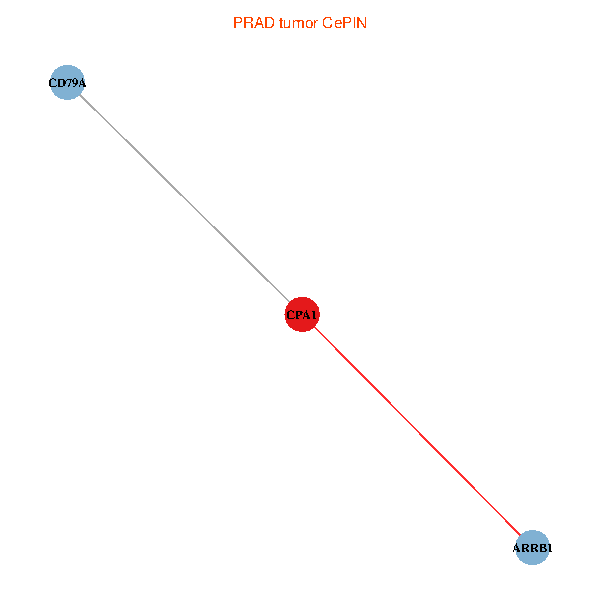
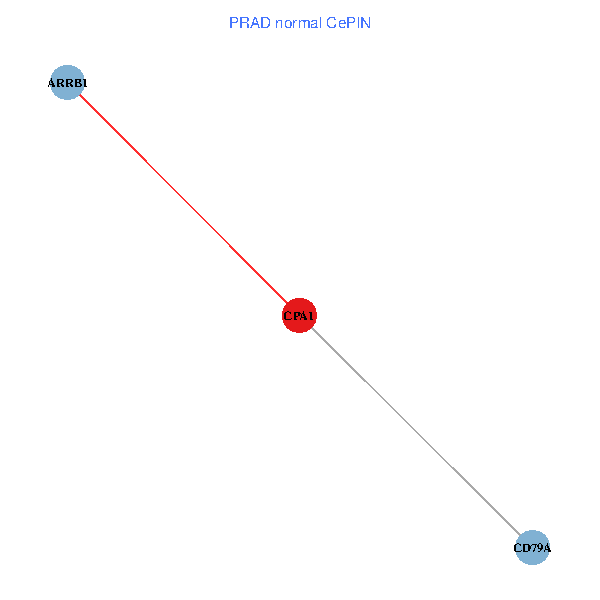
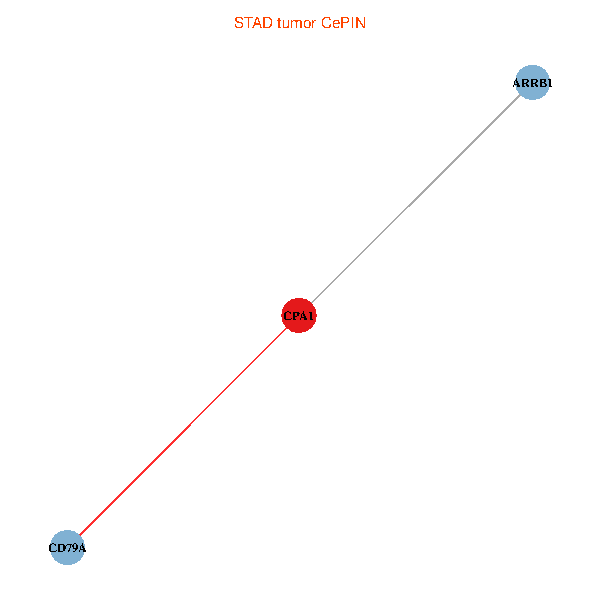
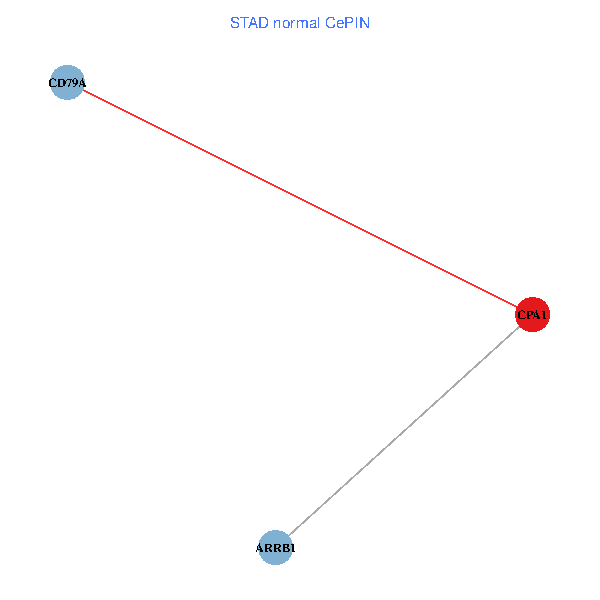
| Co-expressed gene networks based on protein-protein interaction data (CePIN) (TCGA IlluminaHiSeq_RNASeqV2, pan-cancer normalized log2(norm_counts+1) data, version 2016-08-16) (PINA2 ppi data) |
| BRCA (tumor) | BRCA (normal) |
| CPA1, CD79A, ARRB1 (tumor) | CPA1, CD79A, ARRB1 (normal) |
 | 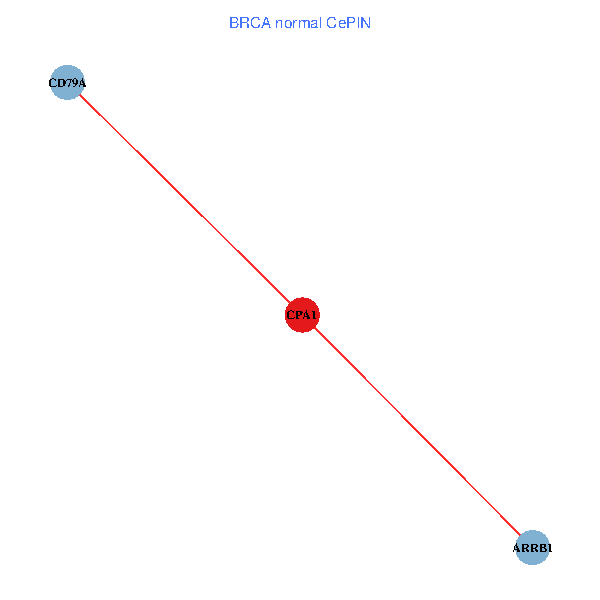 |
| COAD (tumor) | COAD (normal) |
| CPA1, CD79A, ARRB1 (tumor) | CPA1, CD79A, ARRB1 (normal) |
 |  |
| HNSC (tumor) | HNSC (normal) |
| CPA1, CD79A, ARRB1 (tumor) | CPA1, CD79A, ARRB1 (normal) |
 |  |
| KICH (tumor) | KICH (normal) |
| CPA1, CD79A, ARRB1 (tumor) | CPA1, CD79A, ARRB1 (normal) |
 |  |
| KIRC (tumor) | KIRC (normal) |
| CPA1, CD79A, ARRB1 (tumor) | CPA1, CD79A, ARRB1 (normal) |
 |  |
| KIRP (tumor) | KIRP (normal) |
| CPA1, CD79A, ARRB1 (tumor) | CPA1, CD79A, ARRB1 (normal) |
 |  |
| LIHC (tumor) | LIHC (normal) |
| CPA1, CD79A, ARRB1 (tumor) | CPA1, CD79A, ARRB1 (normal) |
 |  |
| LUAD (tumor) | LUAD (normal) |
| CPA1, CD79A, ARRB1 (tumor) | CPA1, CD79A, ARRB1 (normal) |
 |  |
| LUSC (tumor) | LUSC (normal) |
| CPA1, CD79A, ARRB1 (tumor) | CPA1, CD79A, ARRB1 (normal) |
 |  |
| PRAD (tumor) | PRAD (normal) |
| CPA1, CD79A, ARRB1 (tumor) | CPA1, CD79A, ARRB1 (normal) |
 |  |
| STAD (tumor) | STAD (normal) |
| CPA1, CD79A, ARRB1 (tumor) | CPA1, CD79A, ARRB1 (normal) |
 |  |
| THCA (tumor) | THCA (normal) |
| CPA1, CD79A, ARRB1 (tumor) | CPA1, CD79A, ARRB1 (normal) |
 |  |
| Top |
| TissGeneProg for CPA1 |
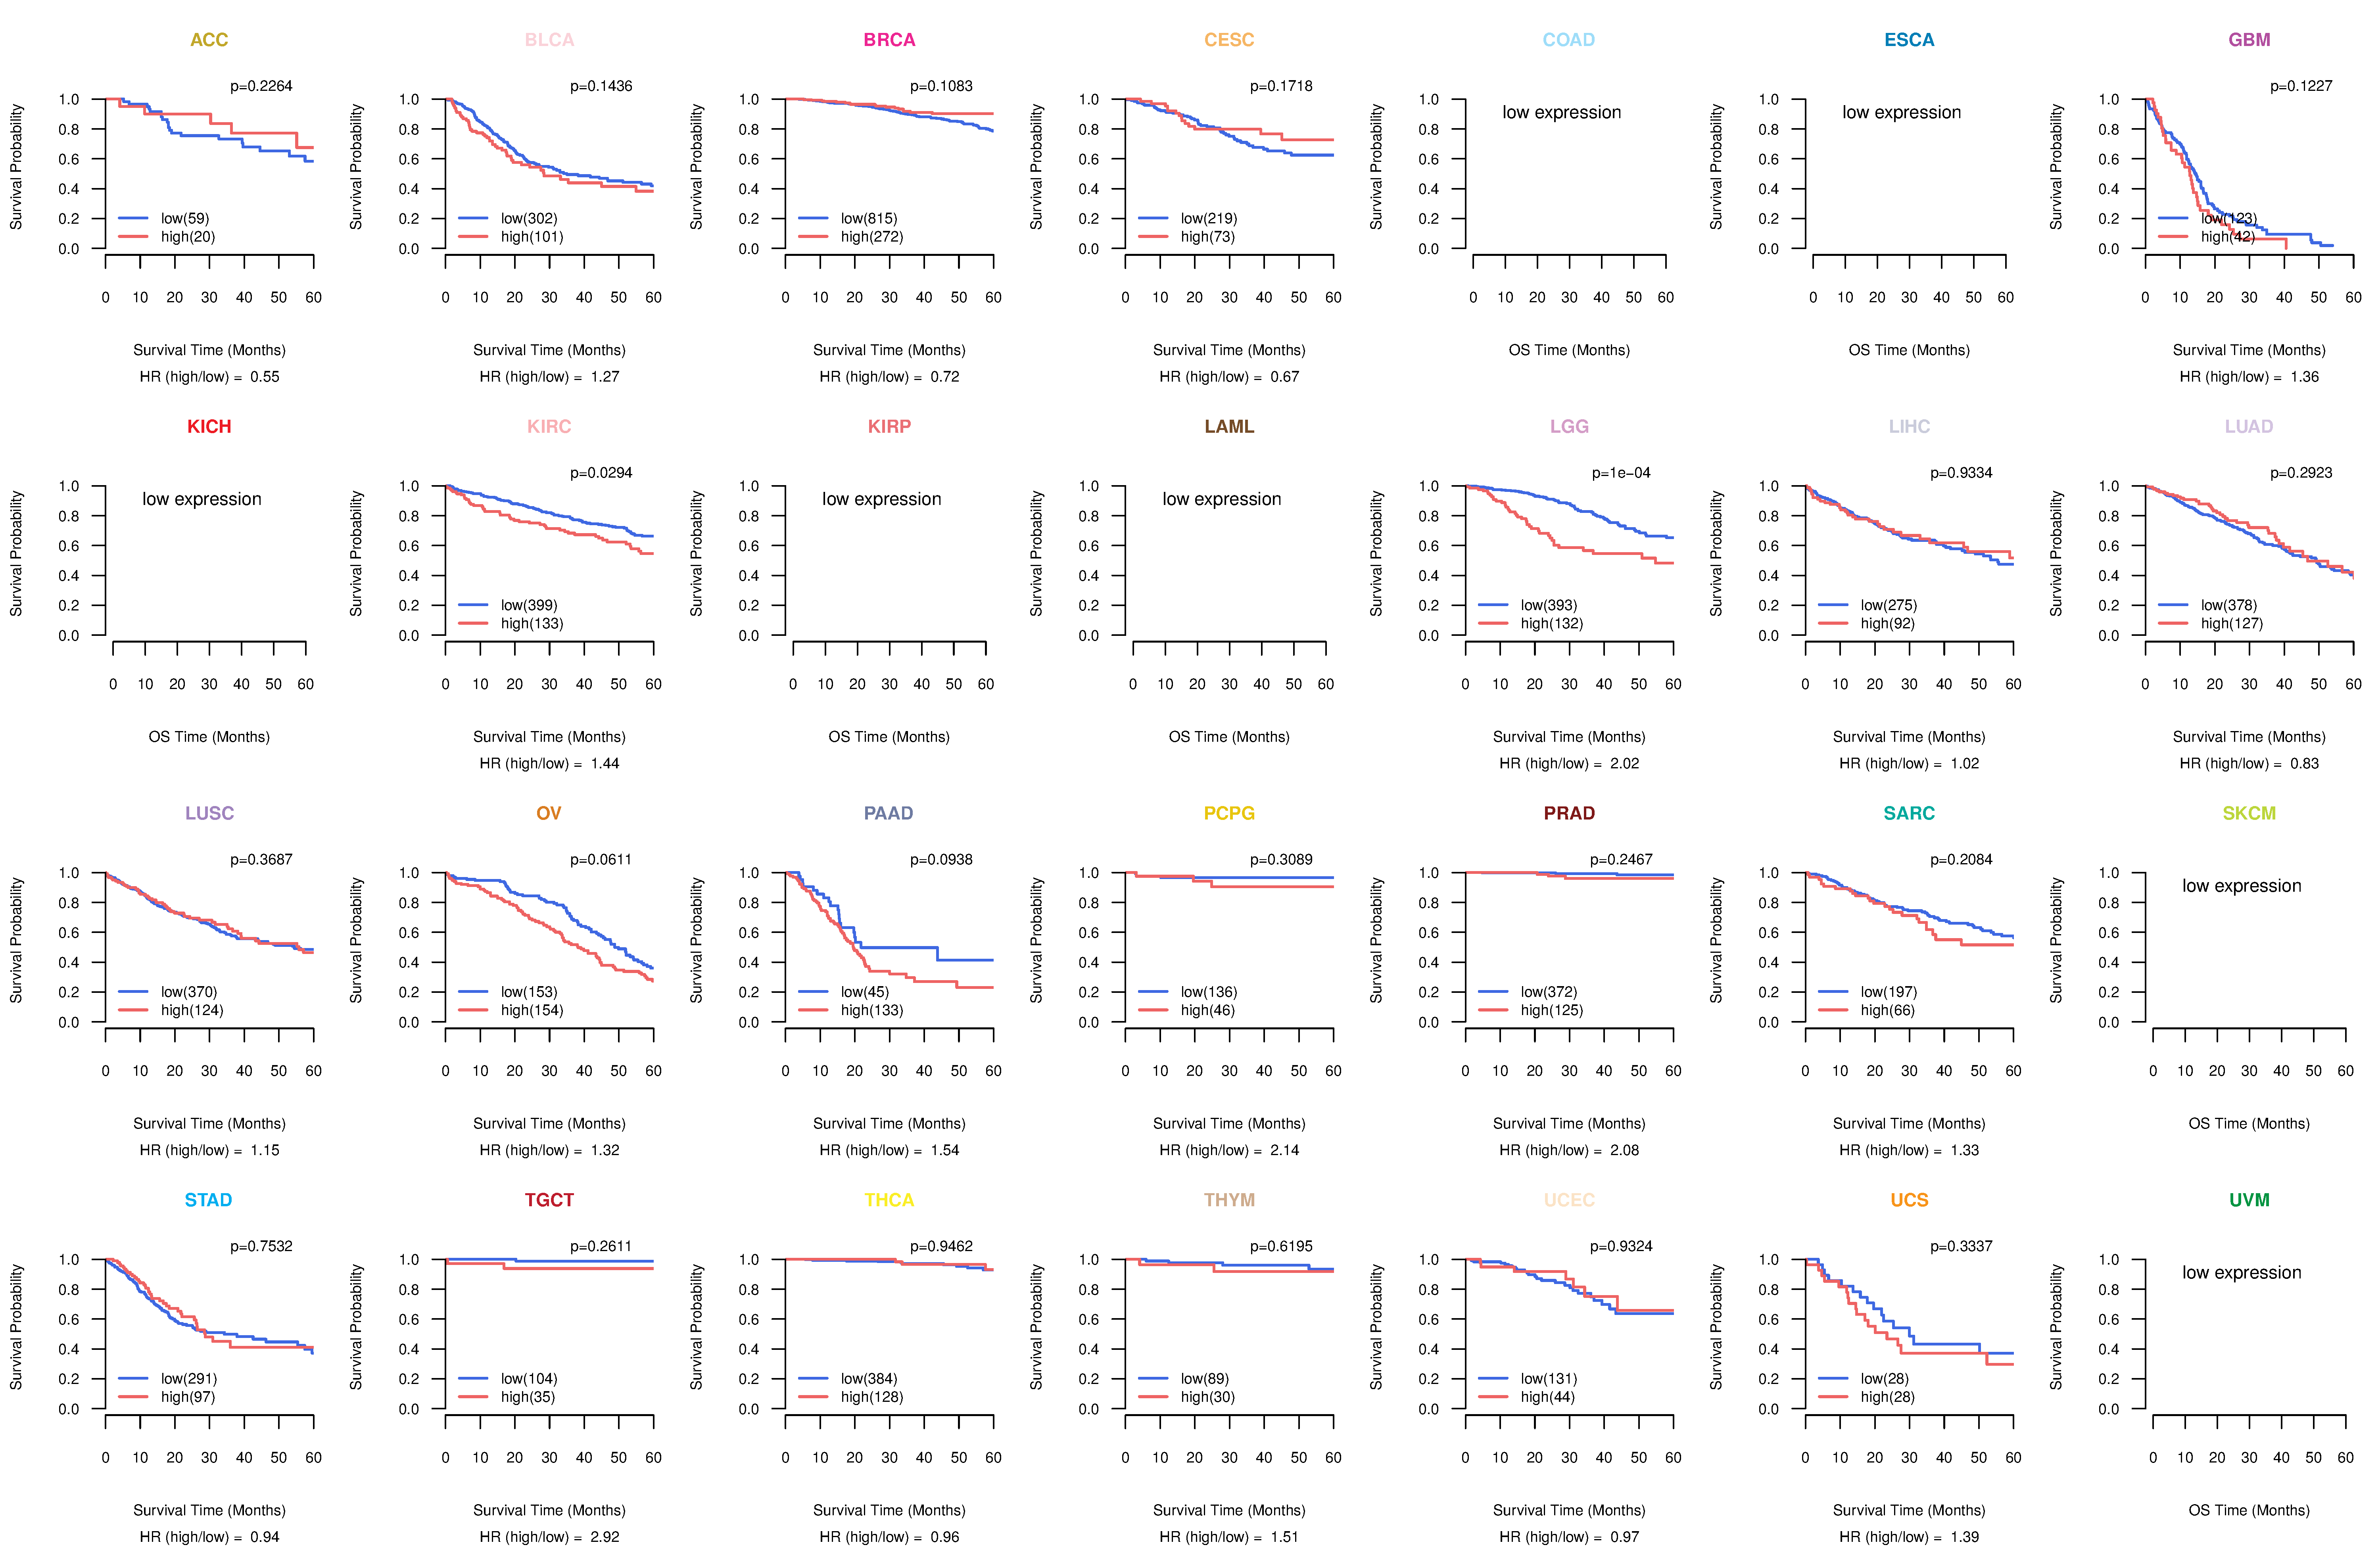
| Kaplan-Meier plots with logrank tests of overall survival (OS) using 28 cancer types (TCGA IlluminaHiSeq_RNASeqV2, pan-cancer normalized log2(norm_counts+1) data, version 2016-08-16) (TCGA clinicalMatrix, phenotype data, version 2016-04-27) * Click on the image to enlarge it in a new window. |
 |
| Kaplan-Meier plots with logrank test of relapse free survival (RFS) using 28 cancer types (TCGA IlluminaHiSeq_RNASeqV2, pan-cancer normalized log2(norm_counts+1) data, version 2016-08-16) (TCGA clinicalMatrix, phenotype data, version 2016-04-27) * Click on the image enlarge it in a new window. |
 |
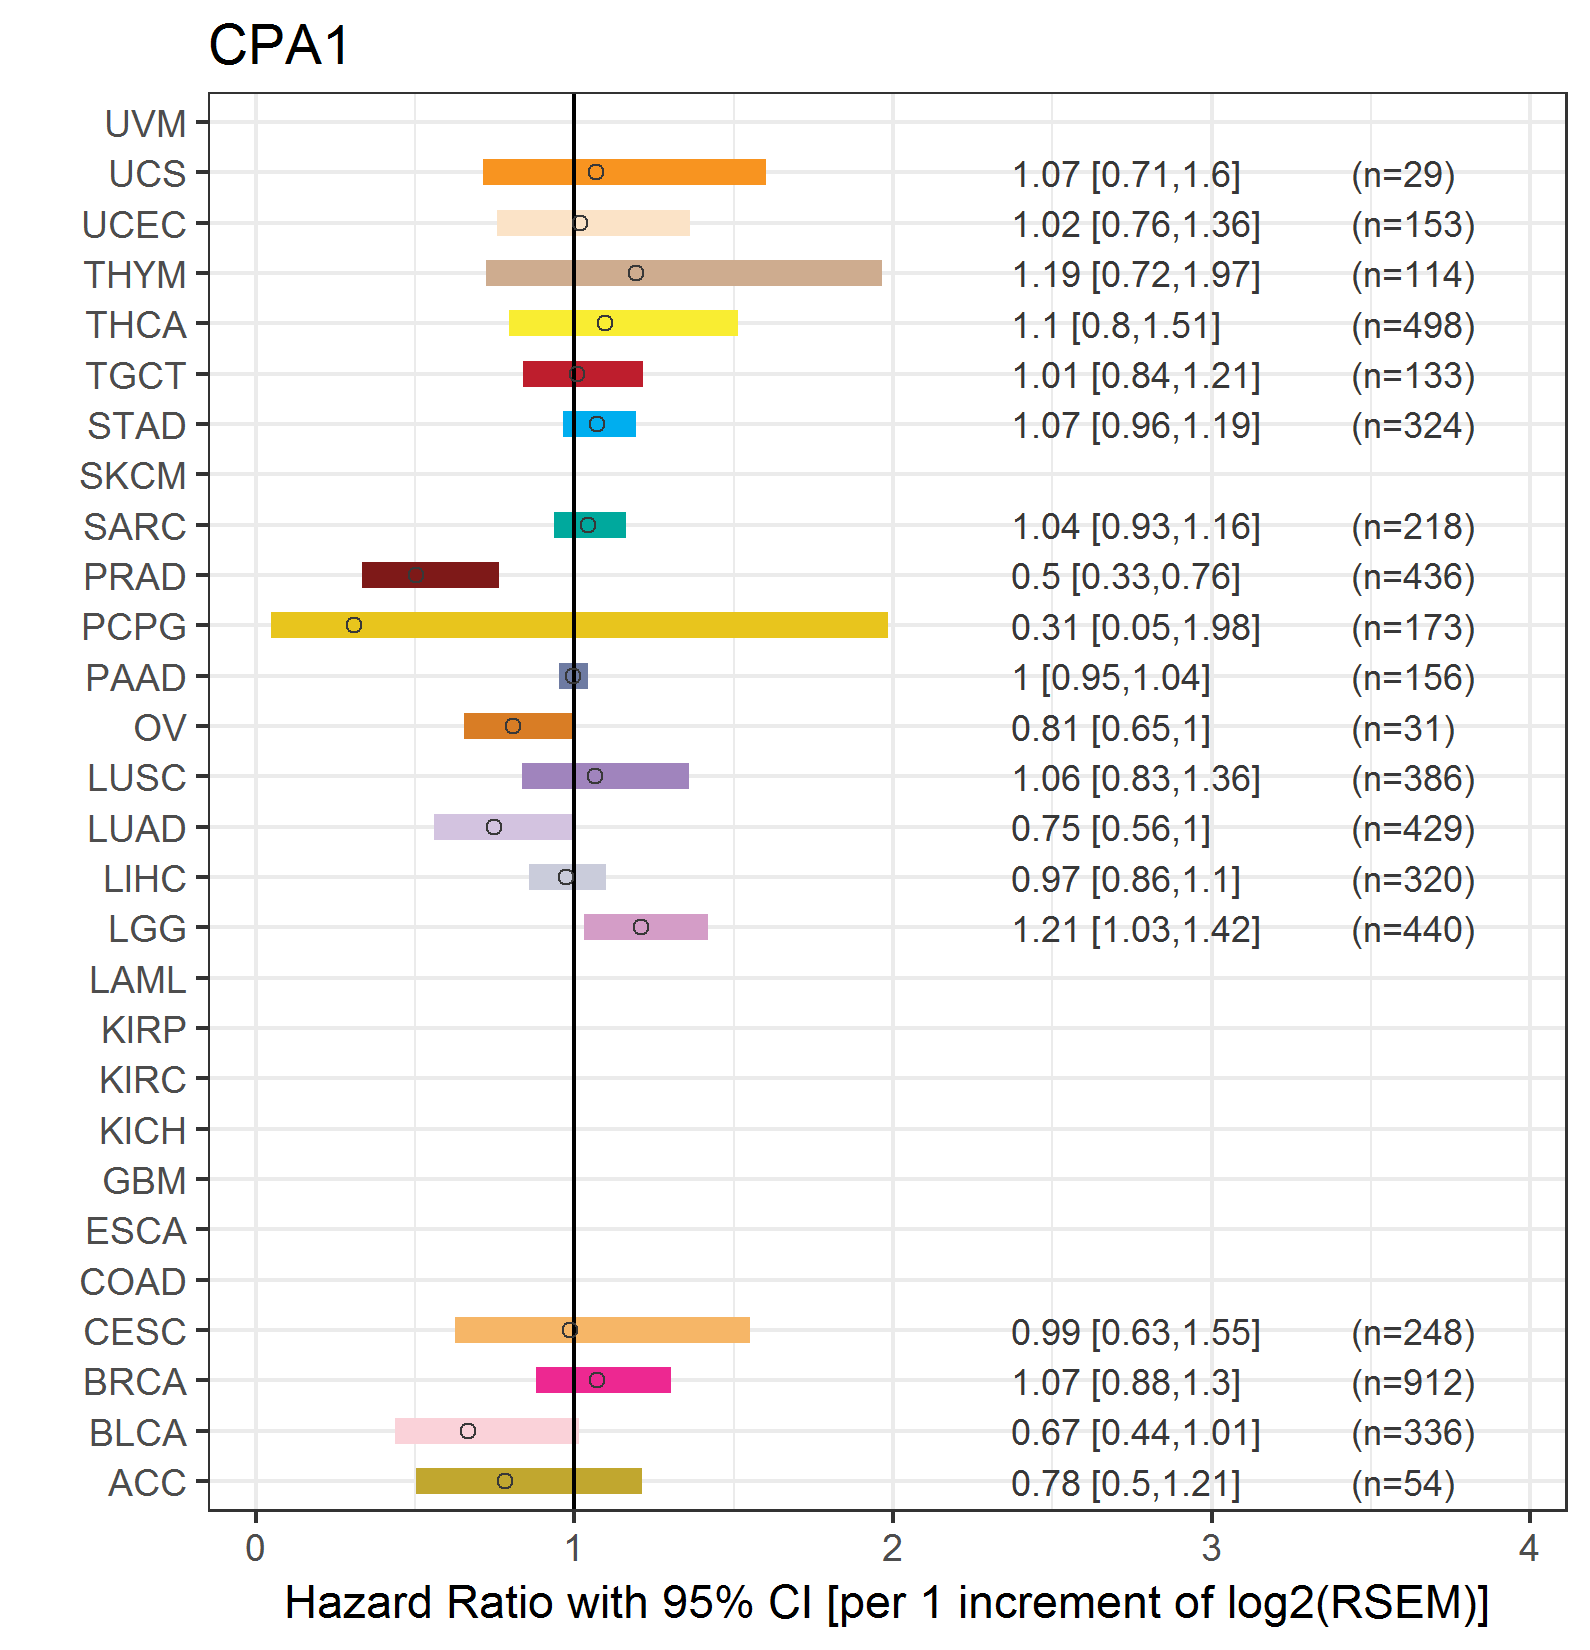
| Forest plot of Cox proportional hazard ratio (HR) and 95% CI of overall survival (OS) using 28 cancer types (TCGA IlluminaHiSeq_RNASeqV2, pan-cancer normalized log2(norm_counts+1) data, version 2016-08-16) (TCGA clinicalMatrix, phenotype data, version 2016-04-27) * Click on the image enlarge it in a new window. |
 |
| Forest plot of Cox proportional hazard ratio (HR) and 95% CI of relapse free survival (RFS) using 28 cancer types (TCGA IlluminaHiSeq_RNASeqV2, pan-cancer normalized log2(norm_counts+1) data, version 2016-08-16) (TCGA clinicalMatrix, phenotype data, version 2016-04-27) * Click on the image enlarge it in a new window. |
 |
| Top |
| TissGeneClin for CPA1 |
| TissGeneDrug for CPA1 |
| Drug information targeting TissGene (DrugBank Version 5.0.6, 2017-04-01) |
| DrugBank ID | Drug name | Drug activity | Drug type | Drug status |
| Top |
| TissGeneDisease for CPA1 |
| Disease information associated with TissGene (DisGeNet, 2016-06-01) |
| Disease ID | Disease name | # pubmeds | Source |
| umls:C0001430 | Adenoma | 2 | BeFree |
| umls:C0006142 | Malignant neoplasm of breast | 2 | BeFree |
| umls:C0030305 | Pancreatitis | 2 | BeFree |
| umls:C0149521 | Pancreatitis, Chronic | 2 | BeFree,CTD_human |
| umls:C1709246 | Non-Neoplastic Disorder | 2 | BeFree |
| umls:C0001622 | Adrenal Gland Hyperfunction | 1 | BeFree |
| umls:C0010481 | Cushing Syndrome | 1 | BeFree |
| umls:C0026277 | Mixed Salivary Gland Tumor | 1 | BeFree |
| umls:C0206686 | Adrenocortical carcinoma | 1 | BeFree |
| umls:C0678222 | Breast Carcinoma | 1 | BeFree |
| umls:C1384514 | Conn Syndrome | 1 | BeFree |
| umls:C1842402 | TROPICAL CALCIFIC PANCREATITIS | 1 | BeFree |
|
Copyright 2016-Present - The University of Texas Health Science Center at Houston (UTHealth) Web File Viewing | How to Report, Fraud, Waste and Abuse | State of Texas | Statewide Search | Texas Homeland Security | Site Policies |