 |
| |
| |
| |
| |
| |
| |
|

| TissGeneSummary for CRABP1 |
 Gene summary Gene summary |
| Basic gene information | Gene symbol | CRABP1 |
| Gene name | cellular retinoic acid binding protein 1 | |
| Synonyms | CRABP|CRABP-I|CRABPI|RBP5 | |
| Cytomap | UCSC genome browser: 15q24 | |
| Type of gene | protein-coding | |
| RefGenes | NM_004378.2, | |
| Description | cellular retinoic acid-binding protein 1cellular retinoic acid-binding protein I | |
| Modification date | 20141207 | |
| dbXrefs | MIM : 180230 | |
| HGNC : HGNC | ||
| Ensembl : ENSG00000166426 | ||
| HPRD : 07520 | ||
| Vega : OTTHUMG00000143862 | ||
| Protein | UniProt: go to UniProt's Cross Reference DB Table | |
| Expression | CleanEX: HS_CRABP1 | |
| BioGPS: 1381 | ||
| Pathway | NCI Pathway Interaction Database: CRABP1 | |
| KEGG: CRABP1 | ||
| REACTOME: CRABP1 | ||
| Pathway Commons: CRABP1 | ||
| Context | iHOP: CRABP1 | |
| ligand binding site mutation search in PubMed: CRABP1 | ||
| UCL Cancer Institute: CRABP1 | ||
| Assigned class in TissGDB* | C | |
| Included tissue-specific gene expression resources | TiGER,GTEx | |
| Specific-tissues in normal samples (assigned by TissGDB using HPA, TiGER, and GTEx) | OvaryThyroid glandEye | |
| Cancer types related to the specific-tissues in cancer samples (assigned by TissGDB using TCGA) | OVTHCAUVM | |
| Reference showing the relevant tissue of CRABP1 | ||
| Description by TissGene annotations | ||
| * Class A consists of genes with literature evidence and is part of the cTissGenes. Class B consists of only cTissGenes without additional evidence. The remaining genes belong to Class C. |
| Gene ontology having evidence of Inferred from Direct Assay (IDA) from Entrez |
| GO ID | GO term | PubMed ID |
| Top |
| TissGeneExp for CRABP1 |
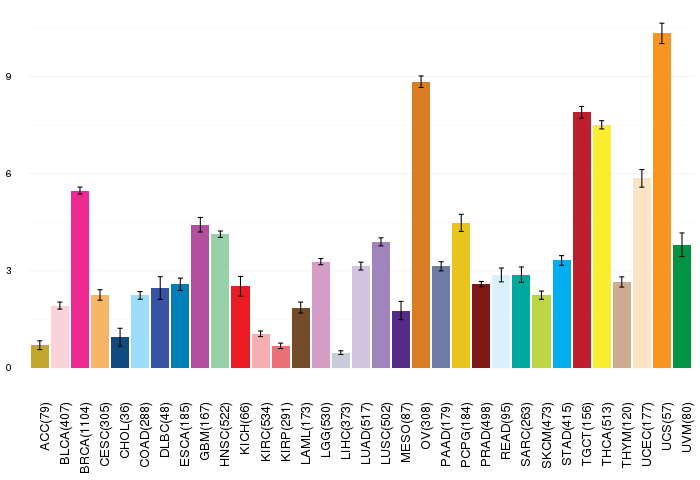
| Gene expressions across 28 cancer types (X-axis: cancer type and Y-axis: log2(norm_counts+1)) (TCGA IlluminaHiSeq_RNASeqV2, pan-cancer normalized log2(norm_counts+1) data, version 2016-08-16) |
 |
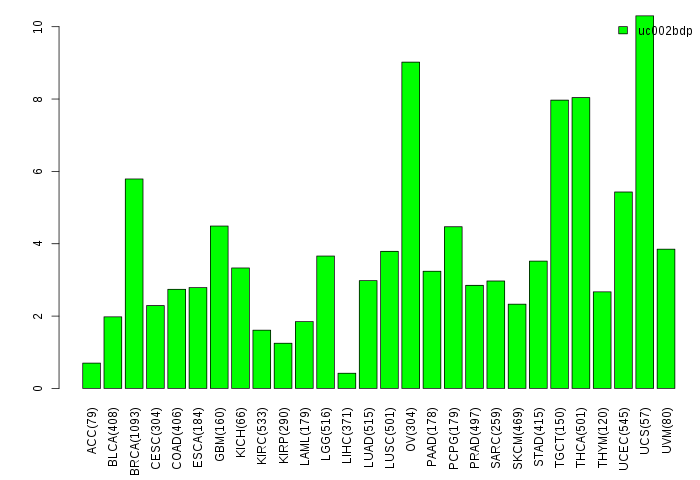
| Gene isoform expressions across 28 cancer types (X-axis: cancer type and Y-axis: log2(norm_counts+1)) (TCGA pan-cancer tcga_rsem_isoform_tpm, version 2016-09-01) |
 |
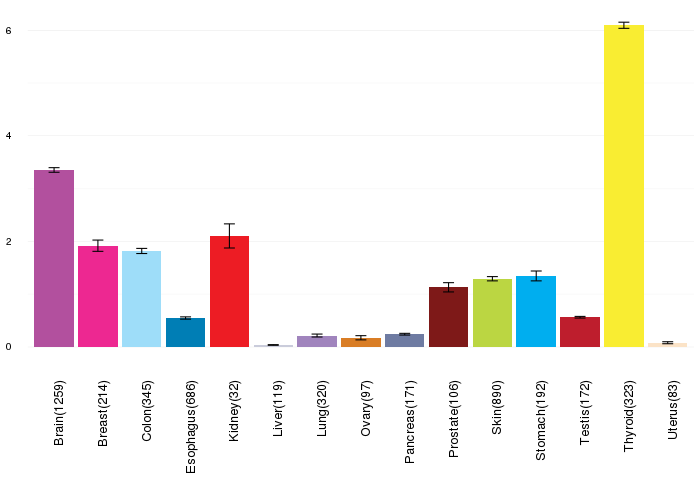
| Gene expressions across normal tissues of GTEx data (GTEx GTEx_Analysis_v6_RNA-seq_RNA-SeQCv1.1.8_gene_rpkm.gct) - Here, we shows the matched tissue types only among our 28 cancer types. |
 |
| Different expressions across 14 cancer types with more than 10 samples between matched tumors and normals (X-axis: cancer type and Y-axis: log2(norm_counts+1)) (TCGA IlluminaHiSeq_RNASeqV2, pan-cancer normalized log2(norm_counts+1) data, version 2016-08-16) |
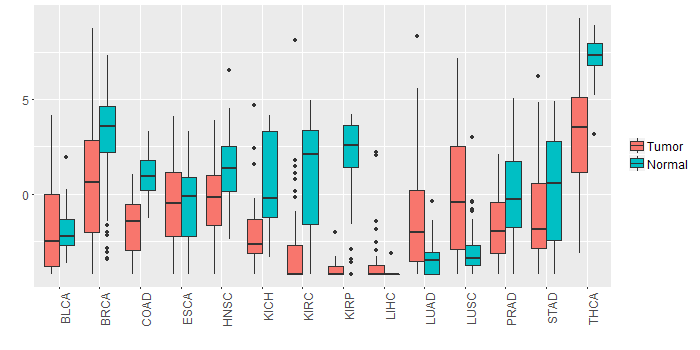 |
| - Significantly differentially expressed cancer types and information. (|Fold change|>1 and FDR<0.05) |
| Cancer type | Mean(exp) in tumor | Mean(exp) in matched normal | Log2FC | P-val. | FDR |
| LUSC | -0.010856051 | -3.044381541 | 3.03352549 | 2.81E-08 | 8.39E-08 |
| BRCA | 0.949324187 | 3.191677696 | -2.242353509 | 2.61E-08 | 8.29E-08 |
| COAD | -1.743335462 | 1.033718384 | -2.777053846 | 8.73E-09 | 7.84E-08 |
| KIRP | -3.981847962 | 1.809008288 | -5.79085625 | 1.66E-14 | 4.14E-13 |
| PRAD | -1.780222001 | 0.153729922 | -1.933951923 | 5.37E-06 | 3.24E-05 |
| THCA | 3.160143351 | 7.256095894 | -4.095952542 | 1.17E-16 | 2.06E-15 |
| LUAD | -1.2543596 | -3.443792359 | 2.189432759 | 4.52E-07 | 1.57E-06 |
| KIRC | -3.10433824 | 1.109181204 | -4.213519444 | 1.33E-19 | 1.01E-18 |
| HNSC | -0.1397343 | 1.259647096 | -1.399381395 | 0.00138 | 0.004480519 |
| KICH | -1.729069462 | 0.759114538 | -2.488184 | 0.00136 | 0.002876622 |
| Top |
| TissGene-miRNA for CRABP1 |
| Significantly anti-correlated miRNAs of TissGene across 28 cancer types (Gene-miRNA relations from TargetScanHuman Relsease 7.1, Conserved_Site_Context_Scores.txt.zip, 06.01.2016) (TCGA IlluminaHiSeq_miRNASeq, log2(RPM+1) data, version 2016-11-21) (TCGA IlluminaHiSeq_RNASeqV2, log2(normalized_count+1) data, version 2016-08-16) (Spearman’s Rank Correlation (p-value<0.05 and coefficient<-0.25)) |
| Cancer type | miRNA id | miRNA accession | P-val. | Coeff. | # samples |
| Top |
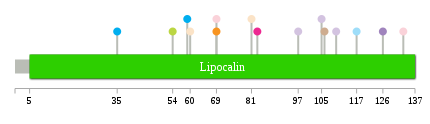
| TissGeneMut for CRABP1 |
| TissGeneSNV for CRABP1 |
| nsSNV counts per each loci. Different colors of circles represent different cancer types. Circle size denotes number of samples. (TCGA somatic mutation (SNPs and small INDELs) data, version 2016-04-25) * Click on the image to enlarge it in a new window. |
 |
 |
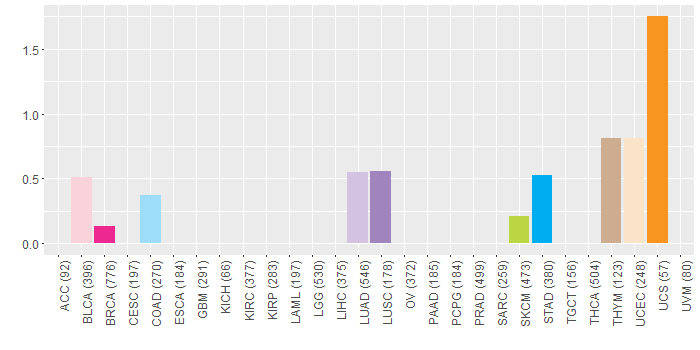
| Somatic nucleotide variants of TissGene across 28 cancer types (X-axis: cancer type and Y-axis: % of mutated samples) The numbers in parentheses are numbers of samples with mutation (nsSNVs). (TCGA somatic mutation (SNPs and small INDELs) data, version 2016-04-25) |
 |
| - nsSNVs sorted by frequency. |
| AAchange | Cancer type | # samples |
| p.W110R | LUAD | 1 |
| p.I133V | BLCA | 1 |
| p.K54N | SKCM | 1 |
| p.T97M | LUAD | 1 |
| p.G69R | UCS | 1 |
| p.D117N | COAD | 1 |
| p.P106R | THYM | 1 |
| p.R60H | UCEC | 1 |
| p.R83T | BRCA | 1 |
| p.V59A | STAD | 1 |
| p.K81E | UCEC | 1 |
| p.G69E | BLCA | 1 |
| p.G105V | LUAD | 1 |
| p.D49N | READ | 1 |
| p.D126N | LUSC | 1 |
| p.A35V | STAD | 1 |
| Top |
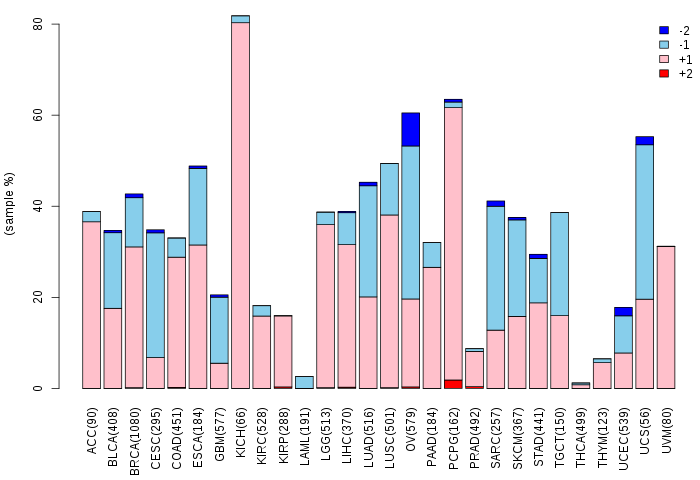
| TissGeneCNV for CRABP1 |
| Copy number variations of TissGene across 28 cancer types (X-axis: cancer type and Y-axis: % of CNV samples) (TCGA Gistic2_CopyNumber_Gistic2_all_data_by_genes, Gistic2 copy number data, version 2016-08-16) |
 |
| Top |
| TissGeneFusions for CRABP1 |
| Fusion genes including TissGene (ChimerDB 3.0, 2016-12-01 and TCGA fusion Portal 2015-12-01) |
| Database | Src | Cancer type | Sample | Fusion gene | ORF | 5'-gene BP | 3'-gene BP |
| Chimerdb3.0 | FusionScan | LUAD | TCGA-86-7713-01A | PDE4D-CRABP1 | In-Frame | chr5:58334685 | chr15:78640268 |
| Chimerdb3.0 | TopHat-Fusion | LUAD | TCGA-86-7713-01A | PDE4D-CRABP1 | In-Frame | chr5:58334685 | chr15:78640268 |
| TCGAfusionPortal | PRADA | LUAD | TCGA-86-7713-01A | PDE4D-CRABP1 | In-frame | Chr5:58334686 | Chr15:78640269 |
| Top |
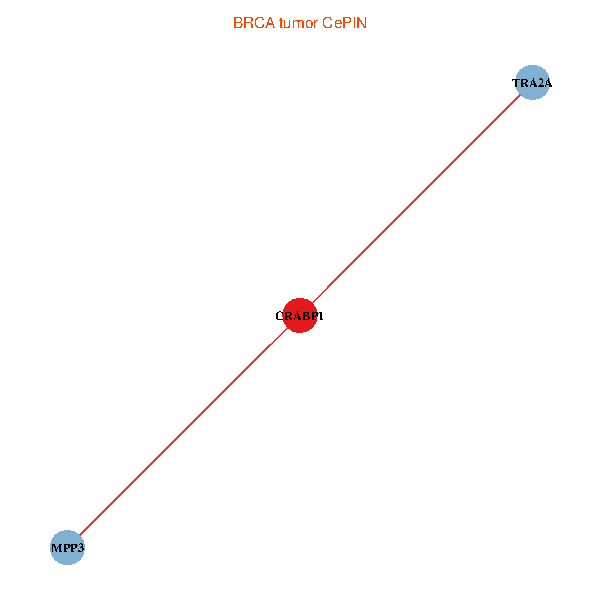
| TissGeneNet for CRABP1 |
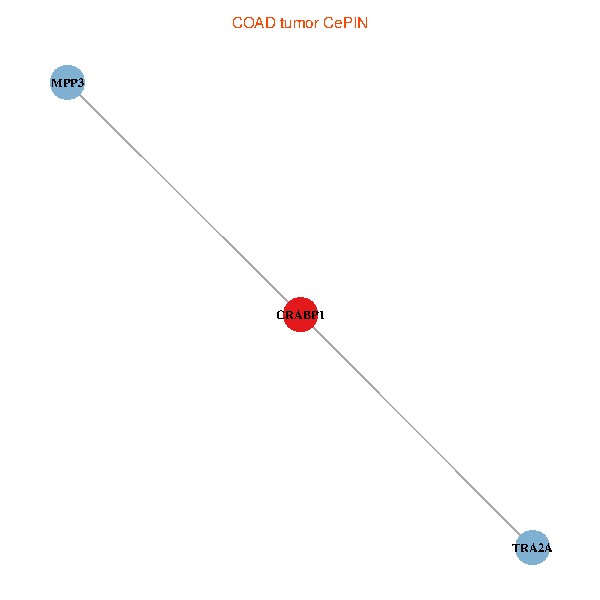
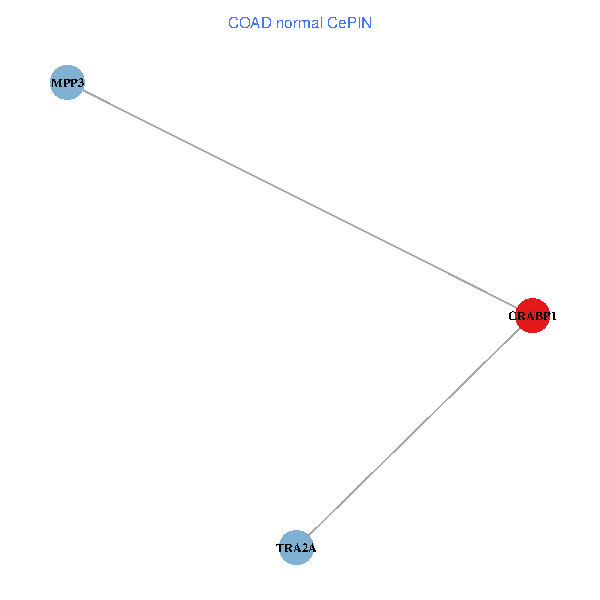
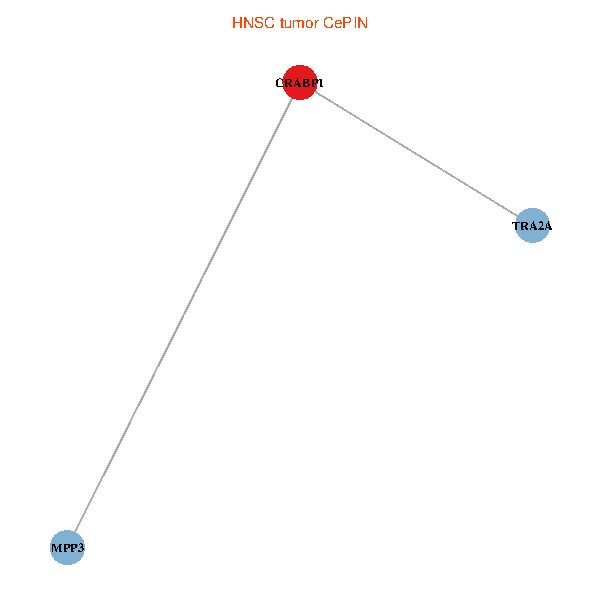
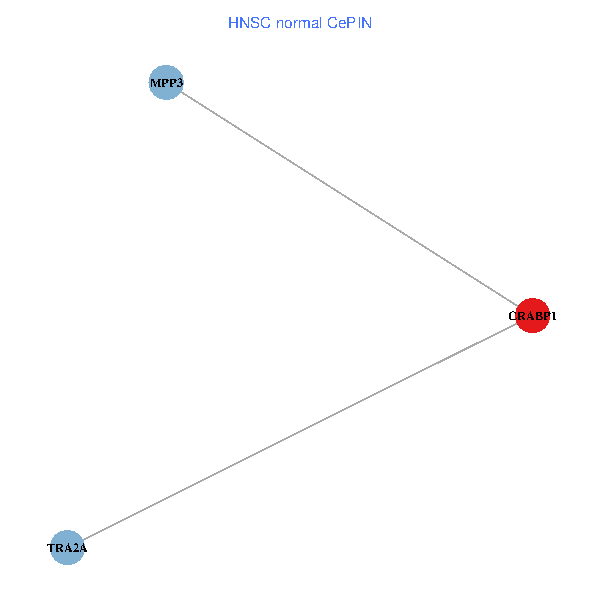
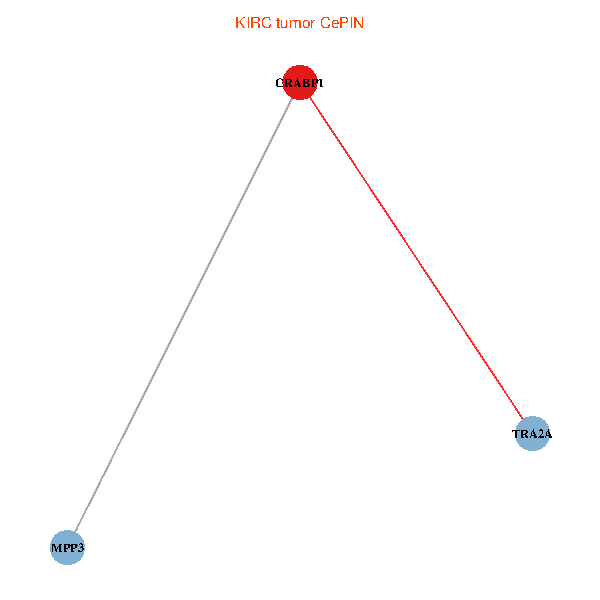
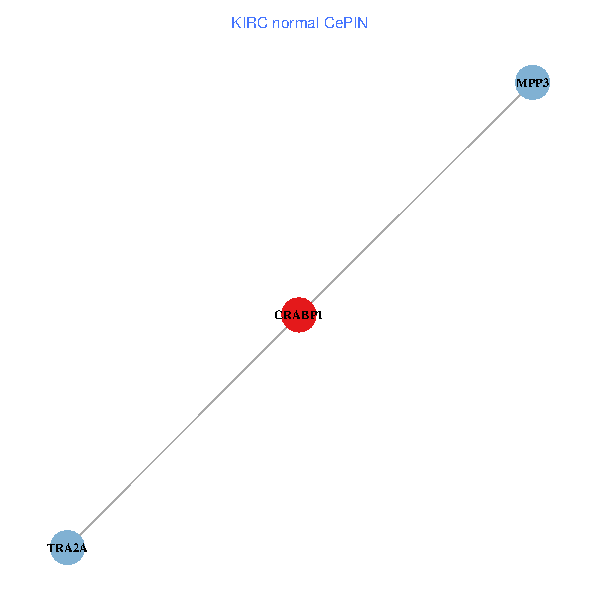
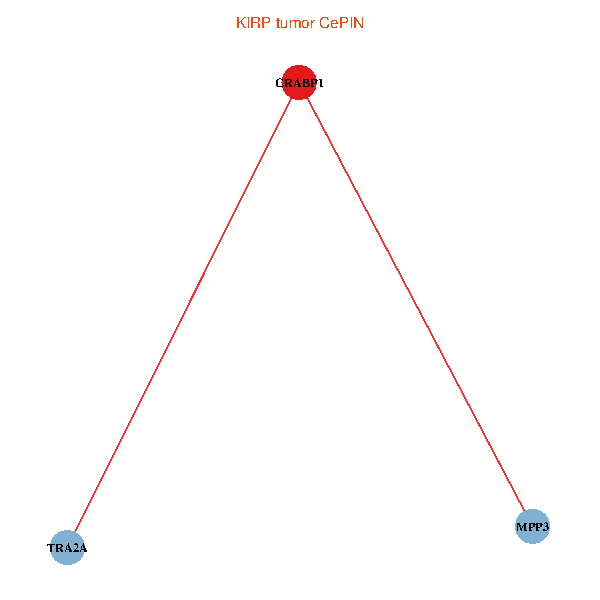
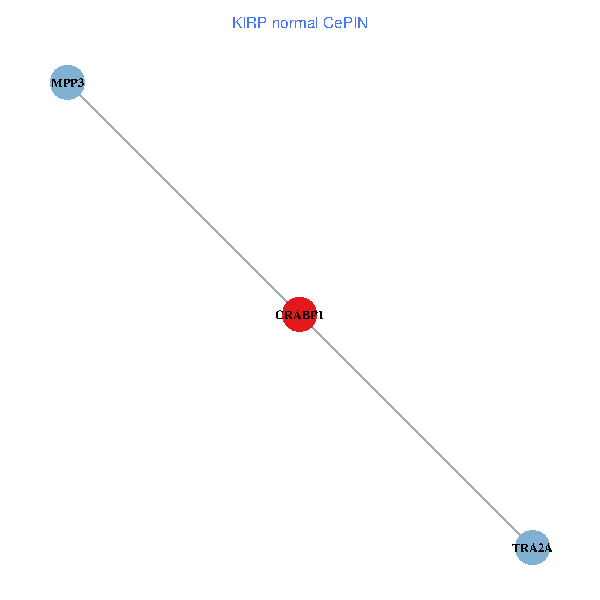
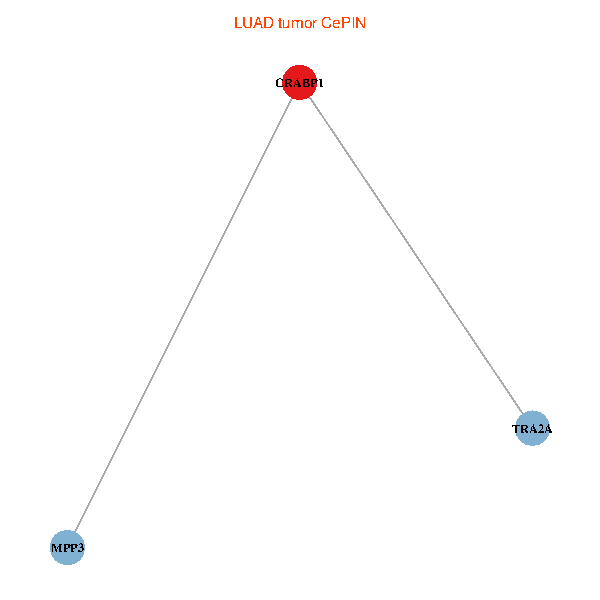
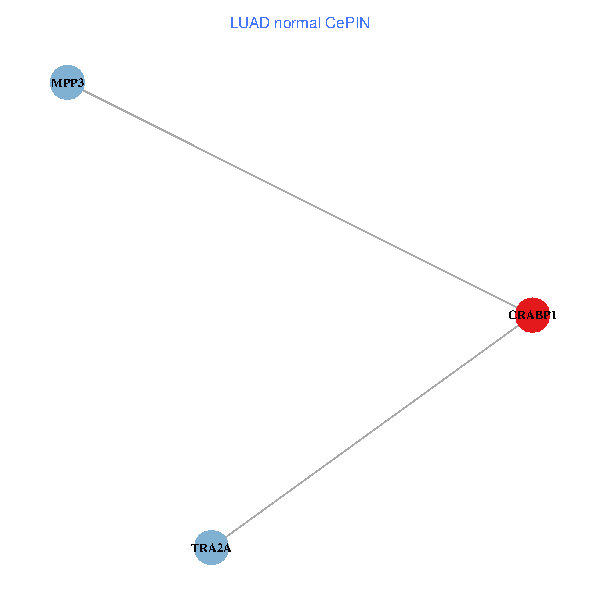
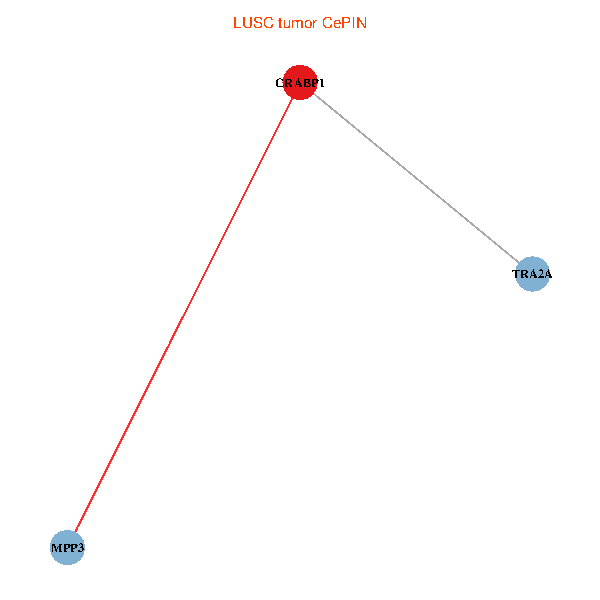
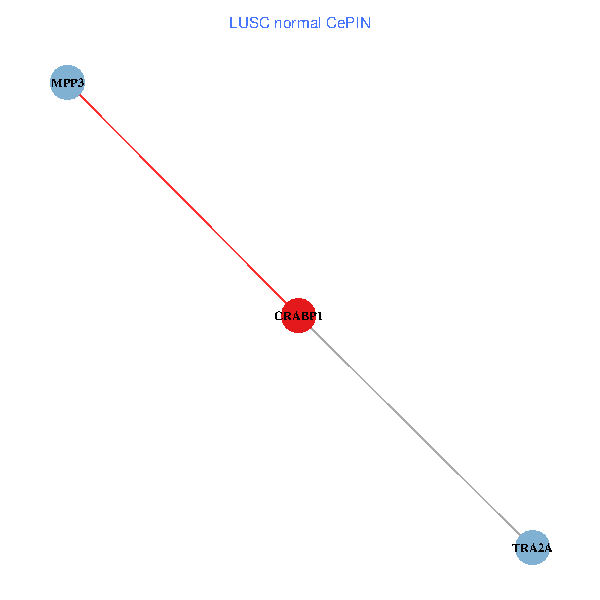
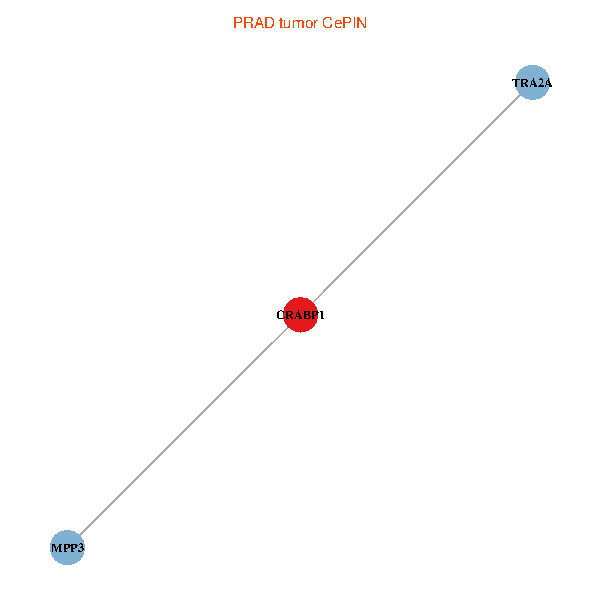
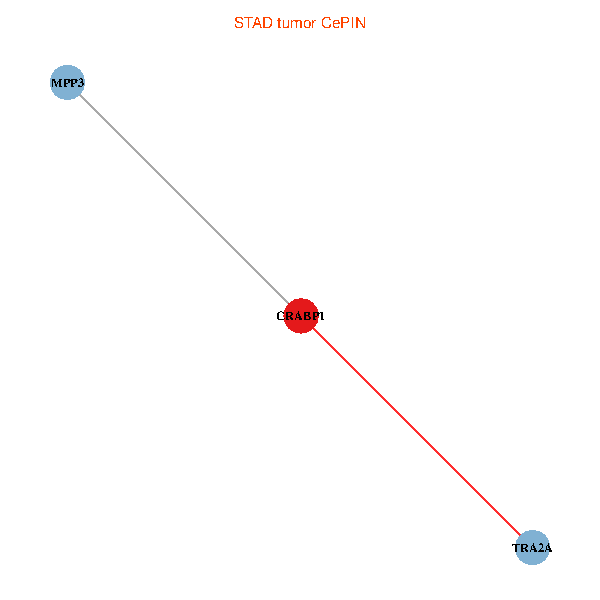
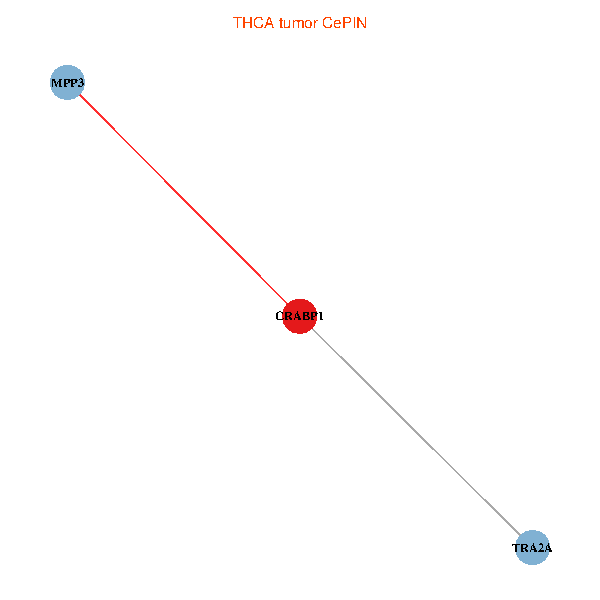
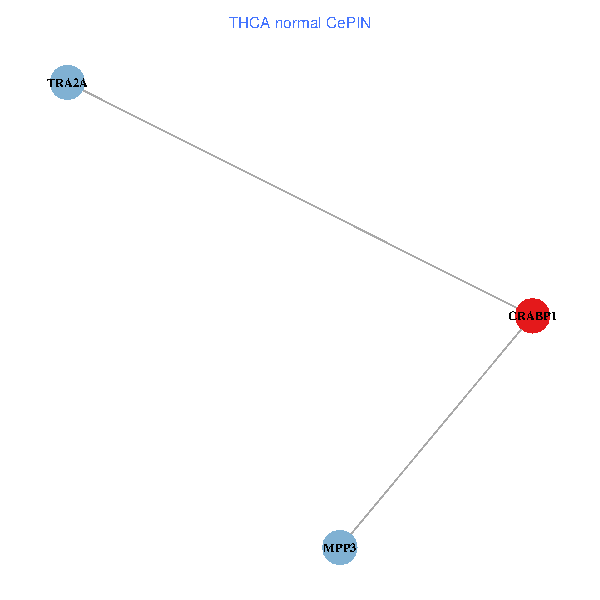
| Co-expressed gene networks based on protein-protein interaction data (CePIN) (TCGA IlluminaHiSeq_RNASeqV2, pan-cancer normalized log2(norm_counts+1) data, version 2016-08-16) (PINA2 ppi data) |
| BRCA (tumor) | BRCA (normal) |
| CRABP1, TRA2A, MPP3 (tumor) | CRABP1, TRA2A, MPP3 (normal) |
 |  |
| COAD (tumor) | COAD (normal) |
| CRABP1, TRA2A, MPP3 (tumor) | CRABP1, TRA2A, MPP3 (normal) |
 |  |
| HNSC (tumor) | HNSC (normal) |
| CRABP1, TRA2A, MPP3 (tumor) | CRABP1, TRA2A, MPP3 (normal) |
 |  |
| KICH (tumor) | KICH (normal) |
| CRABP1, TRA2A, MPP3 (tumor) | CRABP1, TRA2A, MPP3 (normal) |
 |  |
| KIRC (tumor) | KIRC (normal) |
| CRABP1, TRA2A, MPP3 (tumor) | CRABP1, TRA2A, MPP3 (normal) |
 |  |
| KIRP (tumor) | KIRP (normal) |
| CRABP1, TRA2A, MPP3 (tumor) | CRABP1, TRA2A, MPP3 (normal) |
 |  |
| LIHC (tumor) | LIHC (normal) |
| CRABP1, TRA2A, MPP3 (tumor) | CRABP1, TRA2A, MPP3 (normal) |
 |  |
| LUAD (tumor) | LUAD (normal) |
| CRABP1, TRA2A, MPP3 (tumor) | CRABP1, TRA2A, MPP3 (normal) |
 |  |
| LUSC (tumor) | LUSC (normal) |
| CRABP1, TRA2A, MPP3 (tumor) | CRABP1, TRA2A, MPP3 (normal) |
 |  |
| PRAD (tumor) | PRAD (normal) |
| CRABP1, TRA2A, MPP3 (tumor) | CRABP1, TRA2A, MPP3 (normal) |
 |  |
| STAD (tumor) | STAD (normal) |
| CRABP1, TRA2A, MPP3 (tumor) | CRABP1, TRA2A, MPP3 (normal) |
 |  |
| THCA (tumor) | THCA (normal) |
| CRABP1, TRA2A, MPP3 (tumor) | CRABP1, TRA2A, MPP3 (normal) |
 |  |
| Top |
| TissGeneProg for CRABP1 |
| Kaplan-Meier plots with logrank tests of overall survival (OS) using 28 cancer types (TCGA IlluminaHiSeq_RNASeqV2, pan-cancer normalized log2(norm_counts+1) data, version 2016-08-16) (TCGA clinicalMatrix, phenotype data, version 2016-04-27) * Click on the image to enlarge it in a new window. |
 |
| Kaplan-Meier plots with logrank test of relapse free survival (RFS) using 28 cancer types (TCGA IlluminaHiSeq_RNASeqV2, pan-cancer normalized log2(norm_counts+1) data, version 2016-08-16) (TCGA clinicalMatrix, phenotype data, version 2016-04-27) * Click on the image enlarge it in a new window. |
 |
| Forest plot of Cox proportional hazard ratio (HR) and 95% CI of overall survival (OS) using 28 cancer types (TCGA IlluminaHiSeq_RNASeqV2, pan-cancer normalized log2(norm_counts+1) data, version 2016-08-16) (TCGA clinicalMatrix, phenotype data, version 2016-04-27) * Click on the image enlarge it in a new window. |
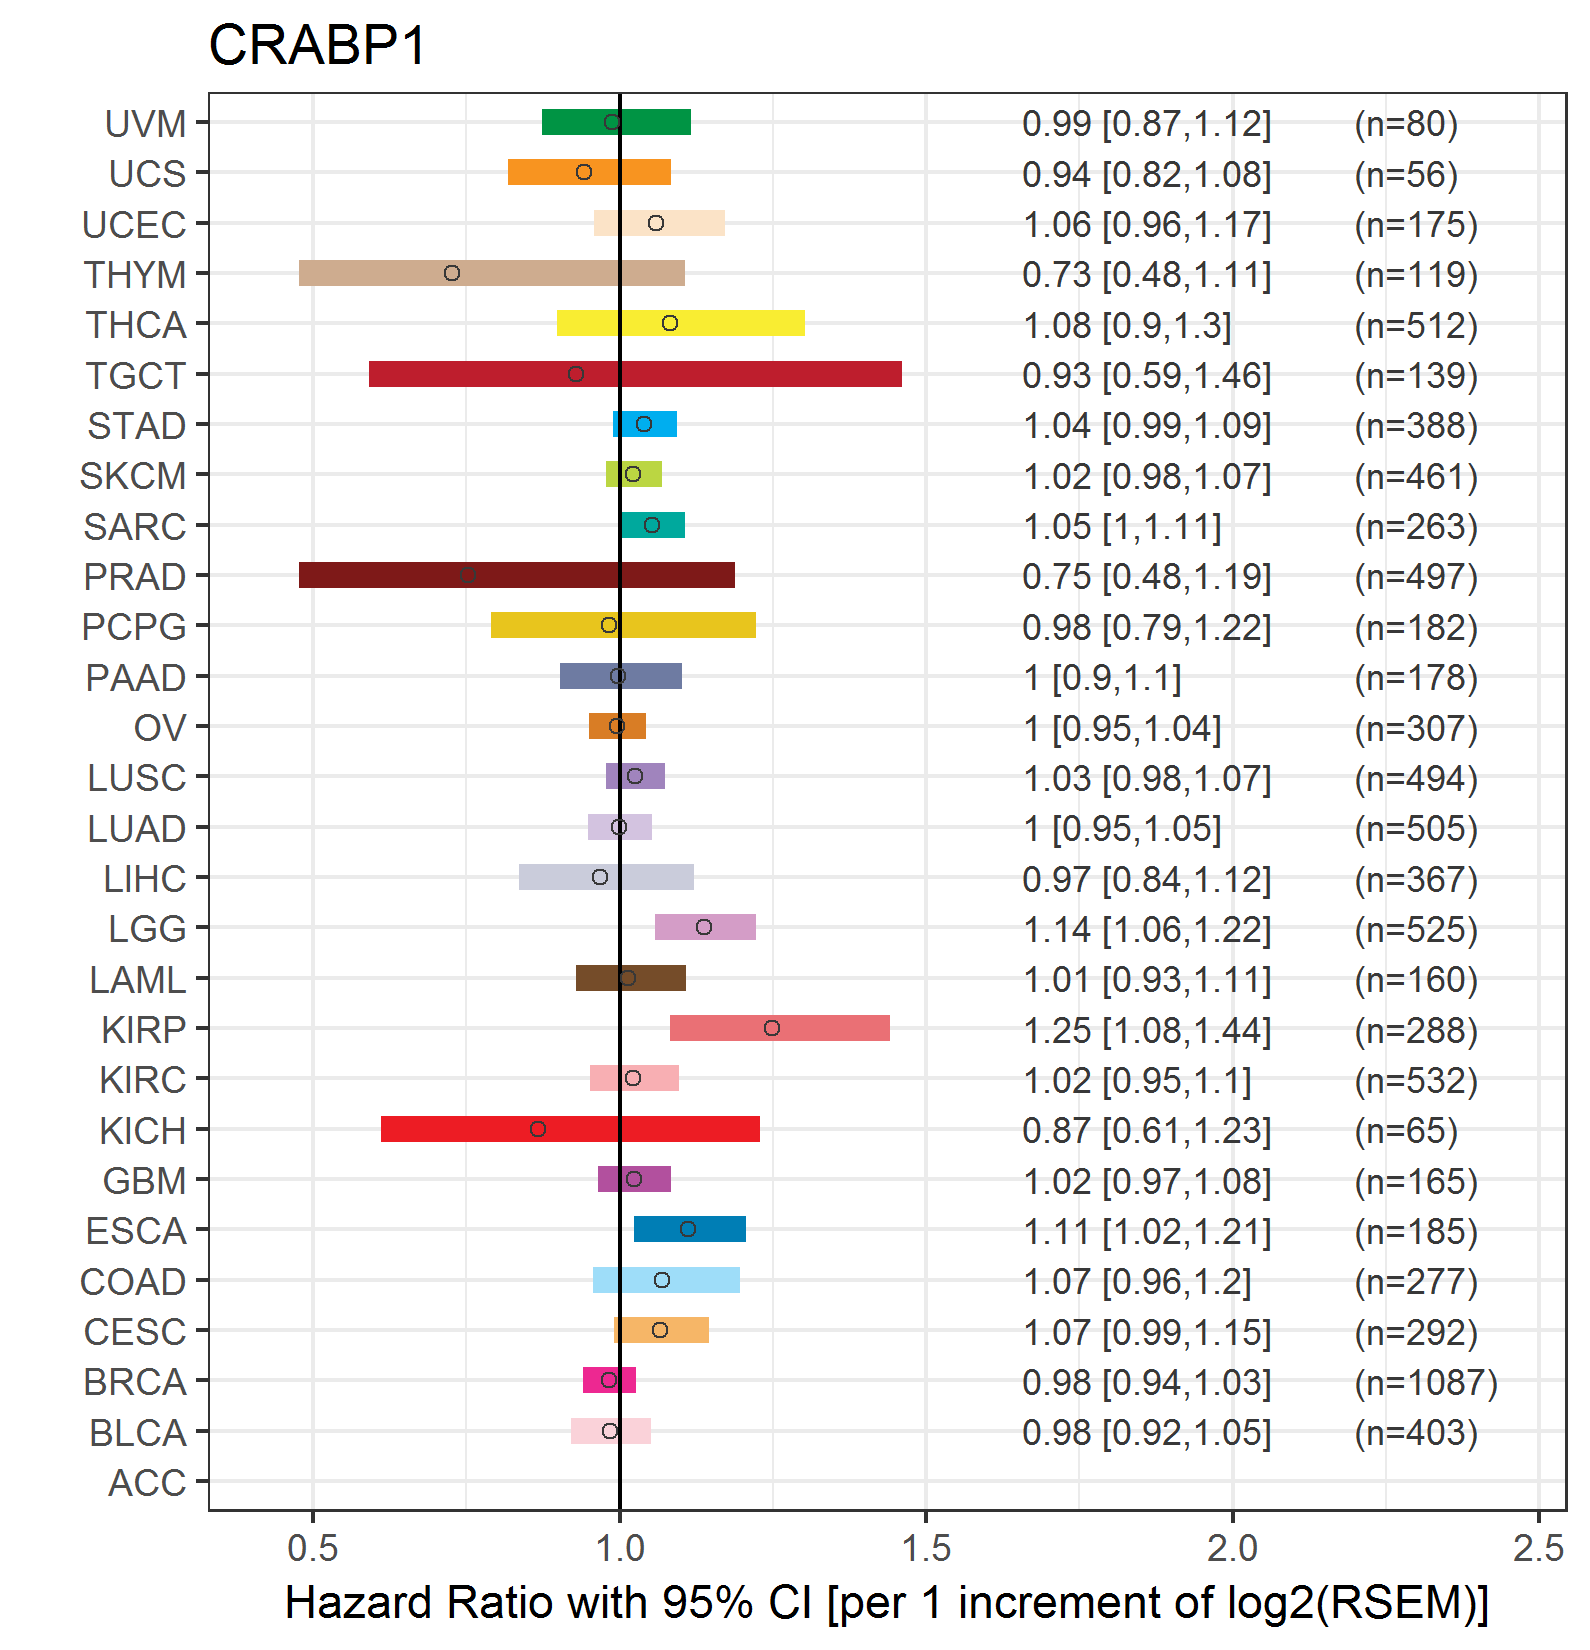 |
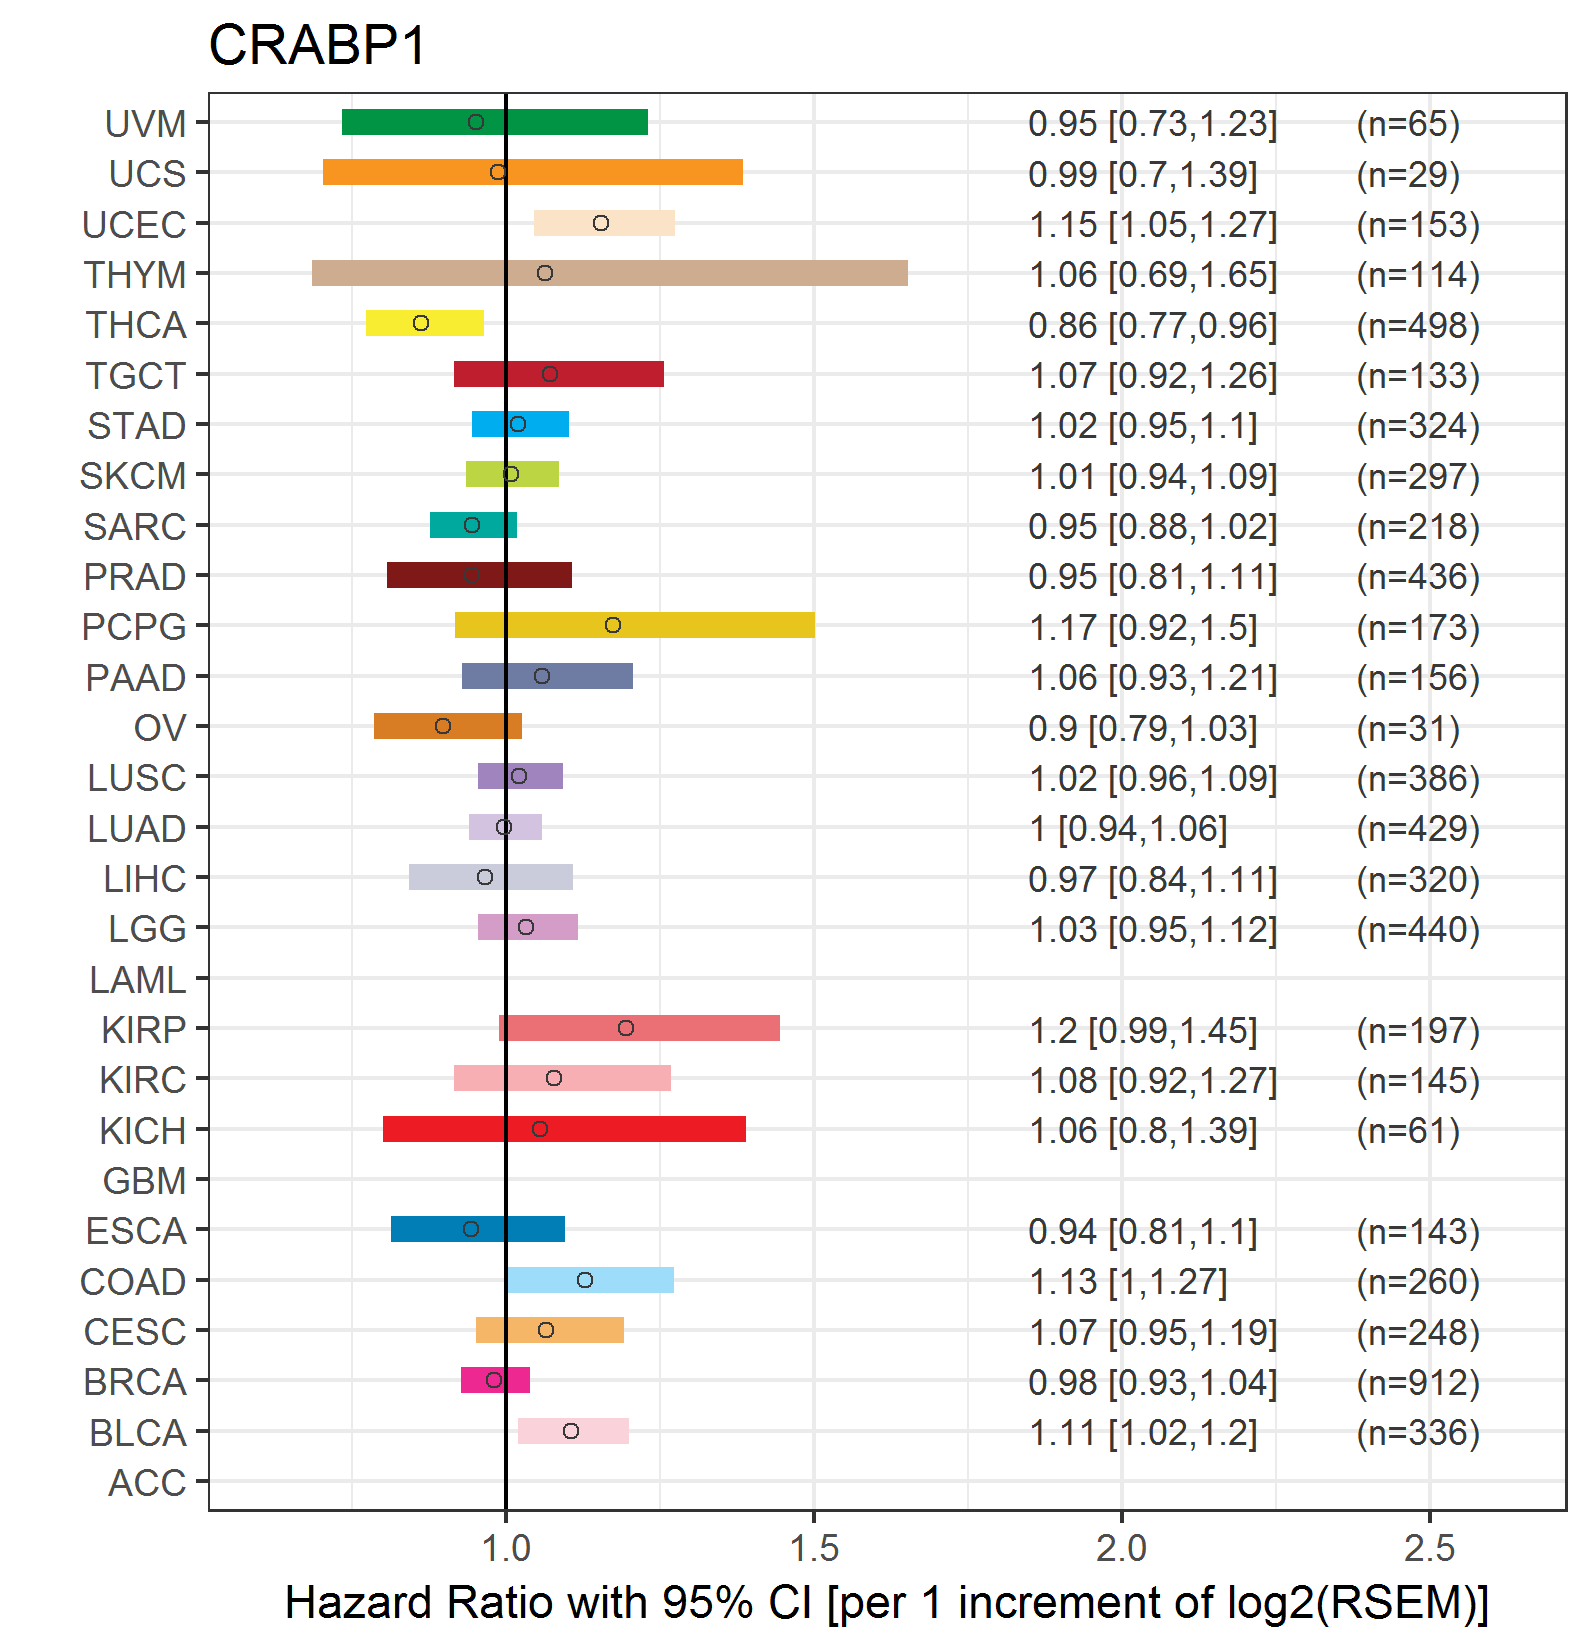
| Forest plot of Cox proportional hazard ratio (HR) and 95% CI of relapse free survival (RFS) using 28 cancer types (TCGA IlluminaHiSeq_RNASeqV2, pan-cancer normalized log2(norm_counts+1) data, version 2016-08-16) (TCGA clinicalMatrix, phenotype data, version 2016-04-27) * Click on the image enlarge it in a new window. |
 |
| Top |
| TissGeneClin for CRABP1 |
| TissGeneDrug for CRABP1 |
| Drug information targeting TissGene (DrugBank Version 5.0.6, 2017-04-01) |
| DrugBank ID | Drug name | Drug activity | Drug type | Drug status |
| Top |
| TissGeneDisease for CRABP1 |
| Disease information associated with TissGene (DisGeNet, 2016-06-01) |
| Disease ID | Disease name | # pubmeds | Source |
| umls:C0001430 | Adenoma | 2 | BeFree |
| umls:C0003873 | Rheumatoid Arthritis | 2 | BeFree |
| umls:C0023467 | Leukemia, Myelocytic, Acute | 2 | BeFree |
| umls:C0023487 | Acute Promyelocytic Leukemia | 2 | BeFree |
| umls:C0040136 | Thyroid Neoplasm | 2 | LHGDN |
| umls:C0238463 | Papillary thyroid carcinoma | 2 | BeFree |
| umls:C0596263 | Carcinogenesis | 2 | BeFree |
| umls:C0007134 | Renal Cell Carcinoma | 1 | BeFree,CTD_human,LHGDN |
| umls:C0007137 | Squamous cell carcinoma | 1 | BeFree |
| umls:C0009402 | Colorectal Carcinoma | 1 | BeFree |
| umls:C0022548 | Keloid | 1 | CTD_human |
| umls:C0023267 | Fibroid Tumor | 1 | BeFree |
| umls:C0023903 | Liver neoplasms | 1 | CTD_human |
| umls:C0026654 | Moyamoya Disease | 1 | LHGDN |
| umls:C0027794 | Neural Tube Defects | 1 | GAD |
| umls:C0027819 | Neuroblastoma | 1 | BeFree |
| umls:C0042133 | Uterine Fibroids | 1 | BeFree |
| umls:C0279626 | Squamous cell carcinoma of esophagus | 1 | BeFree,CTD_human |
| umls:C0339143 | Thyroid associated opthalmopathies | 1 | BeFree |
| umls:C0686619 | Secondary malignant neoplasm of lymph node | 1 | BeFree |
| umls:C0700095 | Central neuroblastoma | 1 | BeFree |
| umls:C1153706 | Endometrial adenocarcinoma | 1 | BeFree |
| umls:C1168401 | Squamous cell carcinoma of the head and neck | 1 | BeFree |
| umls:C1527249 | Colorectal Cancer | 1 | BeFree |
| umls:C3811653 | Experimental Organism Basal Cell Carcinoma | 1 | BeFree |
|
Copyright 2016-Present - The University of Texas Health Science Center at Houston (UTHealth) Web File Viewing | How to Report, Fraud, Waste and Abuse | State of Texas | Statewide Search | Texas Homeland Security | Site Policies |