 |
| |
| |
| |
| |
| |
| |
|

| TissGeneSummary for MUM1L1 |
 Gene summary Gene summary |
| Basic gene information | Gene symbol | MUM1L1 |
| Gene name | melanoma associated antigen (mutated) 1-like 1 | |
| Synonyms | - | |
| Cytomap | UCSC genome browser: Xq22.3 | |
| Type of gene | protein-coding | |
| RefGenes | NM_001171020.1, NM_152423.4, | |
| Description | MUM1-like protein 1PWWP domain-containing protein MUM1L1mutated melanoma-associated antigen 1-like protein 1 | |
| Modification date | 20141207 | |
| dbXrefs | HGNC : HGNC | |
| Ensembl : ENSG00000157502 | ||
| HPRD : 06555 | ||
| Vega : OTTHUMG00000022146 | ||
| Protein | UniProt: go to UniProt's Cross Reference DB Table | |
| Expression | CleanEX: HS_MUM1L1 | |
| BioGPS: 139221 | ||
| Pathway | NCI Pathway Interaction Database: MUM1L1 | |
| KEGG: MUM1L1 | ||
| REACTOME: MUM1L1 | ||
| Pathway Commons: MUM1L1 | ||
| Context | iHOP: MUM1L1 | |
| ligand binding site mutation search in PubMed: MUM1L1 | ||
| UCL Cancer Institute: MUM1L1 | ||
| Assigned class in TissGDB* | B | |
| Included tissue-specific gene expression resources | HPA,TiGER,GTEx | |
| Specific-tissues in normal samples (assigned by TissGDB using HPA, TiGER, and GTEx) | OvaryTestis | |
| Cancer types related to the specific-tissues in cancer samples (assigned by TissGDB using TCGA) | OVTGCT | |
| Reference showing the relevant tissue of MUM1L1 | ||
| Description by TissGene annotations | ||
| * Class A consists of genes with literature evidence and is part of the cTissGenes. Class B consists of only cTissGenes without additional evidence. The remaining genes belong to Class C. |
| Gene ontology having evidence of Inferred from Direct Assay (IDA) from Entrez |
| GO ID | GO term | PubMed ID |
| Top |
| TissGeneExp for MUM1L1 |
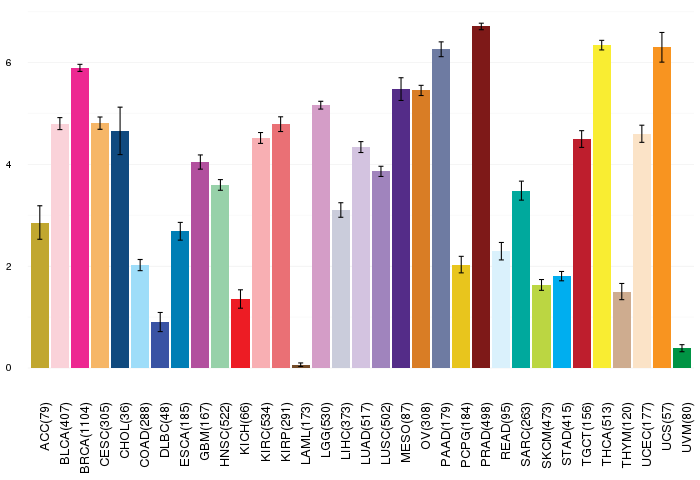
| Gene expressions across 28 cancer types (X-axis: cancer type and Y-axis: log2(norm_counts+1)) (TCGA IlluminaHiSeq_RNASeqV2, pan-cancer normalized log2(norm_counts+1) data, version 2016-08-16) |
 |
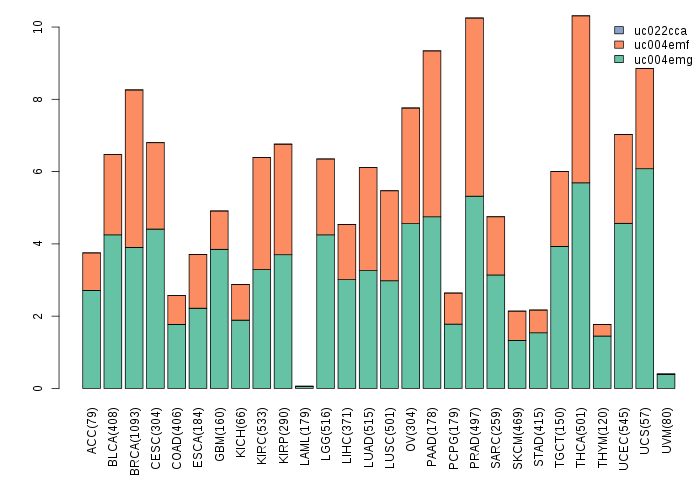
| Gene isoform expressions across 28 cancer types (X-axis: cancer type and Y-axis: log2(norm_counts+1)) (TCGA pan-cancer tcga_rsem_isoform_tpm, version 2016-09-01) |
 |
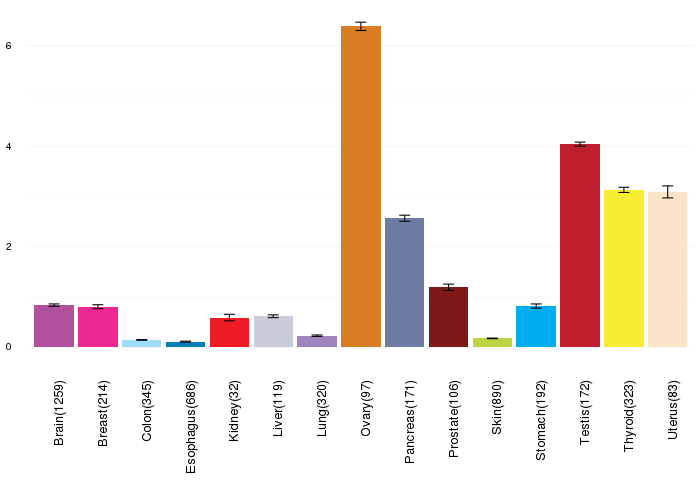
| Gene expressions across normal tissues of GTEx data (GTEx GTEx_Analysis_v6_RNA-seq_RNA-SeQCv1.1.8_gene_rpkm.gct) - Here, we shows the matched tissue types only among our 28 cancer types. |
 |
| Different expressions across 14 cancer types with more than 10 samples between matched tumors and normals (X-axis: cancer type and Y-axis: log2(norm_counts+1)) (TCGA IlluminaHiSeq_RNASeqV2, pan-cancer normalized log2(norm_counts+1) data, version 2016-08-16) |
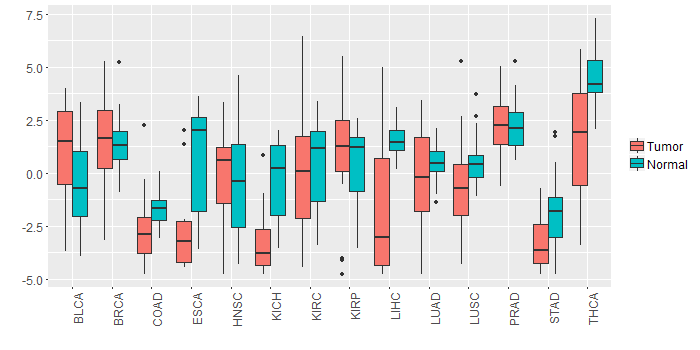 |
| - Significantly differentially expressed cancer types and information. (|Fold change|>1 and FDR<0.05) |
| Cancer type | Mean(exp) in tumor | Mean(exp) in matched normal | Log2FC | P-val. | FDR |
| THCA | 1.595443534 | 4.538016415 | -2.942572881 | 8.52E-13 | 7.70E-12 |
| LIHC | -1.91779467 | 1.52805933 | -3.445854 | 3.95E-11 | 5.45E-10 |
| KICH | -3.38113267 | -0.48398467 | -2.897148 | 3.28E-07 | 1.35E-06 |
| COAD | -2.7921579 | -1.729577131 | -1.062580769 | 0.0041 | 0.010082043 |
| LUSC | -0.661786709 | 0.441832899 | -1.103619608 | 0.000605 | 0.001156587 |
| STAD | -3.39898867 | -1.88007617 | -1.5189125 | 4.32E-05 | 0.000381007 |
| Top |
| TissGene-miRNA for MUM1L1 |
| Significantly anti-correlated miRNAs of TissGene across 28 cancer types (Gene-miRNA relations from TargetScanHuman Relsease 7.1, Conserved_Site_Context_Scores.txt.zip, 06.01.2016) (TCGA IlluminaHiSeq_miRNASeq, log2(RPM+1) data, version 2016-11-21) (TCGA IlluminaHiSeq_RNASeqV2, log2(normalized_count+1) data, version 2016-08-16) (Spearman’s Rank Correlation (p-value<0.05 and coefficient<-0.25)) |
| Cancer type | miRNA id | miRNA accession | P-val. | Coeff. | # samples |
| Top |
| TissGeneMut for MUM1L1 |
| TissGeneSNV for MUM1L1 |
| nsSNV counts per each loci. Different colors of circles represent different cancer types. Circle size denotes number of samples. (TCGA somatic mutation (SNPs and small INDELs) data, version 2016-04-25) * Click on the image to enlarge it in a new window. |
 |
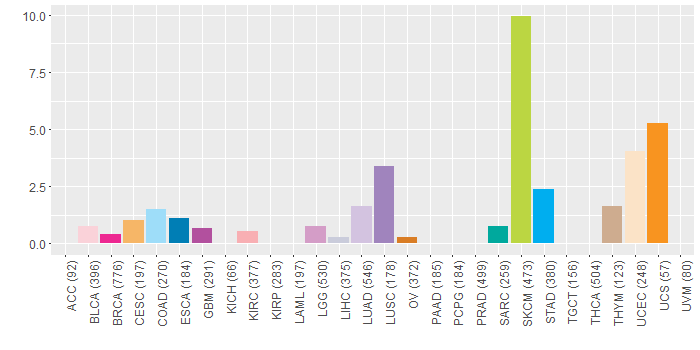
| Somatic nucleotide variants of TissGene across 28 cancer types (X-axis: cancer type and Y-axis: % of mutated samples) The numbers in parentheses are numbers of samples with mutation (nsSNVs). (TCGA somatic mutation (SNPs and small INDELs) data, version 2016-04-25) |
 |
| - nsSNVs sorted by frequency. |
| AAchange | Cancer type | # samples |
| p.E259K | SKCM | 2 |
| p.P282S | SKCM | 2 |
| p.S465I | SKCM | 1 |
| p.R100K | SKCM | 1 |
| p.D233H | COAD | 1 |
| p.E113D | THYM | 1 |
| p.F446C | UCEC | 1 |
| p.S186P | LGG | 1 |
| p.I57V | STAD | 1 |
| p.P625S | COAD | 1 |
| p.D371N | GBM | 1 |
| p.R415Q | UCEC | 1 |
| p.R342K | SKCM | 1 |
| p.R380C | STAD | 1 |
| p.P515S | SKCM | 1 |
| p.W15L | LUSC | 1 |
| p.D176N | CESC | 1 |
| p.S241L | SKCM | 1 |
| p.E350* | UCEC | 1 |
| p.K634R | LUSC | 1 |
| p.E227K | SKCM | 1 |
| p.K211R | SKCM | 1 |
| p.D140N | SKCM | 1 |
| p.E417K | KIRC | 1 |
| p.E318K | UCEC | 1 |
| p.S484F | SKCM | 1 |
| p.S200L | SKCM | 1 |
| p.D356E | UCEC | 1 |
| p.D630Y | UCEC | 1 |
| p.P79A | BLCA | 1 |
| p.K686N | CESC | 1 |
| p.K60N | SKCM | 1 |
| p.D204N | SKCM | 1 |
| p.M247I | LUAD | 1 |
| p.F345I | LIHC | 1 |
| p.I48N | COAD | 1 |
| p.R100S | LUAD | 1 |
| p.Q188* | UCEC | 1 |
| p.I410K | SKCM | 1 |
| p.Q125K | LUAD | 1 |
| p.N98D | LUAD | 1 |
| p.E234K | SKCM | 1 |
| p.G393R | SKCM | 1 |
| p.L199H | STAD | 1 |
| p.S276L | BLCA | 1 |
| p.I623T | HNSC | 1 |
| p.D246H | LUAD | 1 |
| p.E374K | SKCM | 1 |
| p.Y493C | BRCA | 1 |
| p.D167N | SKCM | 1 |
| p.R338K | SKCM | 1 |
| p.E159V | LUSC | 1 |
| p.A17S | THYM | 1 |
| p.A552S | UCEC | 1 |
| p.P525L | STAD | 1 |
| p.E149K | SKCM | 1 |
| p.E256K | UCEC | 1 |
| p.P251S | SKCM | 1 |
| p.S299F | SKCM | 1 |
| p.H221Y | SKCM | 1 |
| p.G481A | HNSC | 1 |
| p.Y476D | BRCA | 1 |
| p.E205K | SKCM | 1 |
| p.Y385H | SKCM | 1 |
| p.A156T | LGG | 1 |
| p.S585L | SKCM | 1 |
| p.S367T | COAD | 1 |
| p.D329N | SKCM | 1 |
| p.K433N | SARC | 1 |
| p.A237S | HNSC | 1 |
| p.Q531K | SKCM | 1 |
| p.S89L | SKCM | 1 |
| p.S241* | LUAD | 1 |
| p.P310S | SKCM | 1 |
| p.V220A | STAD | 1 |
| p.S69P | UCS | 1 |
| p.Q401E | ESCA | 1 |
| p.D166N | SKCM | 1 |
| p.E608K | SKCM | 1 |
| p.R415Q | SKCM | 1 |
| p.A267T | SKCM | 1 |
| p.I410K | LGG | 1 |
| p.S312R | SKCM | 1 |
| p.E460Q | LUSC | 1 |
| p.E432K | SKCM | 1 |
| p.R100K | UCEC | 1 |
| p.R415Q | LUSC | 1 |
| p.S258N | UCEC | 1 |
| p.E99K | SKCM | 1 |
| p.S412C | OV | 1 |
| p.A237V | STAD | 1 |
| p.E113D | UCEC | 1 |
| p.Q452P | LUSC | 1 |
| p.W582R | SARC | 1 |
| p.A427T | LGG | 1 |
| p.S463I | KIRC | 1 |
| p.R441S | MESO | 1 |
| p.R338I | UCEC | 1 |
| p.E615K | SKCM | 1 |
| p.K235T | ESCA | 1 |
| p.A229T | UCEC | 1 |
| p.D166Y | LUAD | 1 |
| p.D550G | STAD | 1 |
| p.D202N | SKCM | 1 |
| p.F586C | UCEC | 1 |
| p.L665I | UCS | 1 |
| p.D631N | SKCM | 1 |
| p.D370V | SKCM | 1 |
| p.M535L | GBM | 1 |
| p.E201K | SKCM | 1 |
| p.L145P | LUAD | 1 |
| p.S276L | SKCM | 1 |
| p.Q62* | SKCM | 1 |
| p.E391D | SKCM | 1 |
| p.R380C | BLCA | 1 |
| p.S488Y | UCEC | 1 |
| p.S320L | SKCM | 1 |
| p.W406* | HNSC | 1 |
| p.P269L | SKCM | 1 |
| p.E257K | SKCM | 1 |
| p.A307V | BRCA | 1 |
| p.M250V | READ | 1 |
| p.D631Y | CESC | 1 |
| p.K136N | SKCM | 1 |
| p.S200L | READ | 1 |
| p.L541I | UCS | 1 |
| p.Q62X | SKCM | 1 |
| p.V616I | LUAD | 1 |
| p.E54K | SKCM | 1 |
| p.S355Y | STAD | 1 |
| p.M545I | SKCM | 1 |
| p.Q614E | STAD | 1 |
| p.E417D | UCEC | 1 |
| p.D475A | READ | 1 |
| Top |
| TissGeneCNV for MUM1L1 |
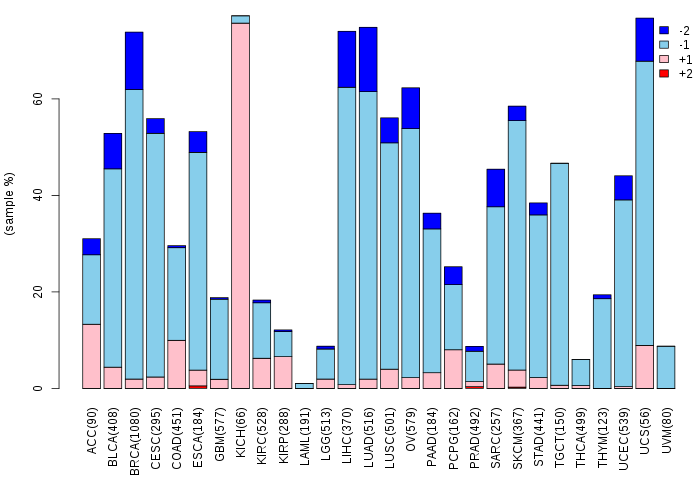
| Copy number variations of TissGene across 28 cancer types (X-axis: cancer type and Y-axis: % of CNV samples) (TCGA Gistic2_CopyNumber_Gistic2_all_data_by_genes, Gistic2 copy number data, version 2016-08-16) |
 |
| Top |
| TissGeneFusions for MUM1L1 |
| Fusion genes including TissGene (ChimerDB 3.0, 2016-12-01 and TCGA fusion Portal 2015-12-01) |
| Database | Src | Cancer type | Sample | Fusion gene | ORF | 5'-gene BP | 3'-gene BP |
| Top |
| TissGeneNet for MUM1L1 |
| Co-expressed gene networks based on protein-protein interaction data (CePIN) (TCGA IlluminaHiSeq_RNASeqV2, pan-cancer normalized log2(norm_counts+1) data, version 2016-08-16) (PINA2 ppi data) |
| Top |
| TissGeneProg for MUM1L1 |
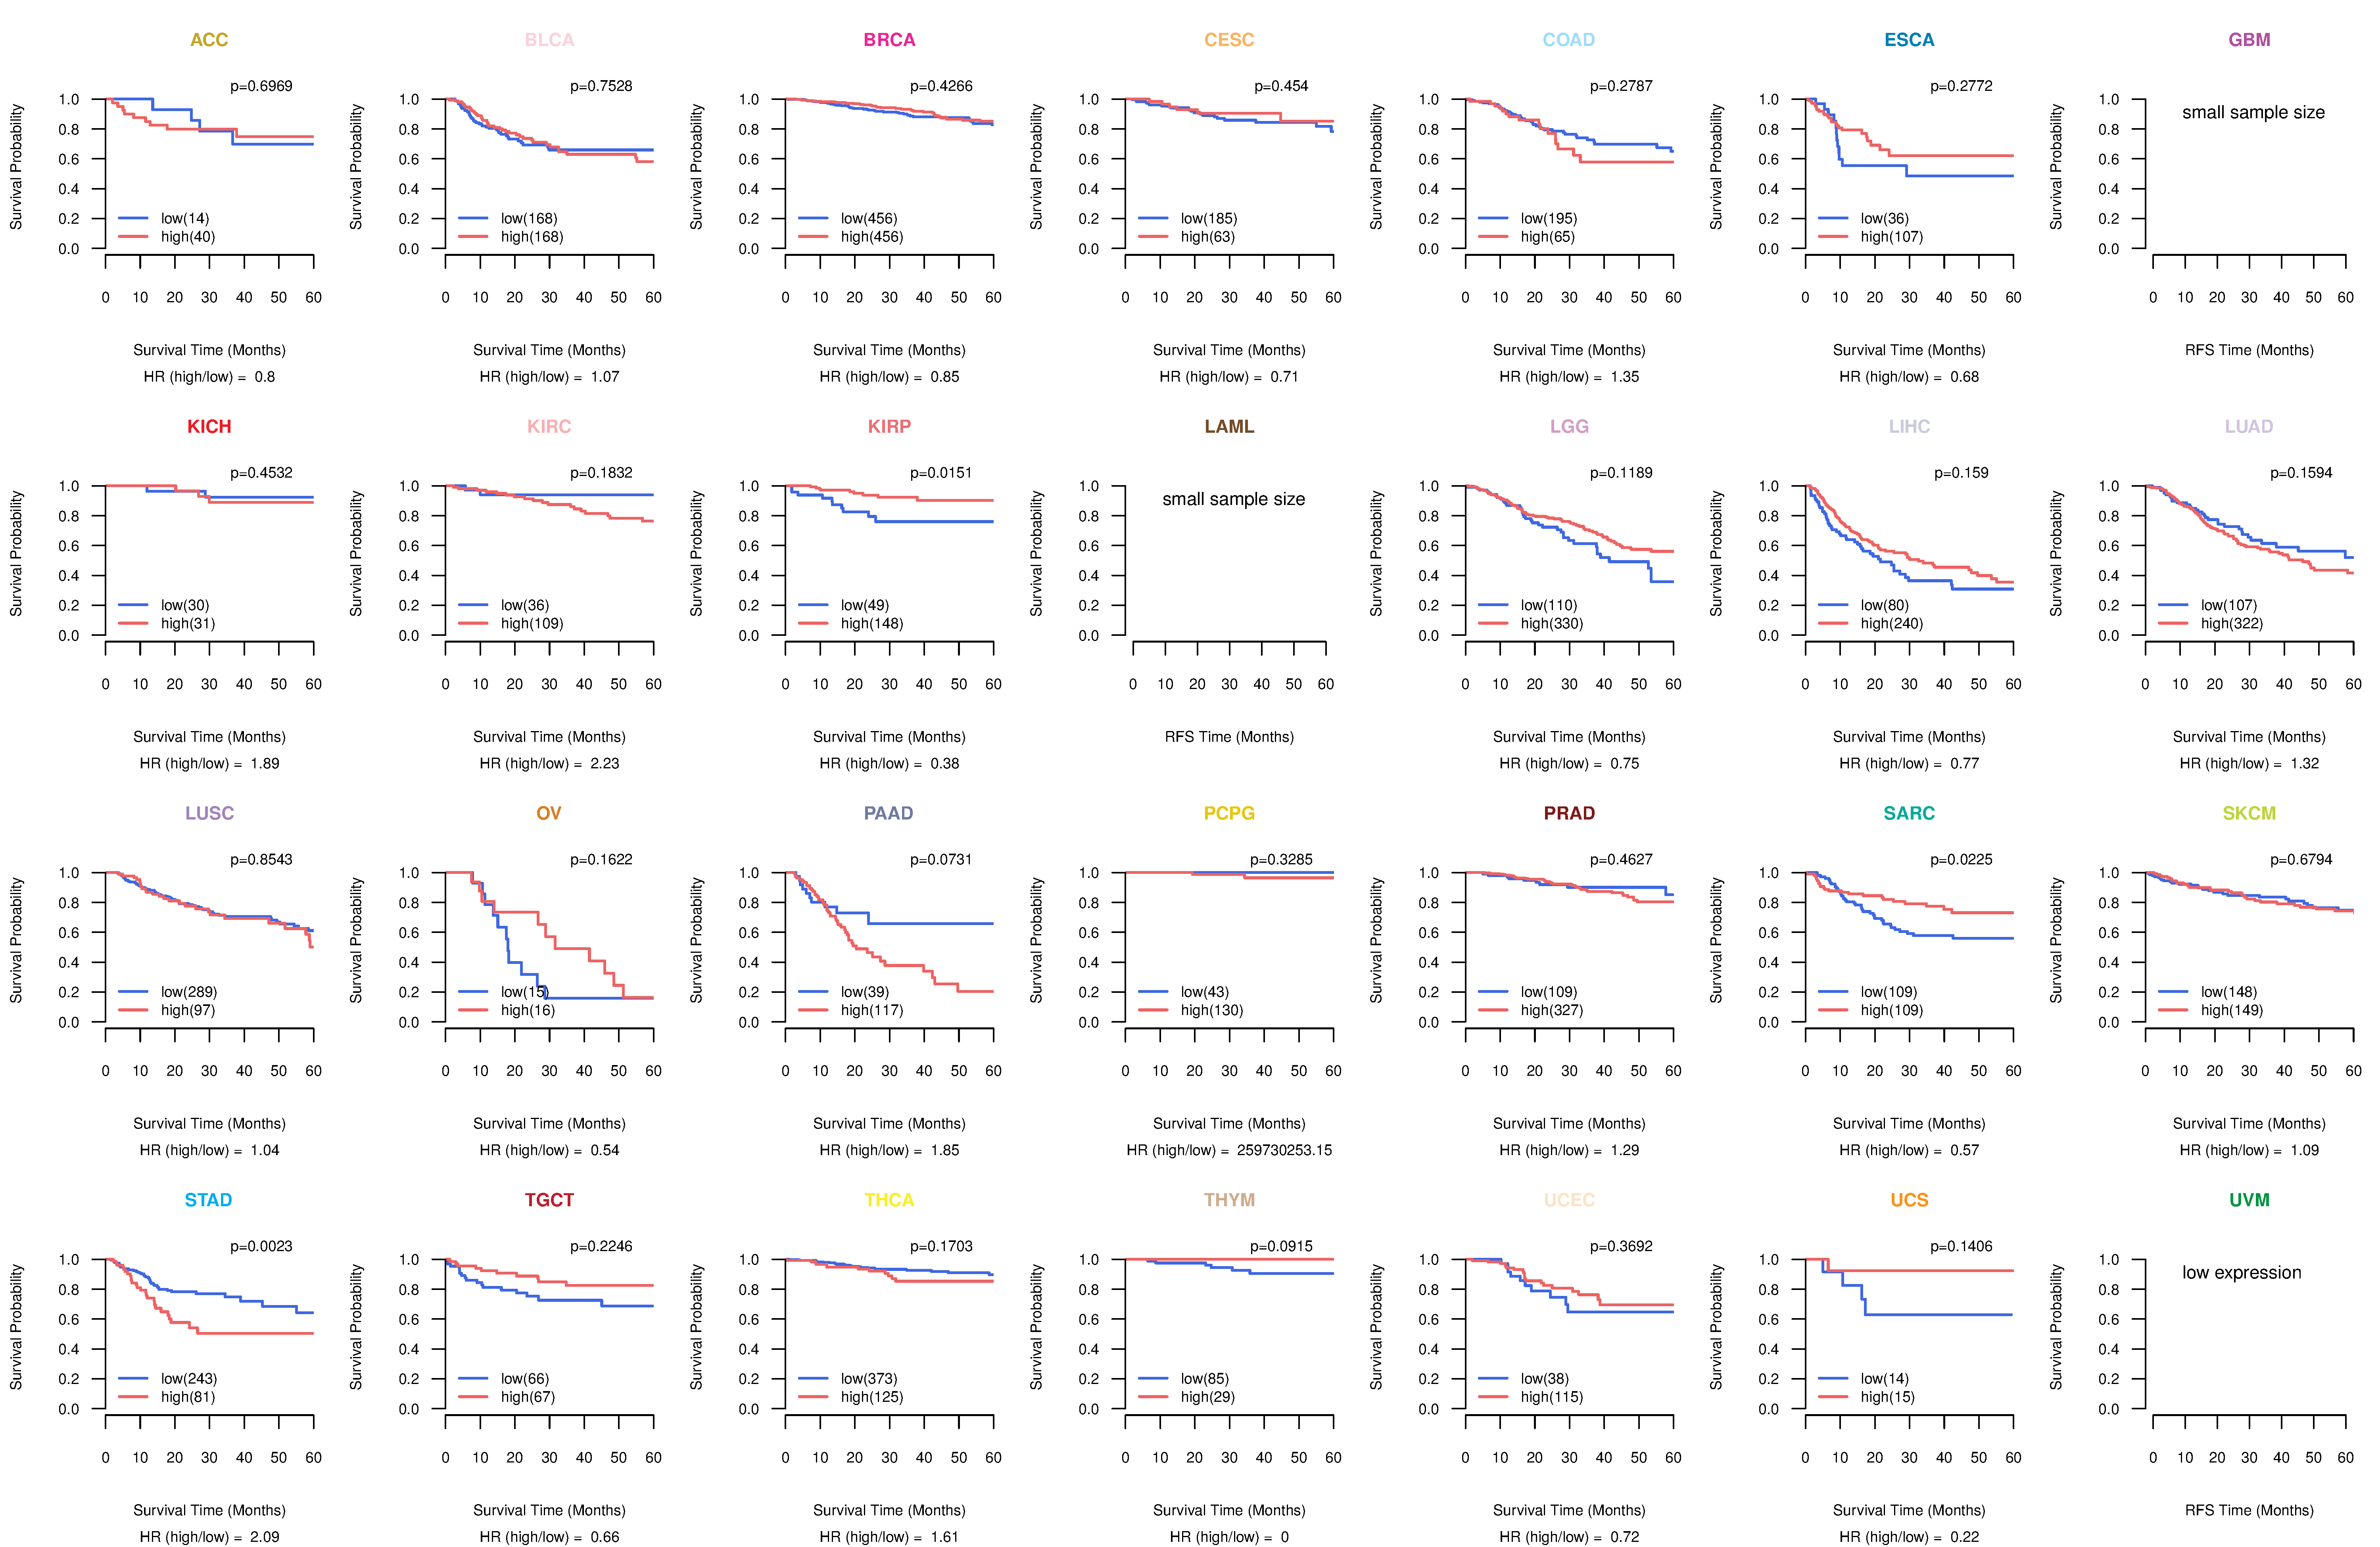
| Kaplan-Meier plots with logrank tests of overall survival (OS) using 28 cancer types (TCGA IlluminaHiSeq_RNASeqV2, pan-cancer normalized log2(norm_counts+1) data, version 2016-08-16) (TCGA clinicalMatrix, phenotype data, version 2016-04-27) * Click on the image to enlarge it in a new window. |
 |
| Kaplan-Meier plots with logrank test of relapse free survival (RFS) using 28 cancer types (TCGA IlluminaHiSeq_RNASeqV2, pan-cancer normalized log2(norm_counts+1) data, version 2016-08-16) (TCGA clinicalMatrix, phenotype data, version 2016-04-27) * Click on the image enlarge it in a new window. |
 |
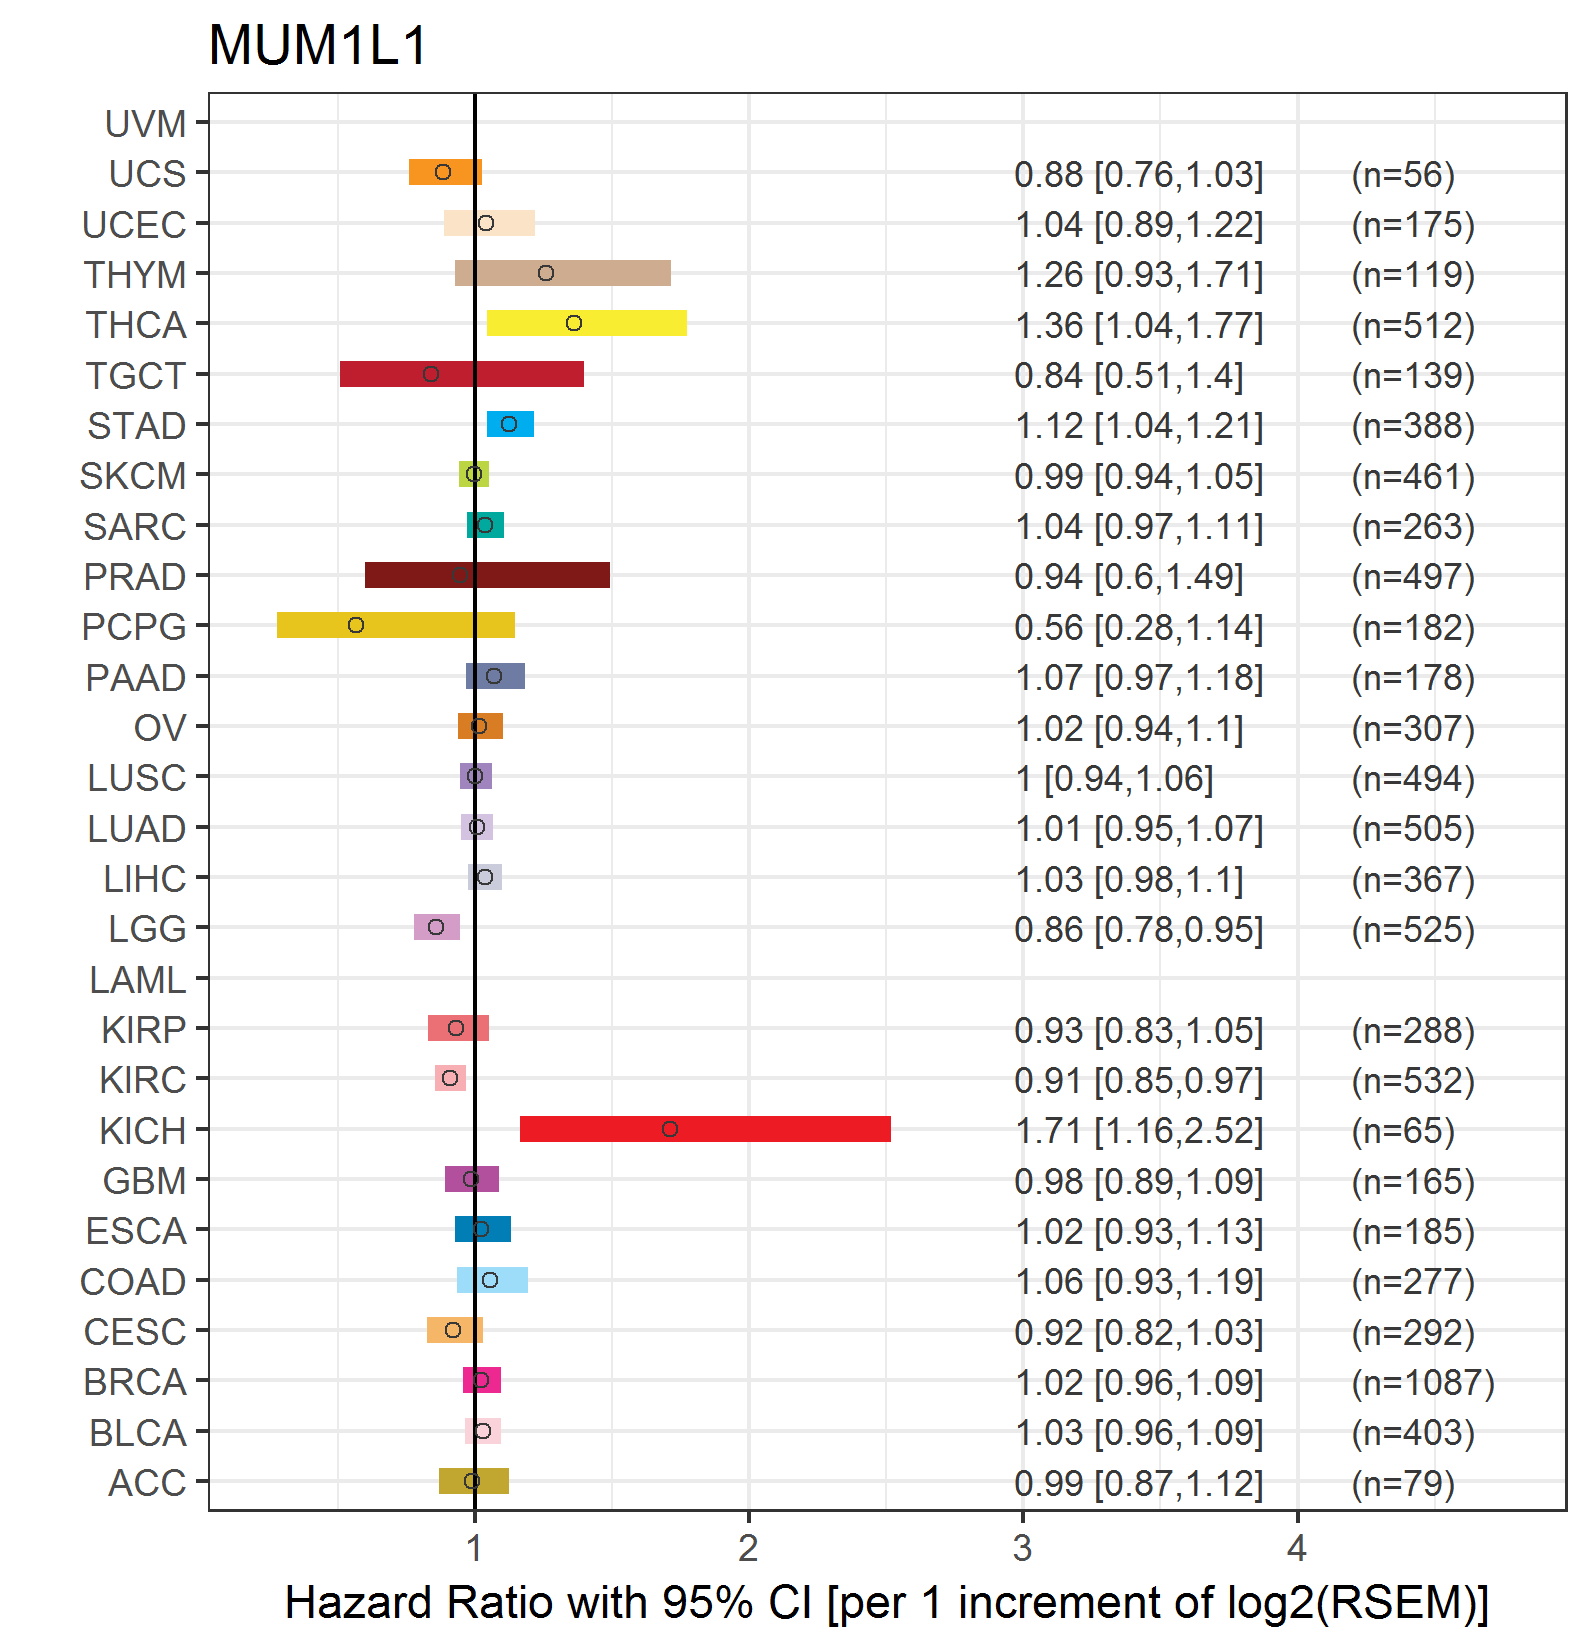
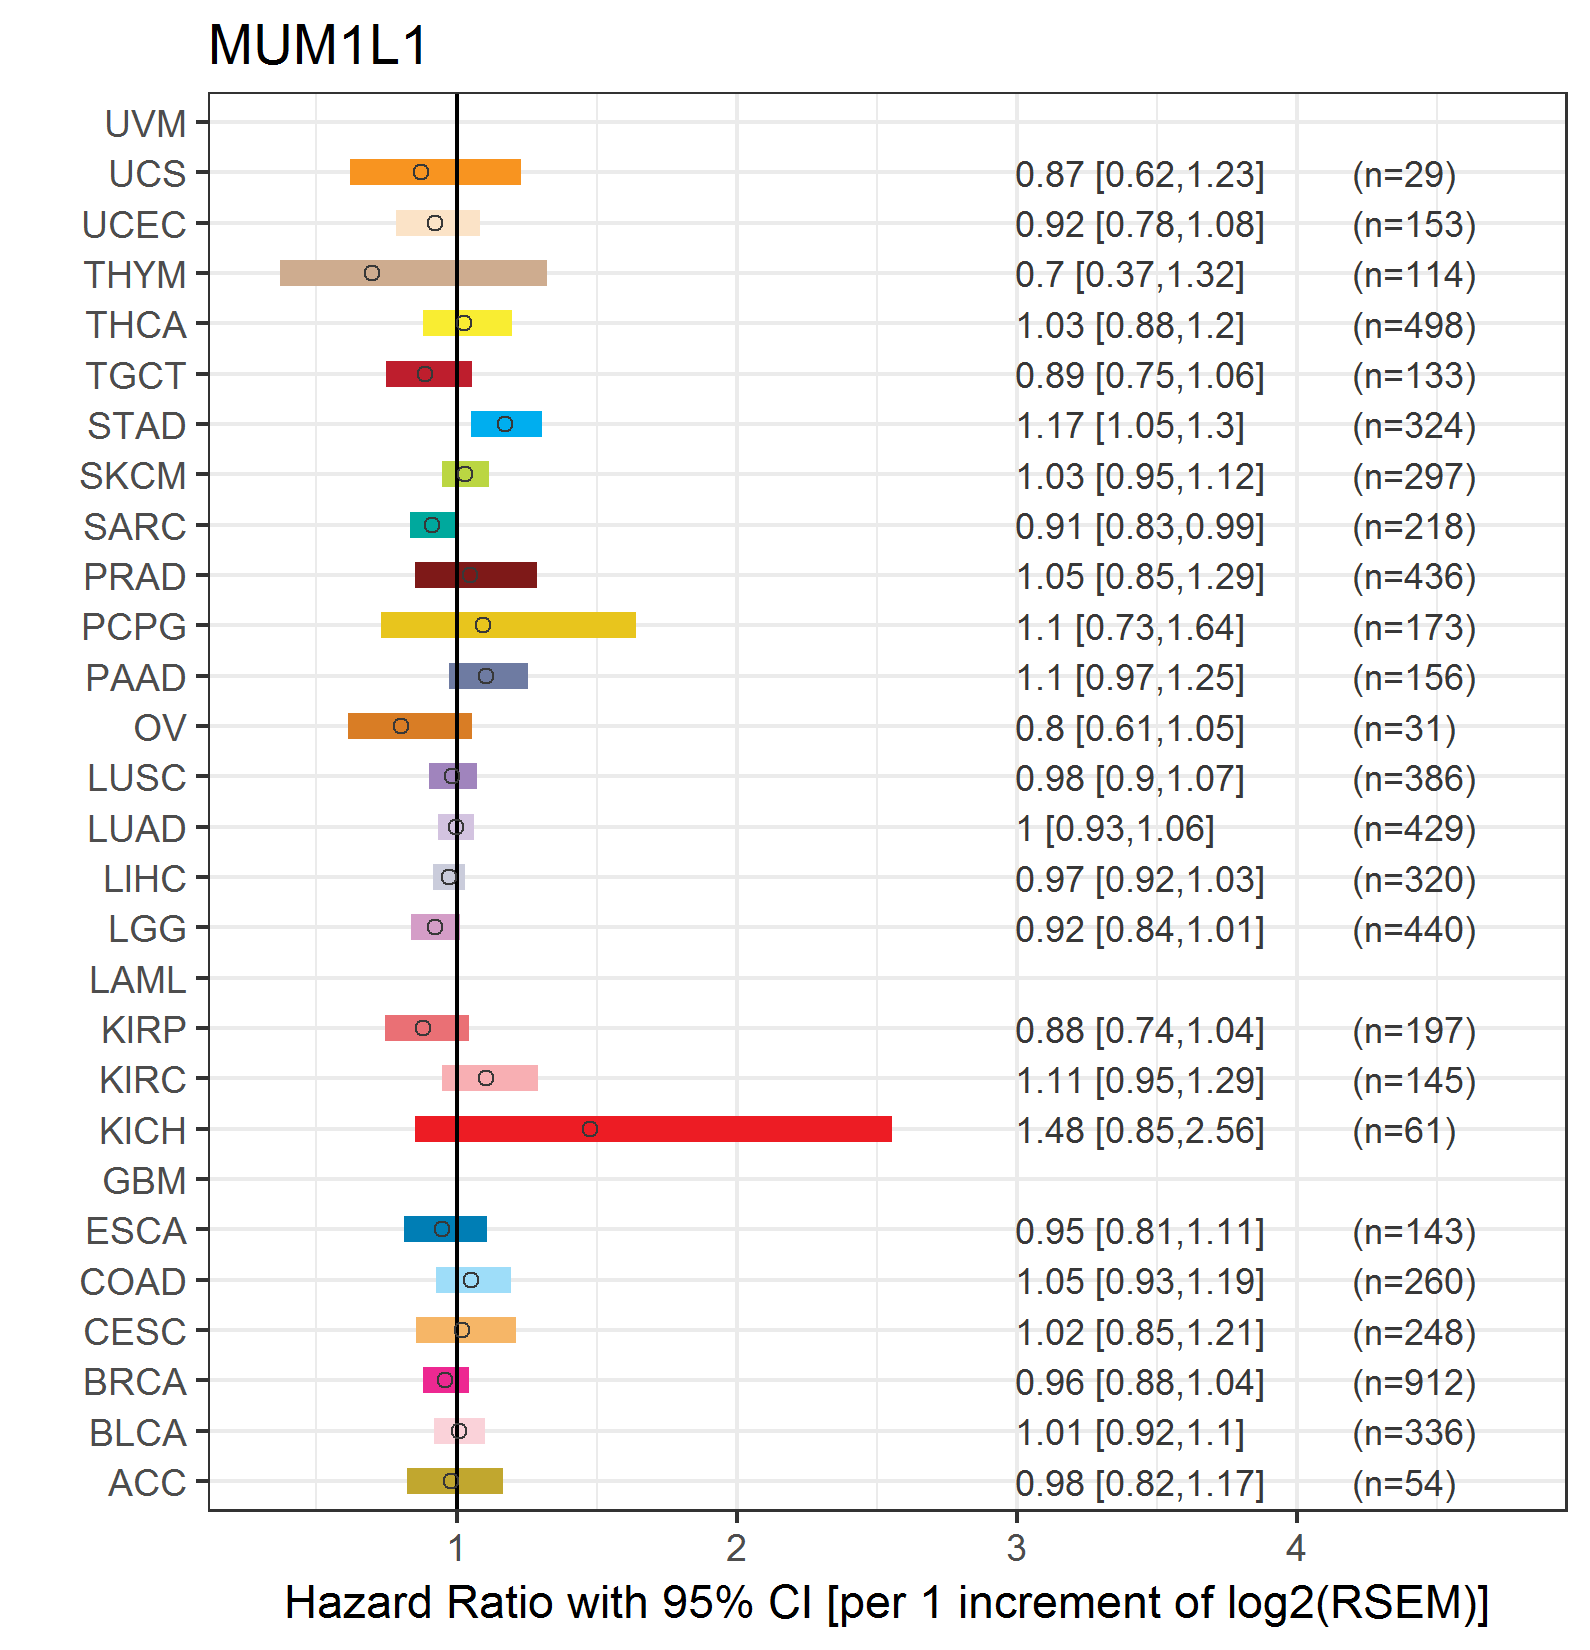
| Forest plot of Cox proportional hazard ratio (HR) and 95% CI of overall survival (OS) using 28 cancer types (TCGA IlluminaHiSeq_RNASeqV2, pan-cancer normalized log2(norm_counts+1) data, version 2016-08-16) (TCGA clinicalMatrix, phenotype data, version 2016-04-27) * Click on the image enlarge it in a new window. |
 |
| Forest plot of Cox proportional hazard ratio (HR) and 95% CI of relapse free survival (RFS) using 28 cancer types (TCGA IlluminaHiSeq_RNASeqV2, pan-cancer normalized log2(norm_counts+1) data, version 2016-08-16) (TCGA clinicalMatrix, phenotype data, version 2016-04-27) * Click on the image enlarge it in a new window. |
 |
| Top |
| TissGeneClin for MUM1L1 |
| TissGeneDrug for MUM1L1 |
| Drug information targeting TissGene (DrugBank Version 5.0.6, 2017-04-01) |
| DrugBank ID | Drug name | Drug activity | Drug type | Drug status |
| Top |
| TissGeneDisease for MUM1L1 |
| Disease information associated with TissGene (DisGeNet, 2016-06-01) |
| Disease ID | Disease name | # pubmeds | Source |
|
Copyright 2016-Present - The University of Texas Health Science Center at Houston (UTHealth) Web File Viewing | How to Report, Fraud, Waste and Abuse | State of Texas | Statewide Search | Texas Homeland Security | Site Policies |