 |
| |
| |
| |
| |
| |
| |
|

| TissGeneSummary for ASB9 |
 Gene summary Gene summary |
| Basic gene information | Gene symbol | ASB9 |
| Gene name | ankyrin repeat and SOCS box containing 9 | |
| Synonyms | - | |
| Cytomap | UCSC genome browser: Xp22.2 | |
| Type of gene | protein-coding | |
| RefGenes | NM_001031739.2, NM_001168530.1,NM_001168531.1,NM_024087.2, | |
| Description | ASB-9ankyrin repeat and SOCS box protein 9ankyrin repeat and SOCS box-containing 9ankyrin repeat and suppressor of cytokine signaling box protein 9 | |
| Modification date | 20141207 | |
| dbXrefs | MIM : 300890 | |
| HGNC : HGNC | ||
| Ensembl : ENSG00000102048 | ||
| HPRD : 06452 | ||
| Vega : OTTHUMG00000021172 | ||
| Protein | UniProt: go to UniProt's Cross Reference DB Table | |
| Expression | CleanEX: HS_ASB9 | |
| BioGPS: 140462 | ||
| Pathway | NCI Pathway Interaction Database: ASB9 | |
| KEGG: ASB9 | ||
| REACTOME: ASB9 | ||
| Pathway Commons: ASB9 | ||
| Context | iHOP: ASB9 | |
| ligand binding site mutation search in PubMed: ASB9 | ||
| UCL Cancer Institute: ASB9 | ||
| Assigned class in TissGDB* | C | |
| Included tissue-specific gene expression resources | TiGER,GTEx | |
| Specific-tissues in normal samples (assigned by TissGDB using HPA, TiGER, and GTEx) | PancreasTestis | |
| Cancer types related to the specific-tissues in cancer samples (assigned by TissGDB using TCGA) | PAADTGCT | |
| Reference showing the relevant tissue of ASB9 | ||
| Description by TissGene annotations | ||
| * Class A consists of genes with literature evidence and is part of the cTissGenes. Class B consists of only cTissGenes without additional evidence. The remaining genes belong to Class C. |
| Gene ontology having evidence of Inferred from Direct Assay (IDA) from Entrez |
| GO ID | GO term | PubMed ID | GO:0016567 | protein ubiquitination | 17148442 | GO:0045732 | positive regulation of protein catabolic process | 17148442 | GO:0016567 | protein ubiquitination | 17148442 | GO:0045732 | positive regulation of protein catabolic process | 17148442 |
| Top |
| TissGeneExp for ASB9 |
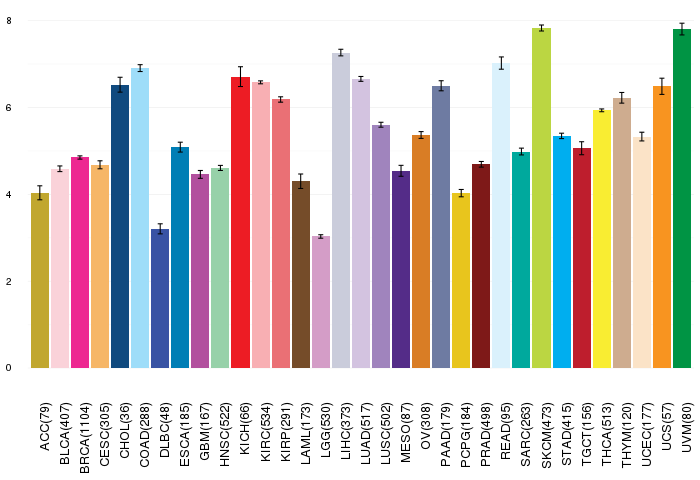
| Gene expressions across 28 cancer types (X-axis: cancer type and Y-axis: log2(norm_counts+1)) (TCGA IlluminaHiSeq_RNASeqV2, pan-cancer normalized log2(norm_counts+1) data, version 2016-08-16) |
 |
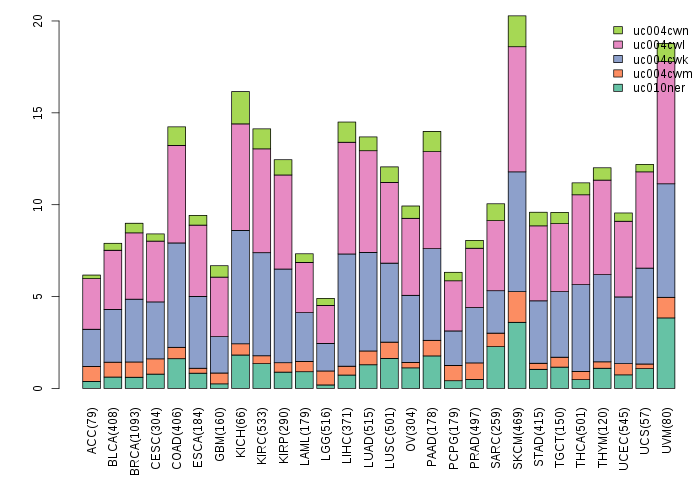
| Gene isoform expressions across 28 cancer types (X-axis: cancer type and Y-axis: log2(norm_counts+1)) (TCGA pan-cancer tcga_rsem_isoform_tpm, version 2016-09-01) |
 |
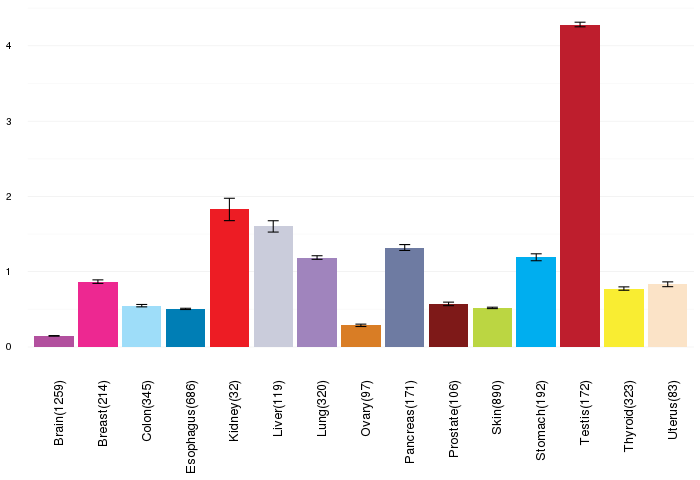
| Gene expressions across normal tissues of GTEx data (GTEx GTEx_Analysis_v6_RNA-seq_RNA-SeQCv1.1.8_gene_rpkm.gct) - Here, we shows the matched tissue types only among our 28 cancer types. |
 |
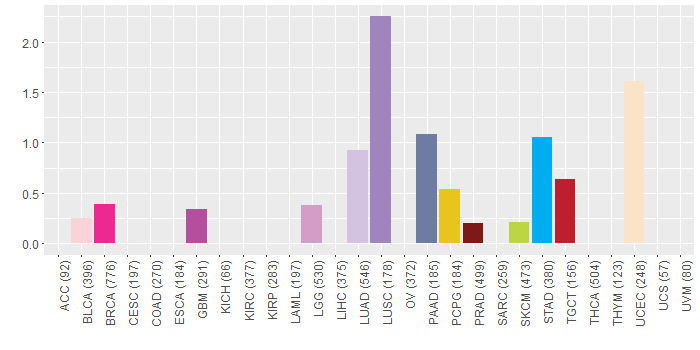
| Different expressions across 14 cancer types with more than 10 samples between matched tumors and normals (X-axis: cancer type and Y-axis: log2(norm_counts+1)) (TCGA IlluminaHiSeq_RNASeqV2, pan-cancer normalized log2(norm_counts+1) data, version 2016-08-16) |
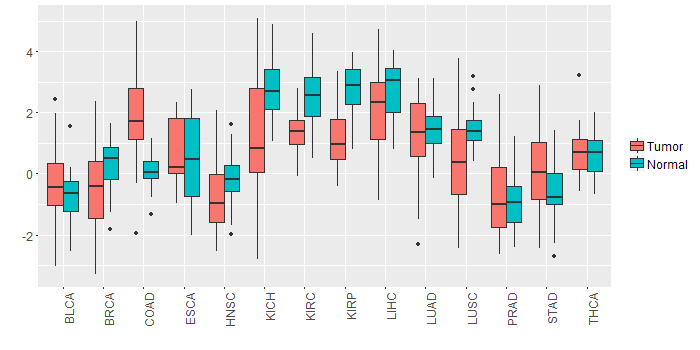 |
| - Significantly differentially expressed cancer types and information. (|Fold change|>1 and FDR<0.05) |
| Cancer type | Mean(exp) in tumor | Mean(exp) in matched normal | Log2FC | P-val. | FDR |
| KIRC | 1.346594595 | 2.541198761 | -1.194604167 | 1.41E-16 | 8.02E-16 |
| COAD | 1.832736689 | 0.099263612 | 1.733473077 | 1.08E-06 | 6.07E-06 |
| KIRP | 1.1193939 | 2.782159525 | -1.662765625 | 2.76E-10 | 2.91E-09 |
| LUSC | 0.388980052 | 1.474231033 | -1.08525098 | 8.79E-06 | 2.01E-05 |
| KICH | 1.36228515 | 2.76135715 | -1.399072 | 0.00209 | 0.004273061 |
| Top |
| TissGene-miRNA for ASB9 |
| Significantly anti-correlated miRNAs of TissGene across 28 cancer types (Gene-miRNA relations from TargetScanHuman Relsease 7.1, Conserved_Site_Context_Scores.txt.zip, 06.01.2016) (TCGA IlluminaHiSeq_miRNASeq, log2(RPM+1) data, version 2016-11-21) (TCGA IlluminaHiSeq_RNASeqV2, log2(normalized_count+1) data, version 2016-08-16) (Spearman’s Rank Correlation (p-value<0.05 and coefficient<-0.25)) |
| Cancer type | miRNA id | miRNA accession | P-val. | Coeff. | # samples |
| Top |
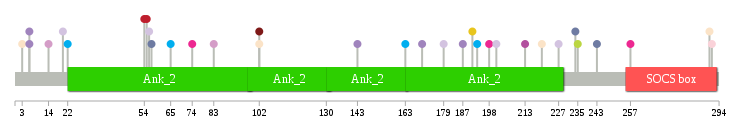
| TissGeneMut for ASB9 |
| TissGeneSNV for ASB9 |
| nsSNV counts per each loci. Different colors of circles represent different cancer types. Circle size denotes number of samples. (TCGA somatic mutation (SNPs and small INDELs) data, version 2016-04-25) * Click on the image to enlarge it in a new window. |
 |
 |
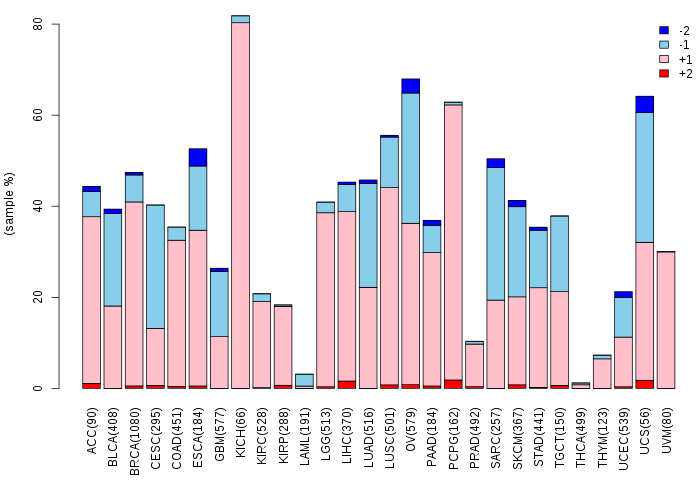
| Somatic nucleotide variants of TissGene across 28 cancer types (X-axis: cancer type and Y-axis: % of mutated samples) The numbers in parentheses are numbers of samples with mutation (nsSNVs). (TCGA somatic mutation (SNPs and small INDELs) data, version 2016-04-25) |
 |
| - nsSNVs sorted by frequency. |
| AAchange | Cancer type | # samples |
| p.G3D | UCEC | 1 |
| p.V193A | STAD | 1 |
| p.G6R | LUSC | 1 |
| p.R234C | PAAD | 1 |
| p.I65T | STAD | 1 |
| p.F290L | UCEC | 1 |
| p.L55F | TGCT | 1 |
| p.E213* | GBM | 1 |
| p.I56F | LUAD | 1 |
| p.Q179R | LUAD | 1 |
| p.L291F | BLCA | 1 |
| p.S83F | LGG | 1 |
| p.A14T | LGG | 1 |
| p.S57I | PAAD | 1 |
| p.P20H | LUAD | 1 |
| p.W102* | PRAD | 1 |
| p.H74R | BRCA | 1 |
| p.L187V | LUSC | 1 |
| p.G6V | LUSC | 1 |
| p.S201Y | LUAD | 1 |
| p.W102* | UCEC | 1 |
| p.N54K | TGCT | 1 |
| p.A227S | LUAD | 1 |
| p.R143W | LUSC | 1 |
| p.P170T | LUSC | 1 |
| p.I22S | STAD | 1 |
| p.A215S | HNSC | 1 |
| p.A191V | PCPG | 1 |
| p.S257P | BRCA | 1 |
| p.K163T | STAD | 1 |
| p.G198D | BRCA | 1 |
| p.E188* | HNSC | 1 |
| p.S243N | PAAD | 1 |
| p.D220N | UCEC | 1 |
| p.P235S | SKCM | 1 |
| Top |
| TissGeneCNV for ASB9 |
| Copy number variations of TissGene across 28 cancer types (X-axis: cancer type and Y-axis: % of CNV samples) (TCGA Gistic2_CopyNumber_Gistic2_all_data_by_genes, Gistic2 copy number data, version 2016-08-16) |
 |
| Top |
| TissGeneFusions for ASB9 |
| Fusion genes including TissGene (ChimerDB 3.0, 2016-12-01 and TCGA fusion Portal 2015-12-01) |
| Database | Src | Cancer type | Sample | Fusion gene | ORF | 5'-gene BP | 3'-gene BP |
| TCGAfusionPortal | PRADA | GBM | TCGA-06-2569-01A | WDR59-ASB9 | Out-of-frame | Chr16:74942806 | ChrX:15272966 |
| TCGAfusionPortal | PRADA | LUAD | TCGA-78-7146-01A | TRIM41-ASB9 | Out-of-frame | Chr5:180651812 | ChrX:15277067 |
| Top |
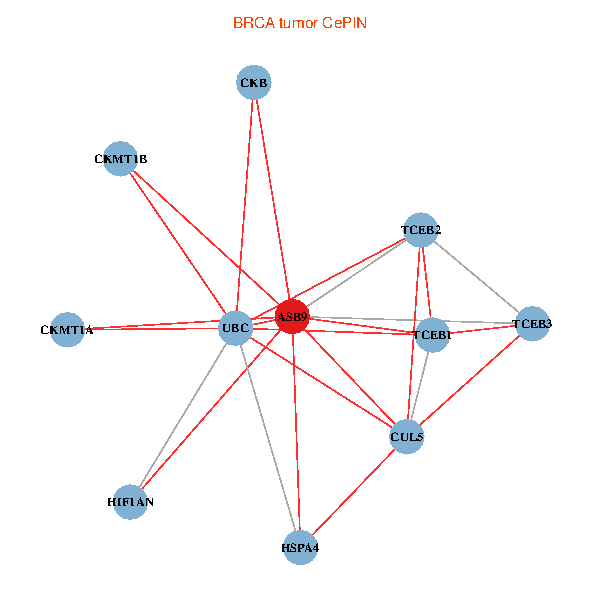
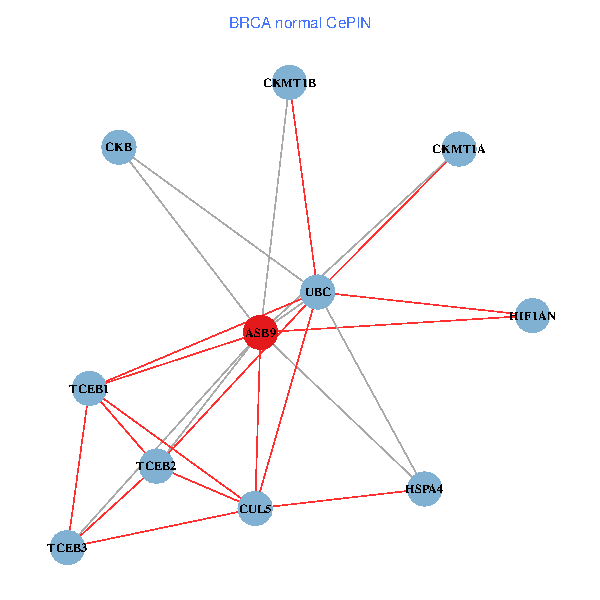
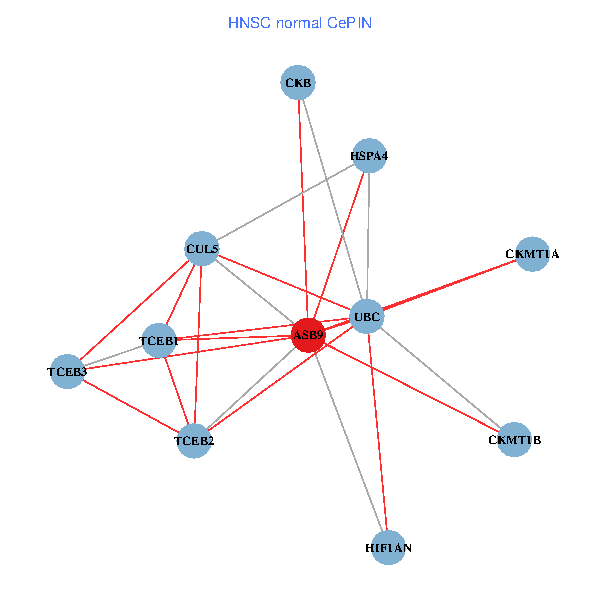
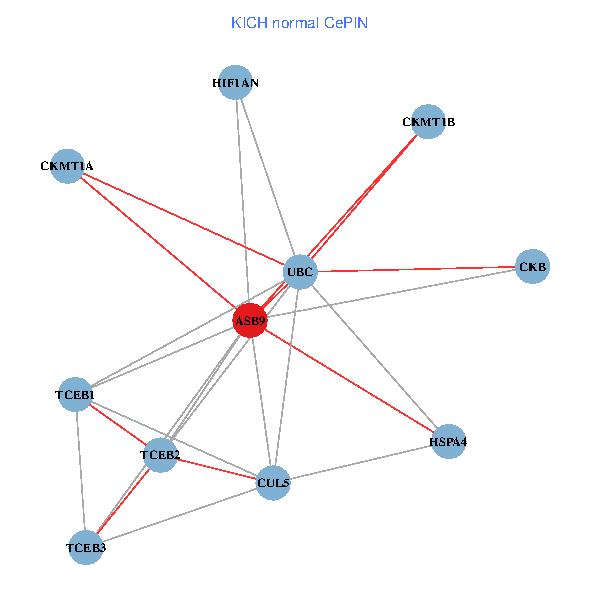
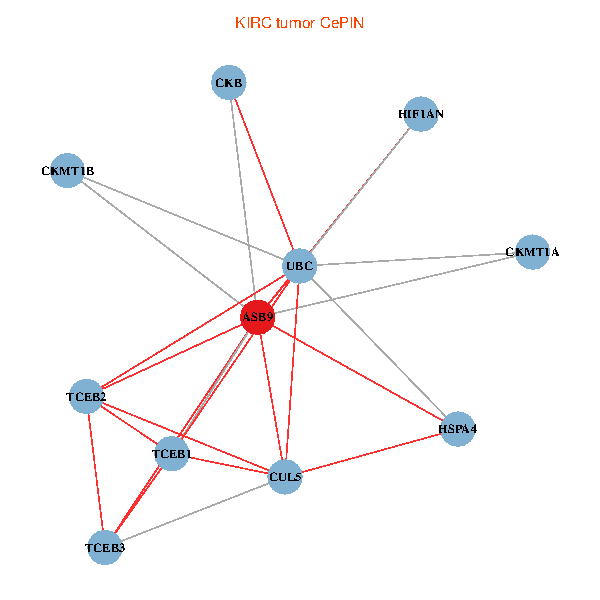
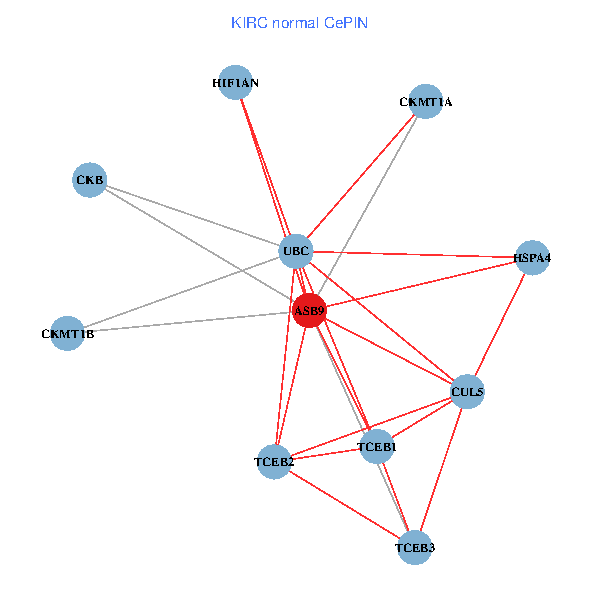
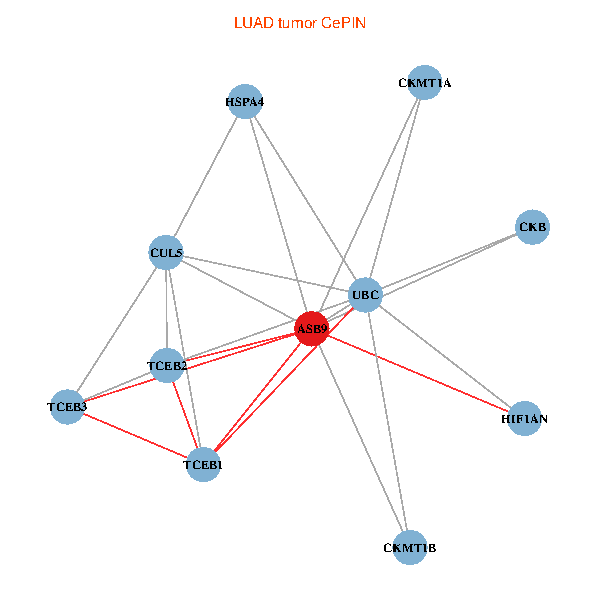
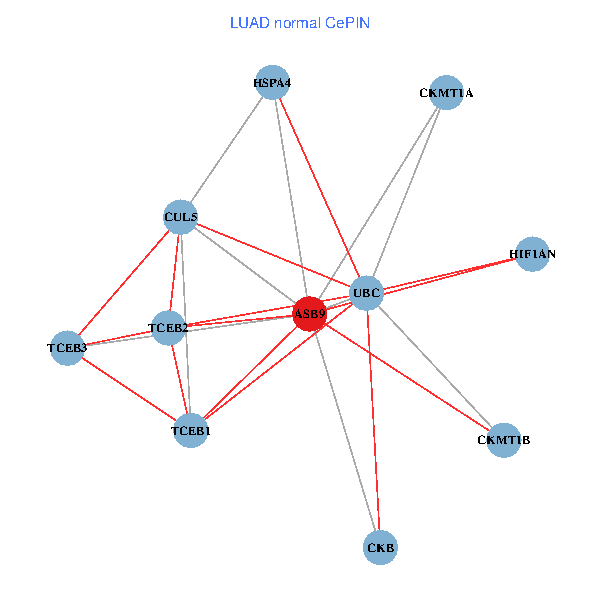
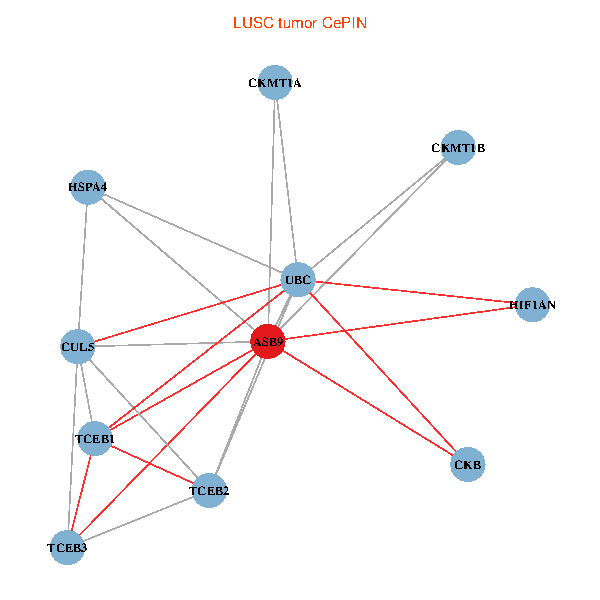
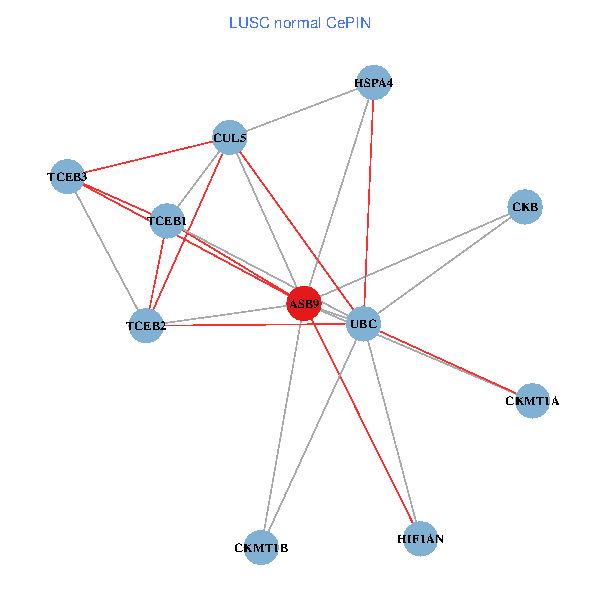
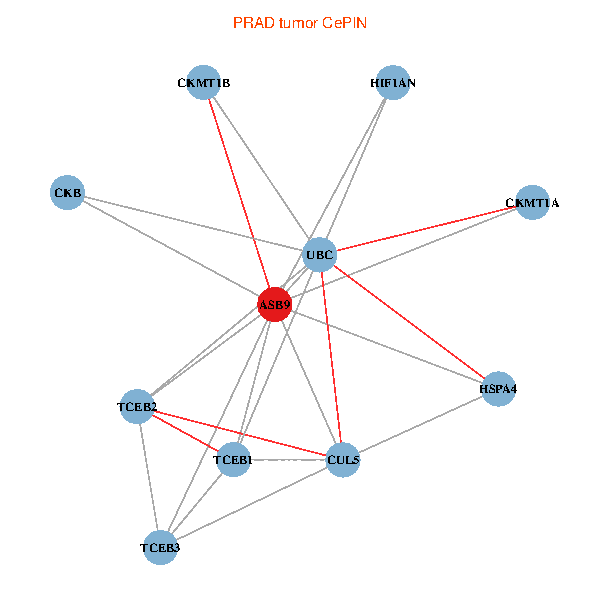
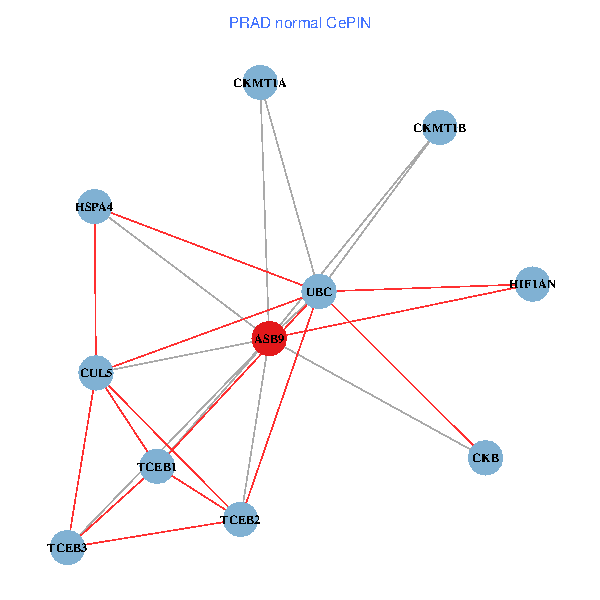
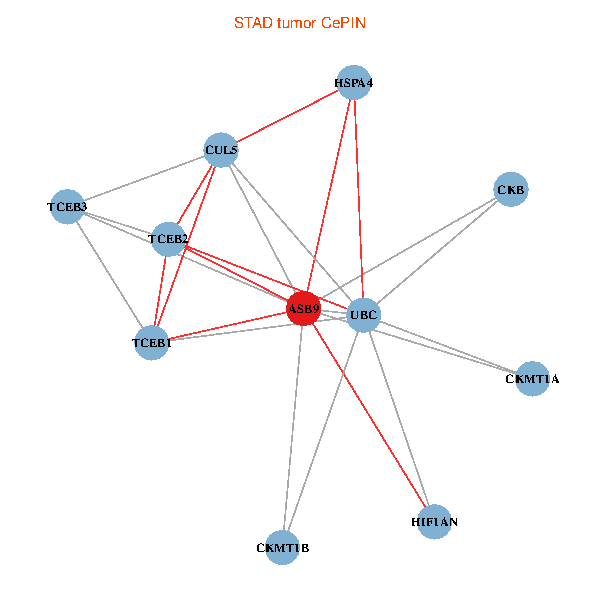
| TissGeneNet for ASB9 |
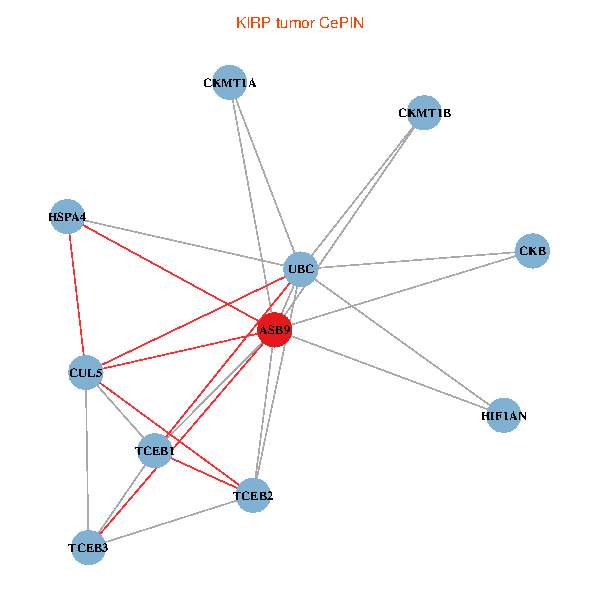
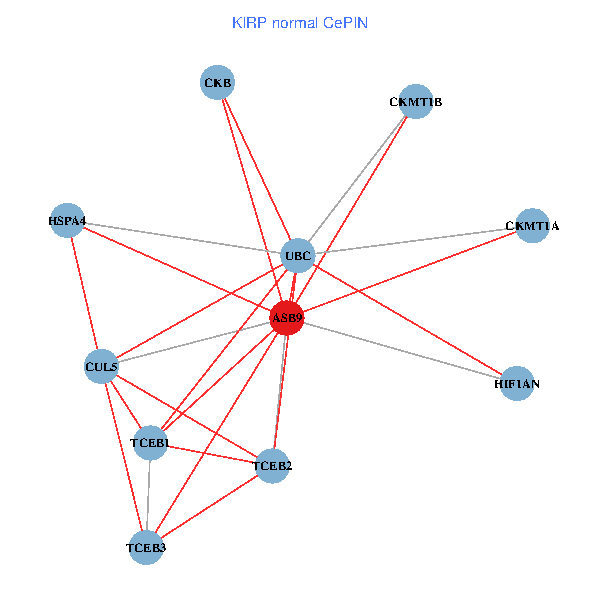
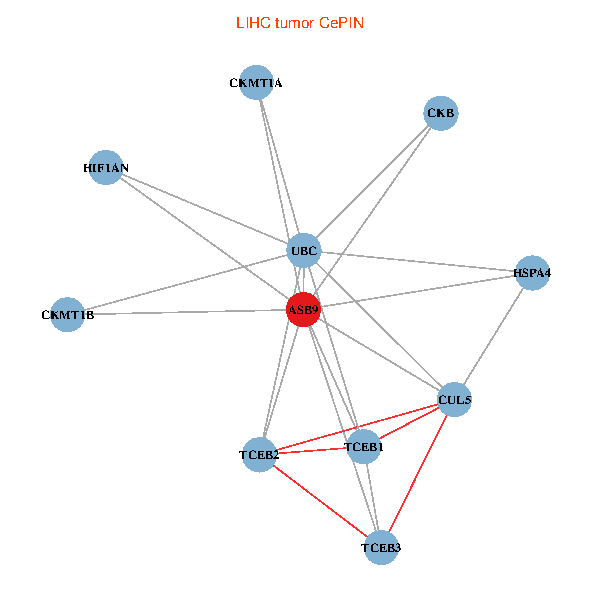
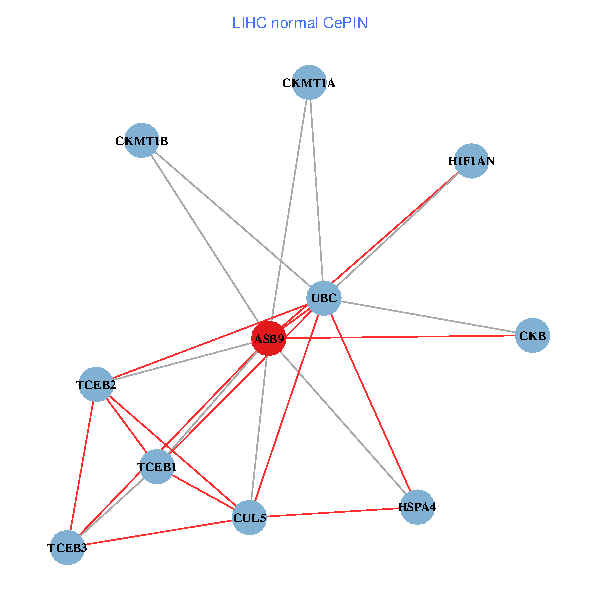
| Co-expressed gene networks based on protein-protein interaction data (CePIN) (TCGA IlluminaHiSeq_RNASeqV2, pan-cancer normalized log2(norm_counts+1) data, version 2016-08-16) (PINA2 ppi data) |
| BRCA (tumor) | BRCA (normal) |
| ASB9, CUL5, UBC, HSPA4, TCEB3, TCEB1, TCEB2, CKMT1A, CKB, HIF1AN, CKMT1B (tumor) | ASB9, CUL5, UBC, HSPA4, TCEB3, TCEB1, TCEB2, CKMT1A, CKB, HIF1AN, CKMT1B (normal) |
 |  |
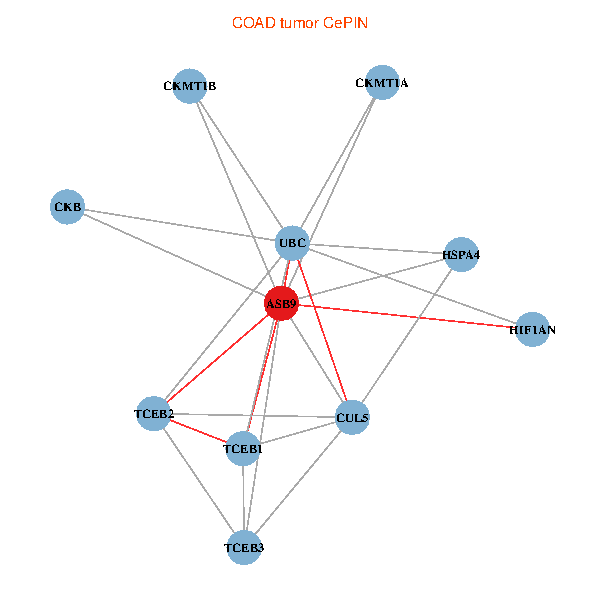
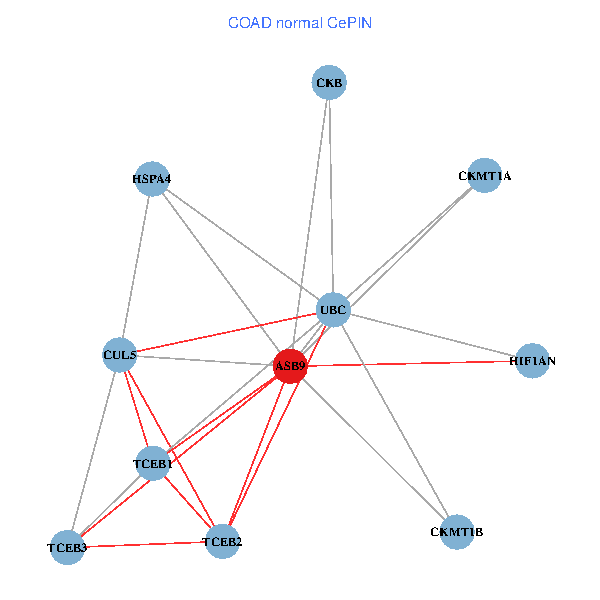
| COAD (tumor) | COAD (normal) |
| ASB9, CUL5, UBC, HSPA4, TCEB3, TCEB1, TCEB2, CKMT1A, CKB, HIF1AN, CKMT1B (tumor) | ASB9, CUL5, UBC, HSPA4, TCEB3, TCEB1, TCEB2, CKMT1A, CKB, HIF1AN, CKMT1B (normal) |
 |  |
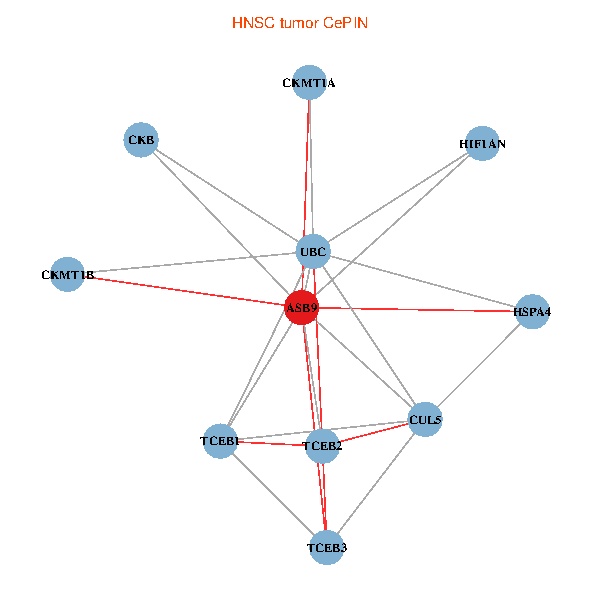
| HNSC (tumor) | HNSC (normal) |
| ASB9, CUL5, UBC, HSPA4, TCEB3, TCEB1, TCEB2, CKMT1A, CKB, HIF1AN, CKMT1B (tumor) | ASB9, CUL5, UBC, HSPA4, TCEB3, TCEB1, TCEB2, CKMT1A, CKB, HIF1AN, CKMT1B (normal) |
 |  |
| KICH (tumor) | KICH (normal) |
| ASB9, CUL5, UBC, HSPA4, TCEB3, TCEB1, TCEB2, CKMT1A, CKB, HIF1AN, CKMT1B (tumor) | ASB9, CUL5, UBC, HSPA4, TCEB3, TCEB1, TCEB2, CKMT1A, CKB, HIF1AN, CKMT1B (normal) |
 |  |
| KIRC (tumor) | KIRC (normal) |
| ASB9, CUL5, UBC, HSPA4, TCEB3, TCEB1, TCEB2, CKMT1A, CKB, HIF1AN, CKMT1B (tumor) | ASB9, CUL5, UBC, HSPA4, TCEB3, TCEB1, TCEB2, CKMT1A, CKB, HIF1AN, CKMT1B (normal) |
 |  |
| KIRP (tumor) | KIRP (normal) |
| ASB9, CUL5, UBC, HSPA4, TCEB3, TCEB1, TCEB2, CKMT1A, CKB, HIF1AN, CKMT1B (tumor) | ASB9, CUL5, UBC, HSPA4, TCEB3, TCEB1, TCEB2, CKMT1A, CKB, HIF1AN, CKMT1B (normal) |
 |  |
| LIHC (tumor) | LIHC (normal) |
| ASB9, CUL5, UBC, HSPA4, TCEB3, TCEB1, TCEB2, CKMT1A, CKB, HIF1AN, CKMT1B (tumor) | ASB9, CUL5, UBC, HSPA4, TCEB3, TCEB1, TCEB2, CKMT1A, CKB, HIF1AN, CKMT1B (normal) |
 |  |
| LUAD (tumor) | LUAD (normal) |
| ASB9, CUL5, UBC, HSPA4, TCEB3, TCEB1, TCEB2, CKMT1A, CKB, HIF1AN, CKMT1B (tumor) | ASB9, CUL5, UBC, HSPA4, TCEB3, TCEB1, TCEB2, CKMT1A, CKB, HIF1AN, CKMT1B (normal) |
 |  |
| LUSC (tumor) | LUSC (normal) |
| ASB9, CUL5, UBC, HSPA4, TCEB3, TCEB1, TCEB2, CKMT1A, CKB, HIF1AN, CKMT1B (tumor) | ASB9, CUL5, UBC, HSPA4, TCEB3, TCEB1, TCEB2, CKMT1A, CKB, HIF1AN, CKMT1B (normal) |
 |  |
| PRAD (tumor) | PRAD (normal) |
| ASB9, CUL5, UBC, HSPA4, TCEB3, TCEB1, TCEB2, CKMT1A, CKB, HIF1AN, CKMT1B (tumor) | ASB9, CUL5, UBC, HSPA4, TCEB3, TCEB1, TCEB2, CKMT1A, CKB, HIF1AN, CKMT1B (normal) |
 |  |
| STAD (tumor) | STAD (normal) |
| ASB9, CUL5, UBC, HSPA4, TCEB3, TCEB1, TCEB2, CKMT1A, CKB, HIF1AN, CKMT1B (tumor) | ASB9, CUL5, UBC, HSPA4, TCEB3, TCEB1, TCEB2, CKMT1A, CKB, HIF1AN, CKMT1B (normal) |
 |  |
| THCA (tumor) | THCA (normal) |
| ASB9, CUL5, UBC, HSPA4, TCEB3, TCEB1, TCEB2, CKMT1A, CKB, HIF1AN, CKMT1B (tumor) | ASB9, CUL5, UBC, HSPA4, TCEB3, TCEB1, TCEB2, CKMT1A, CKB, HIF1AN, CKMT1B (normal) |
 |  |
| Top |
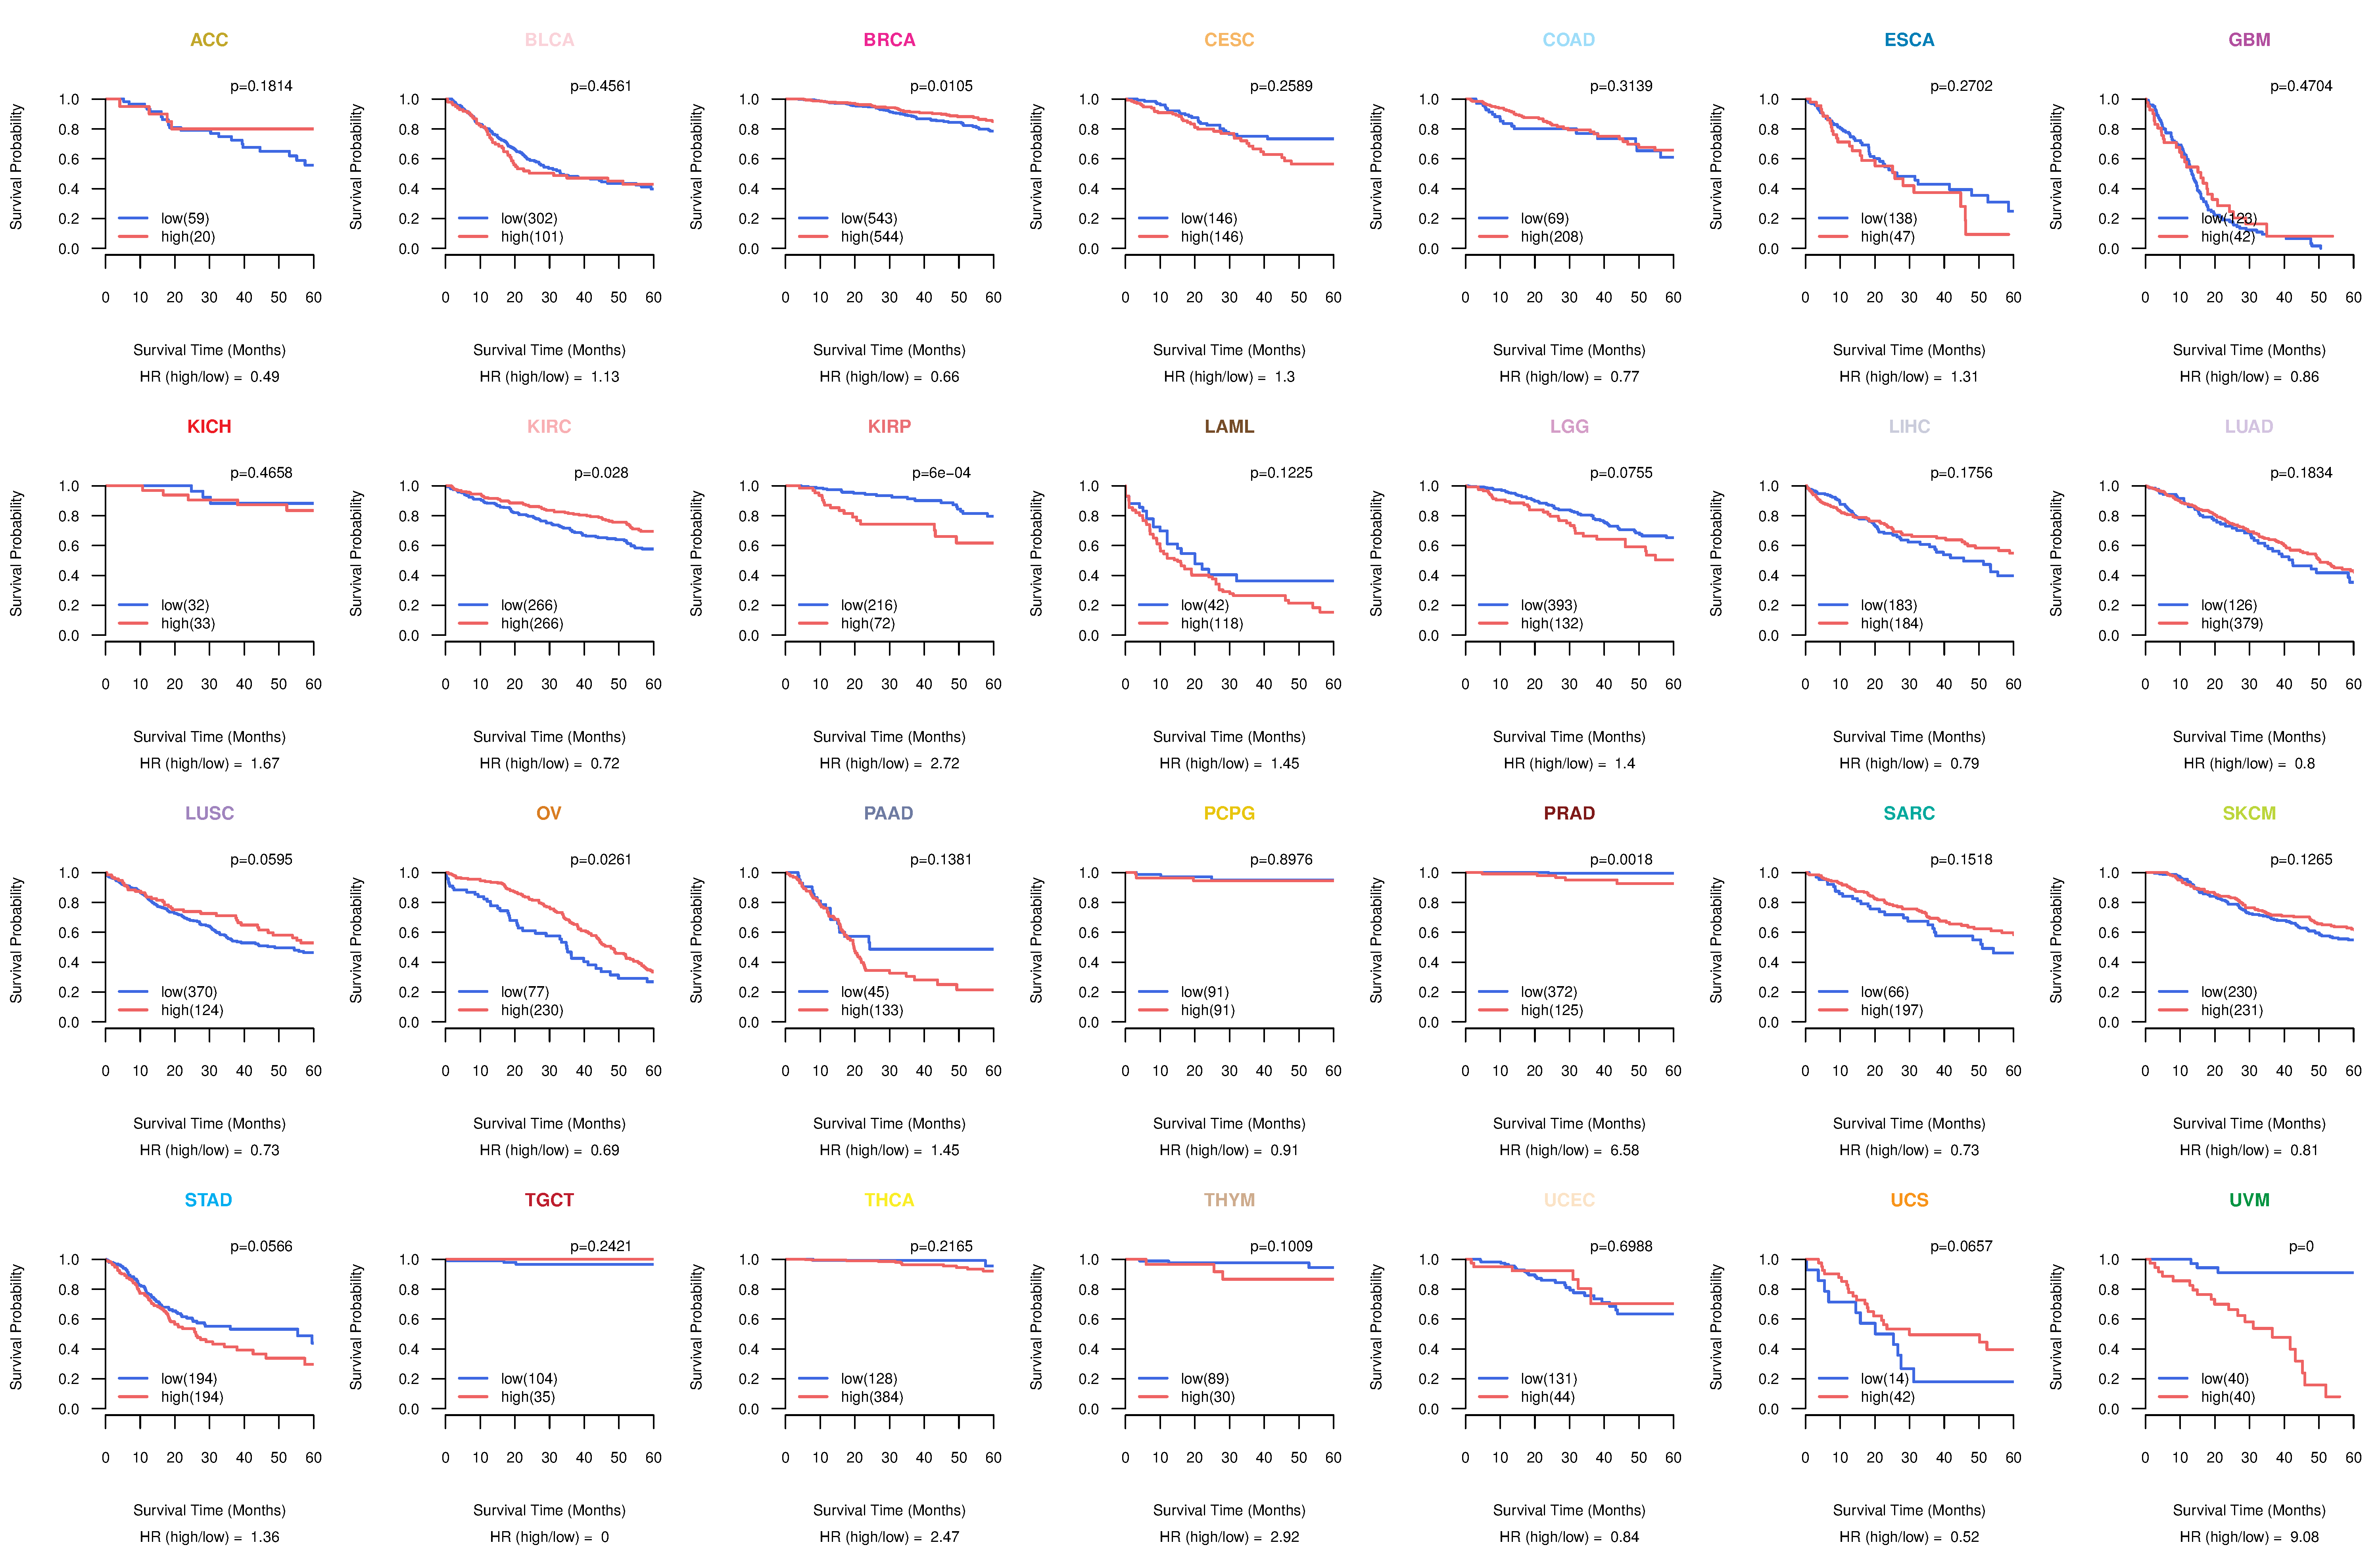
| TissGeneProg for ASB9 |
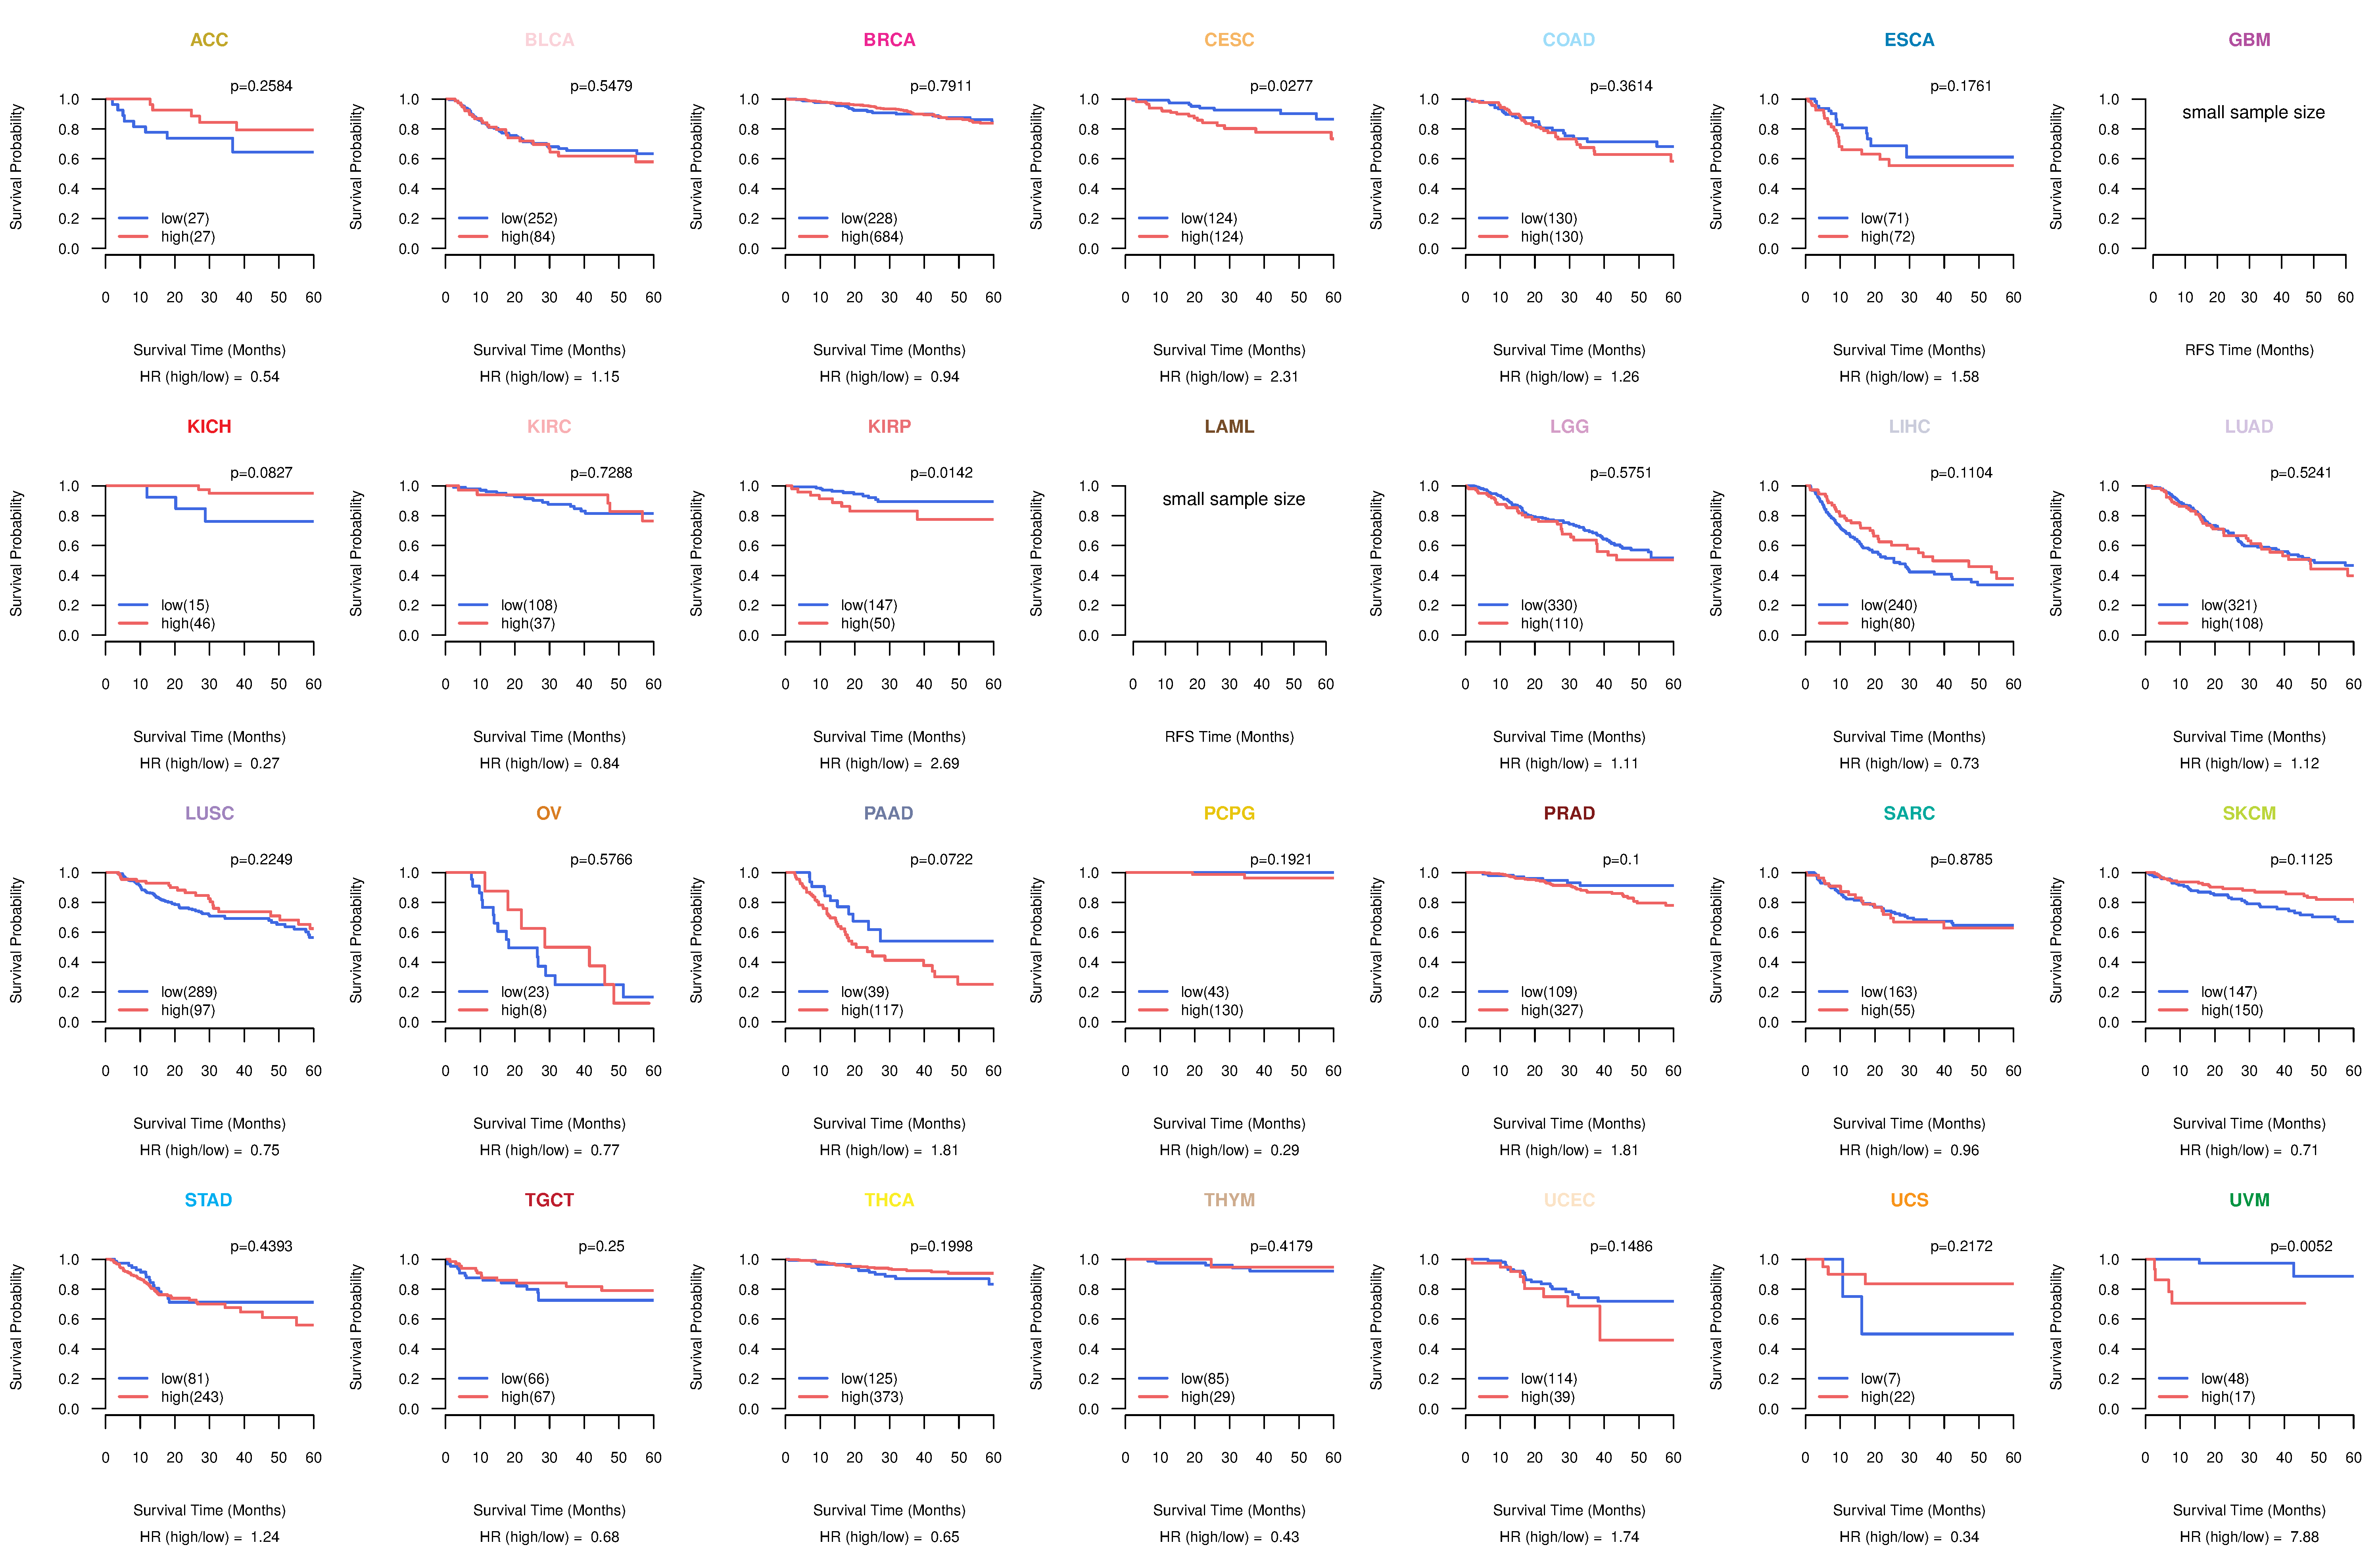
| Kaplan-Meier plots with logrank tests of overall survival (OS) using 28 cancer types (TCGA IlluminaHiSeq_RNASeqV2, pan-cancer normalized log2(norm_counts+1) data, version 2016-08-16) (TCGA clinicalMatrix, phenotype data, version 2016-04-27) * Click on the image to enlarge it in a new window. |
 |
| Kaplan-Meier plots with logrank test of relapse free survival (RFS) using 28 cancer types (TCGA IlluminaHiSeq_RNASeqV2, pan-cancer normalized log2(norm_counts+1) data, version 2016-08-16) (TCGA clinicalMatrix, phenotype data, version 2016-04-27) * Click on the image enlarge it in a new window. |
 |
| Forest plot of Cox proportional hazard ratio (HR) and 95% CI of overall survival (OS) using 28 cancer types (TCGA IlluminaHiSeq_RNASeqV2, pan-cancer normalized log2(norm_counts+1) data, version 2016-08-16) (TCGA clinicalMatrix, phenotype data, version 2016-04-27) * Click on the image enlarge it in a new window. |
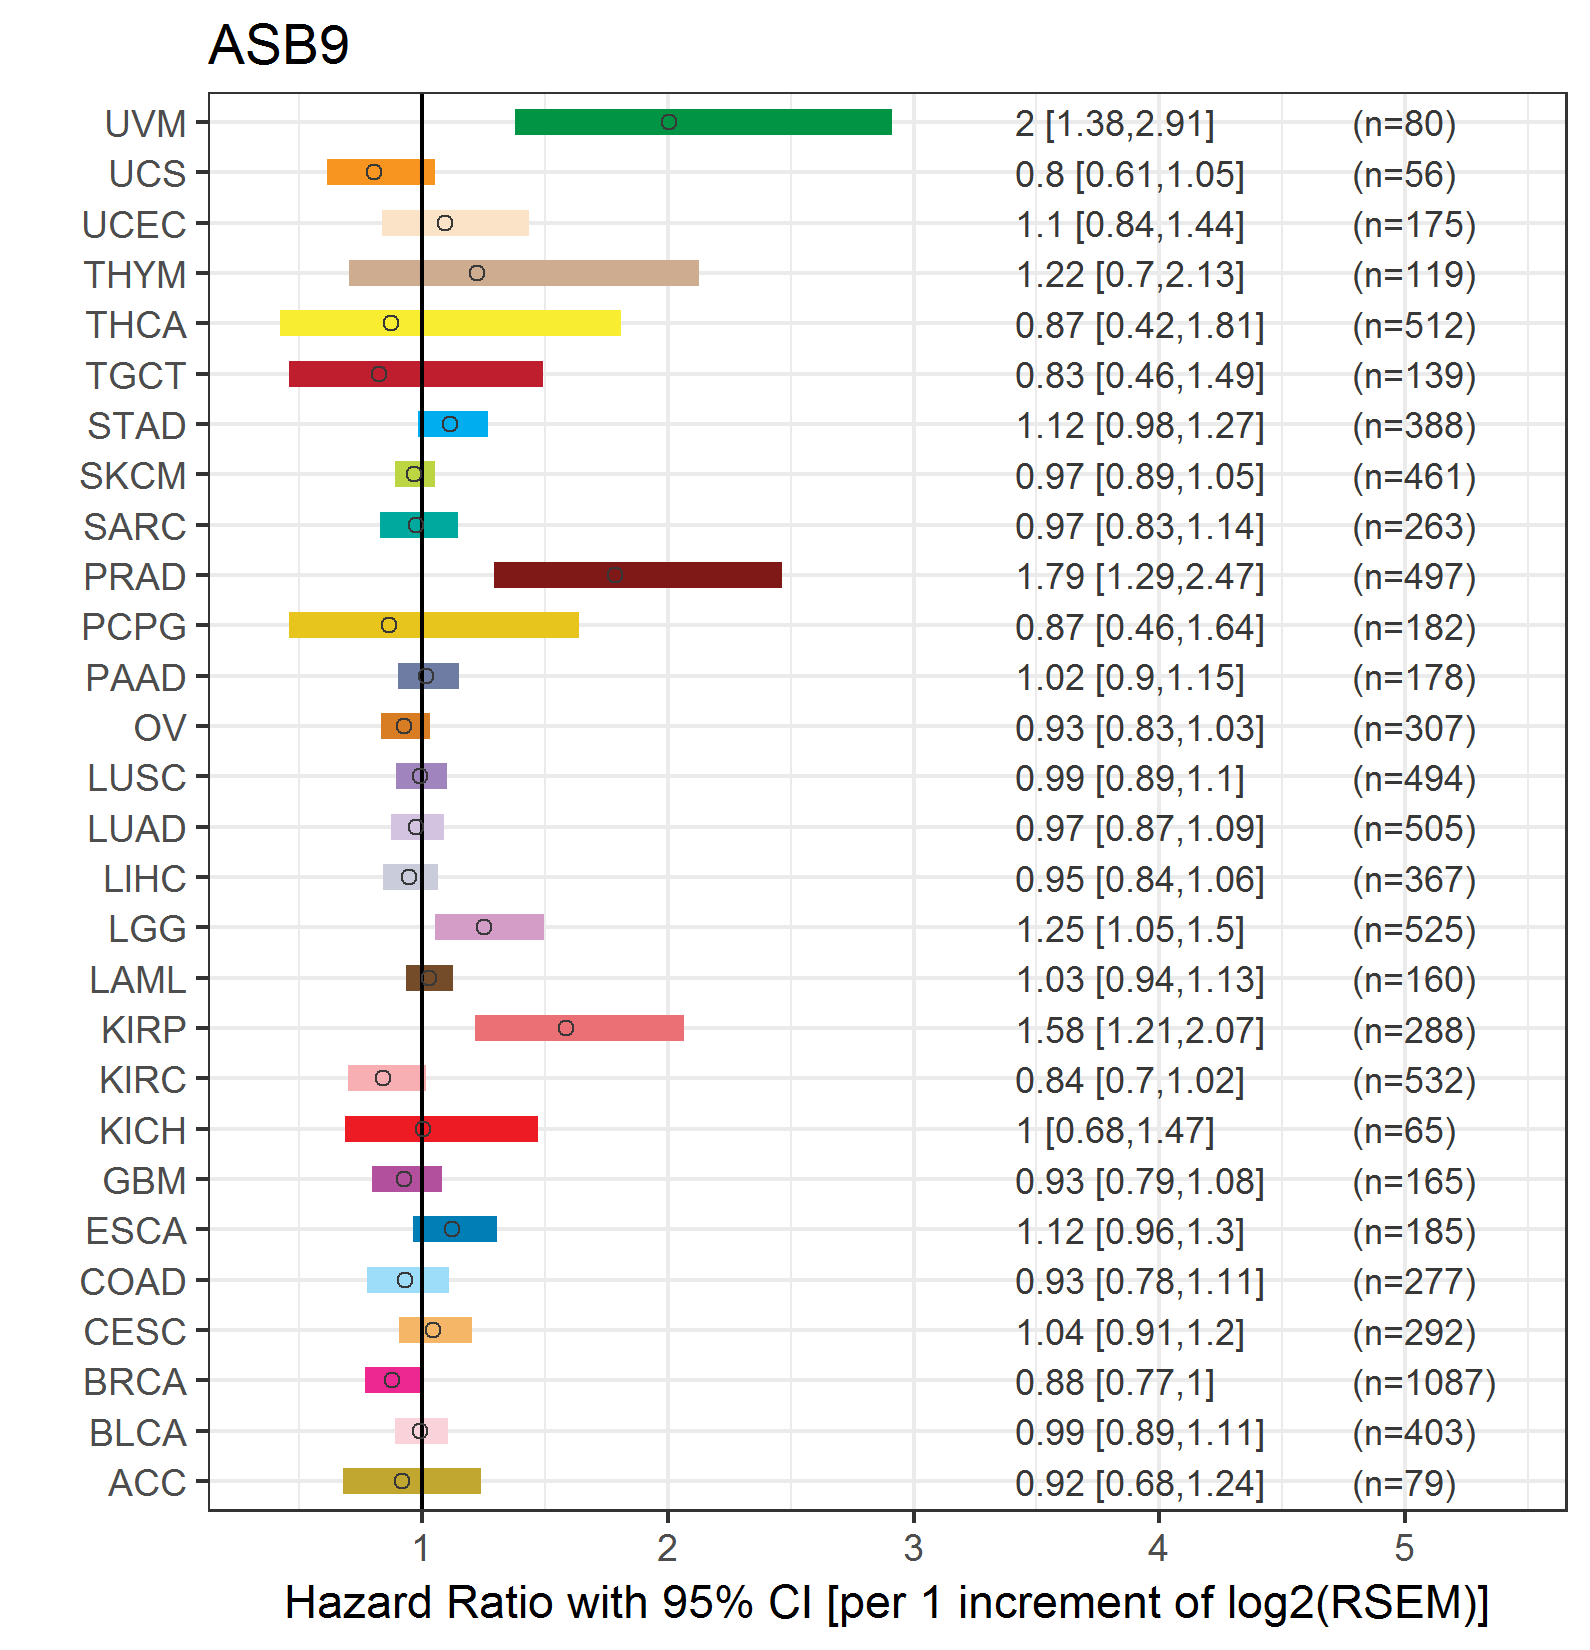 |
| Forest plot of Cox proportional hazard ratio (HR) and 95% CI of relapse free survival (RFS) using 28 cancer types (TCGA IlluminaHiSeq_RNASeqV2, pan-cancer normalized log2(norm_counts+1) data, version 2016-08-16) (TCGA clinicalMatrix, phenotype data, version 2016-04-27) * Click on the image enlarge it in a new window. |
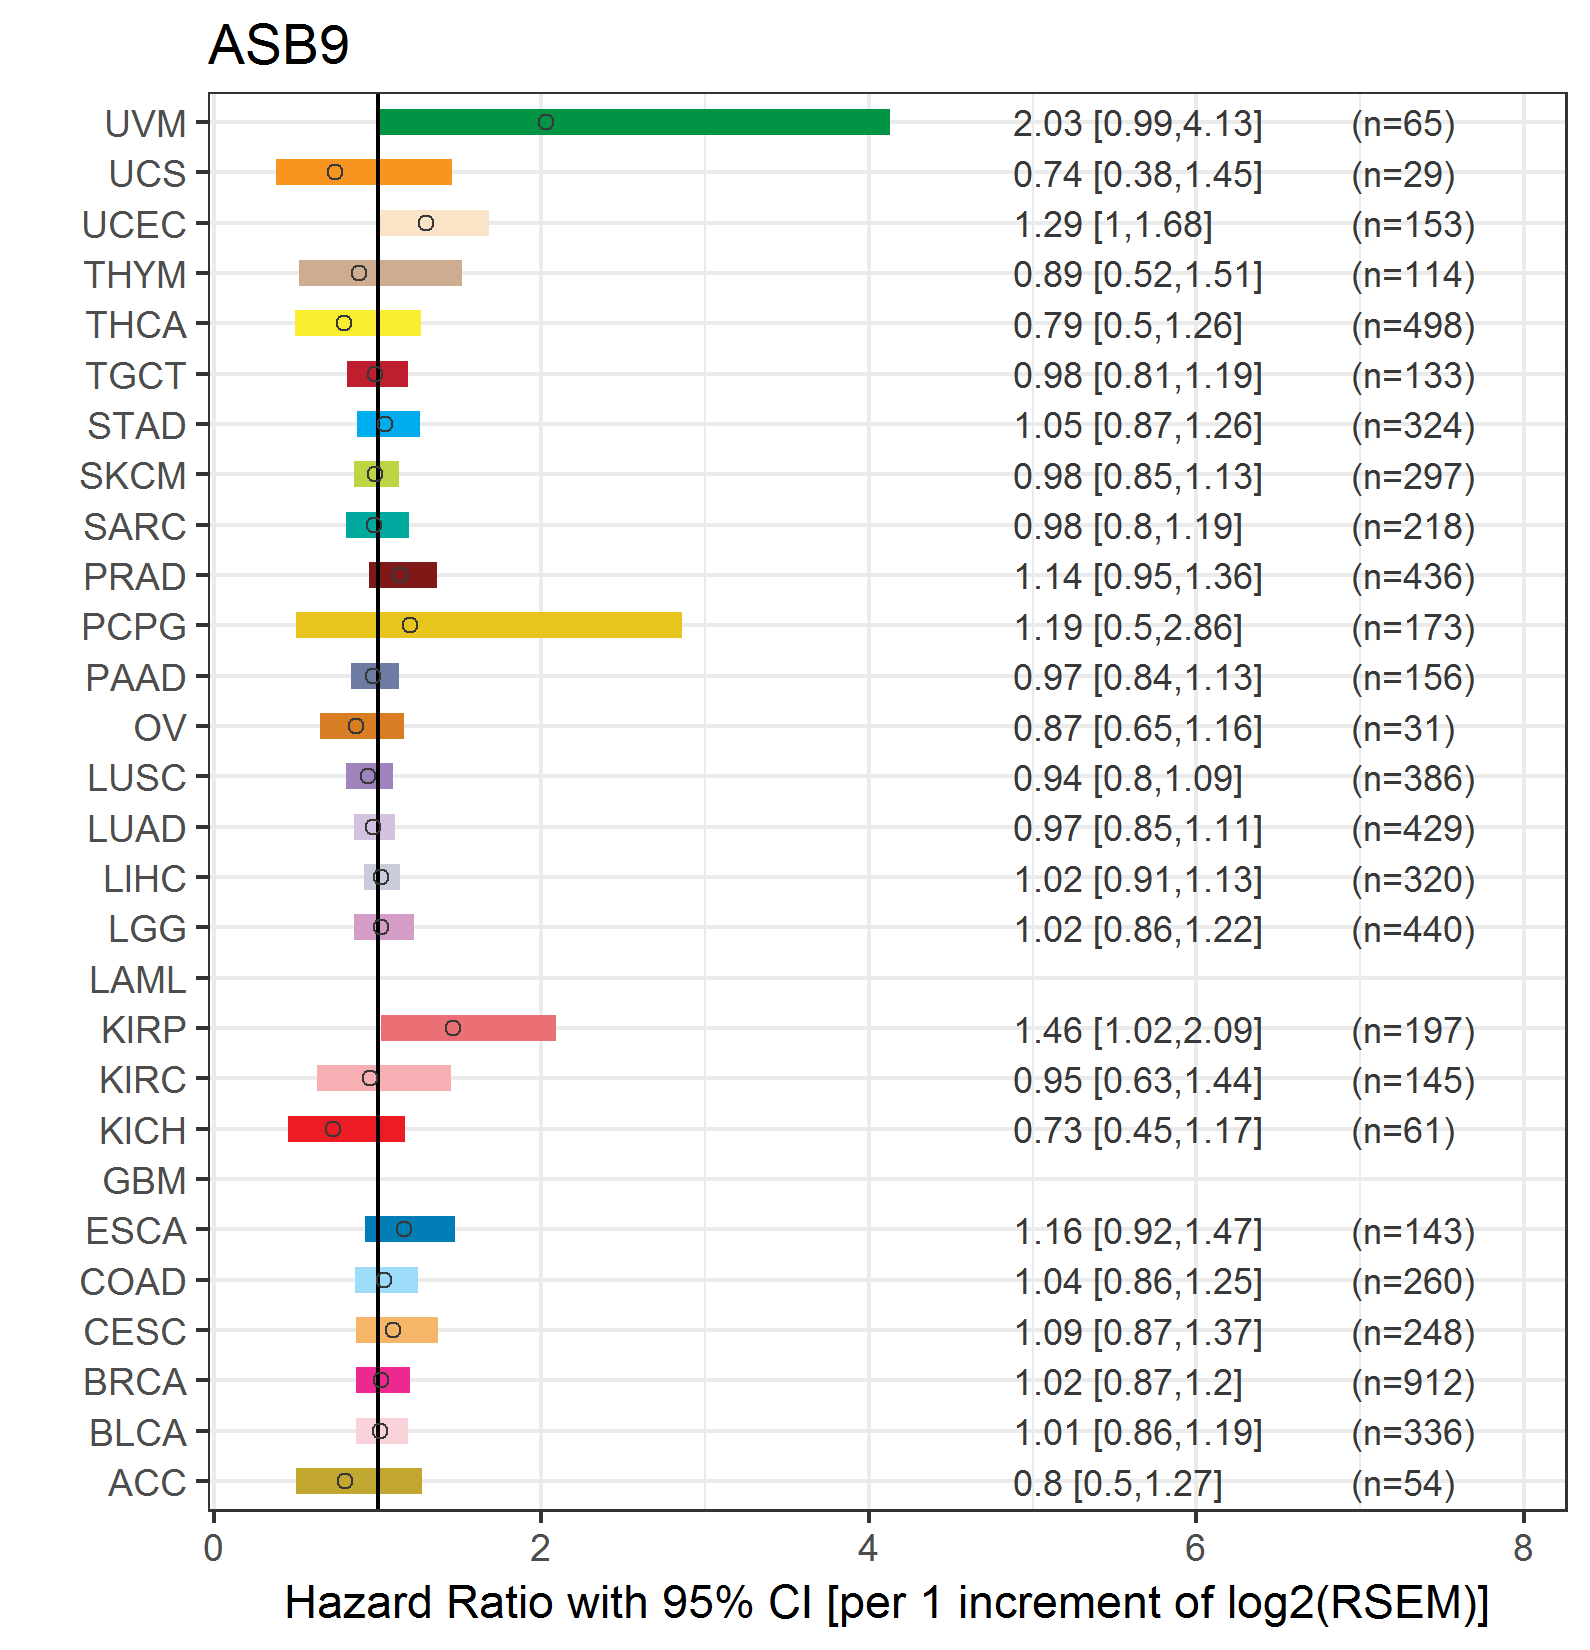 |
| Top |
| TissGeneClin for ASB9 |
| TissGeneDrug for ASB9 |
| Drug information targeting TissGene (DrugBank Version 5.0.6, 2017-04-01) |
| DrugBank ID | Drug name | Drug activity | Drug type | Drug status |
| Top |
| TissGeneDisease for ASB9 |
| Disease information associated with TissGene (DisGeNet, 2016-06-01) |
| Disease ID | Disease name | # pubmeds | Source |
|
Copyright 2016-Present - The University of Texas Health Science Center at Houston (UTHealth) Web File Viewing | How to Report, Fraud, Waste and Abuse | State of Texas | Statewide Search | Texas Homeland Security | Site Policies |