 |
| |
| |
| |
| |
| |
| |
|

| TissGeneSummary for STK35 |
 Gene summary Gene summary |
| Basic gene information | Gene symbol | STK35 |
| Gene name | serine/threonine kinase 35 | |
| Synonyms | CLIK1|STK35L1 | |
| Cytomap | UCSC genome browser: 20p13 | |
| Type of gene | protein-coding | |
| RefGenes | NM_080836.3, | |
| Description | CLIK-1CLP-36 interacting kinaseCLP-36-interacting kinase 1PDLIM1-interacting kinase 1serine threonine kinase 35 long formserine/threonine-protein kinase 35serine/threonine-protein kinase 35 L1 | |
| Modification date | 20141207 | |
| dbXrefs | MIM : 609370 | |
| HGNC : HGNC | ||
| Ensembl : ENSG00000125834 | ||
| HPRD : 11612 | ||
| Vega : OTTHUMG00000031688 | ||
| Protein | UniProt: go to UniProt's Cross Reference DB Table | |
| Expression | CleanEX: HS_STK35 | |
| BioGPS: 140901 | ||
| Pathway | NCI Pathway Interaction Database: STK35 | |
| KEGG: STK35 | ||
| REACTOME: STK35 | ||
| Pathway Commons: STK35 | ||
| Context | iHOP: STK35 | |
| ligand binding site mutation search in PubMed: STK35 | ||
| UCL Cancer Institute: STK35 | ||
| Assigned class in TissGDB* | C | |
| Included tissue-specific gene expression resources | TiGER,GTEx | |
| Specific-tissues in normal samples (assigned by TissGDB using HPA, TiGER, and GTEx) | TestisThymus | |
| Cancer types related to the specific-tissues in cancer samples (assigned by TissGDB using TCGA) | TGCTTHYM | |
| Reference showing the relevant tissue of STK35 | ||
| Description by TissGene annotations | Cancer gene Have significant anti-correlated miRNA TissgsLTS | |
| * Class A consists of genes with literature evidence and is part of the cTissGenes. Class B consists of only cTissGenes without additional evidence. The remaining genes belong to Class C. |
| Gene ontology having evidence of Inferred from Direct Assay (IDA) from Entrez |
| GO ID | GO term | PubMed ID |
| Top |
| TissGeneExp for STK35 |
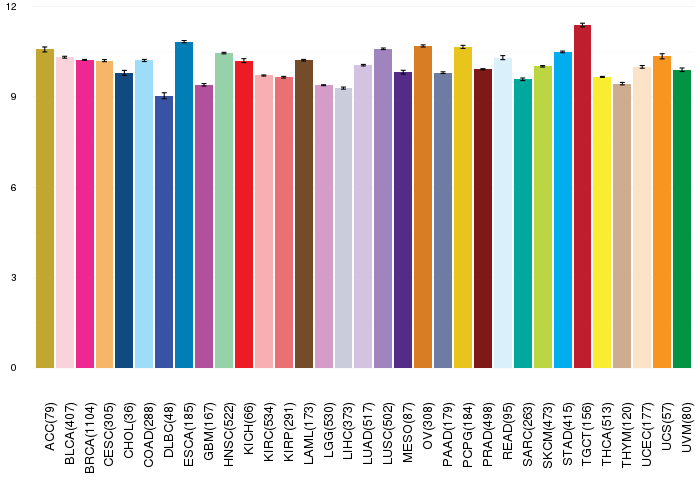
| Gene expressions across 28 cancer types (X-axis: cancer type and Y-axis: log2(norm_counts+1)) (TCGA IlluminaHiSeq_RNASeqV2, pan-cancer normalized log2(norm_counts+1) data, version 2016-08-16) |
 |
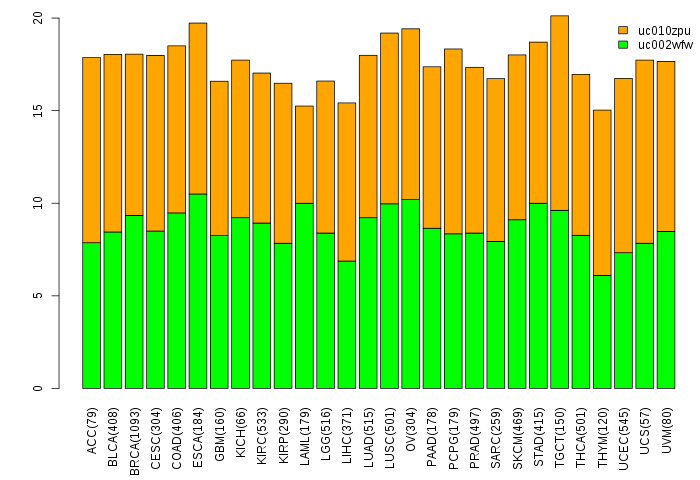
| Gene isoform expressions across 28 cancer types (X-axis: cancer type and Y-axis: log2(norm_counts+1)) (TCGA pan-cancer tcga_rsem_isoform_tpm, version 2016-09-01) |
 |
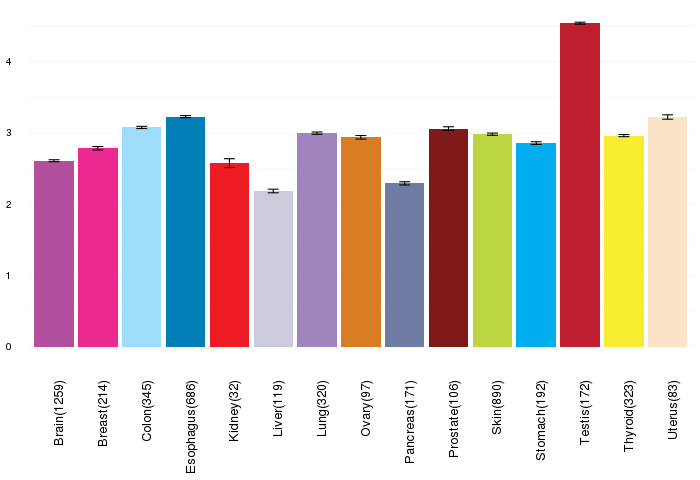
| Gene expressions across normal tissues of GTEx data (GTEx GTEx_Analysis_v6_RNA-seq_RNA-SeQCv1.1.8_gene_rpkm.gct) - Here, we shows the matched tissue types only among our 28 cancer types. |
 |
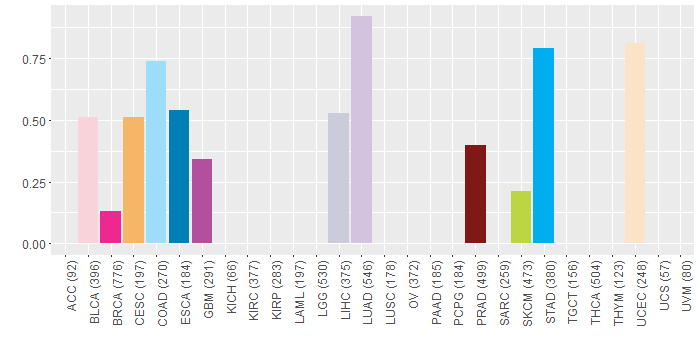
| Different expressions across 14 cancer types with more than 10 samples between matched tumors and normals (X-axis: cancer type and Y-axis: log2(norm_counts+1)) (TCGA IlluminaHiSeq_RNASeqV2, pan-cancer normalized log2(norm_counts+1) data, version 2016-08-16) |
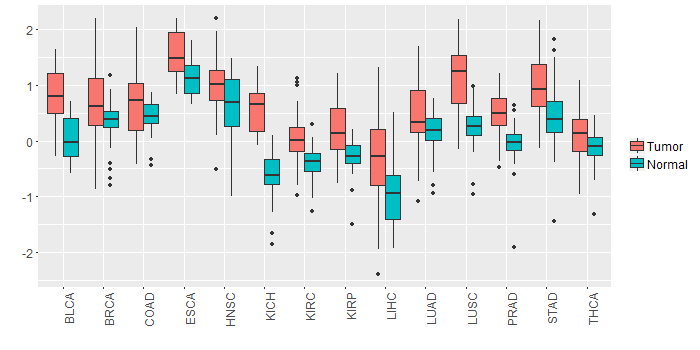 |
| - Significantly differentially expressed cancer types and information. (|Fold change|>1 and FDR<0.05) |
| Cancer type | Mean(exp) in tumor | Mean(exp) in matched normal | Log2FC | P-val. | FDR |
| KICH | 0.590398552 | -0.651017448 | 1.241416 | 5.59E-13 | 6.92E-12 |
| Top |
| TissGene-miRNA for STK35 |
| Significantly anti-correlated miRNAs of TissGene across 28 cancer types (Gene-miRNA relations from TargetScanHuman Relsease 7.1, Conserved_Site_Context_Scores.txt.zip, 06.01.2016) (TCGA IlluminaHiSeq_miRNASeq, log2(RPM+1) data, version 2016-11-21) (TCGA IlluminaHiSeq_RNASeqV2, log2(normalized_count+1) data, version 2016-08-16) (Spearman’s Rank Correlation (p-value<0.05 and coefficient<-0.25)) |
| Cancer type | miRNA id | miRNA accession | P-val. | Coeff. | # samples |
| UCS | hsa-miR-486-5p | MIMAT0002177 | 0.032 | -0.29 | 56 |
| ACC | hsa-miR-1271-5p | MIMAT0005796 | 0.011 | -0.3 | 78 |
| ACC | hsa-miR-1271-5p | MIMAT0005796 | 0.011 | -0.3 | 78 |
| UVM | hsa-miR-96-5p | MIMAT0000095 | 0.0097 | -0.3 | 80 |
| Top |
| TissGeneMut for STK35 |
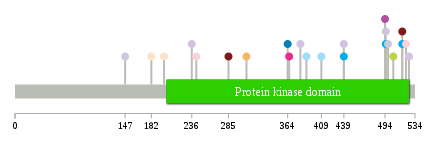
| TissGeneSNV for STK35 |
| nsSNV counts per each loci. Different colors of circles represent different cancer types. Circle size denotes number of samples. (TCGA somatic mutation (SNPs and small INDELs) data, version 2016-04-25) * Click on the image to enlarge it in a new window. |
 |
 |
| Somatic nucleotide variants of TissGene across 28 cancer types (X-axis: cancer type and Y-axis: % of mutated samples) The numbers in parentheses are numbers of samples with mutation (nsSNVs). (TCGA somatic mutation (SNPs and small INDELs) data, version 2016-04-25) |
 |
| - nsSNVs sorted by frequency. |
| AAchange | Cancer type | # samples |
| p.P199L | UCEC | 1 |
| p.D381Y | LUAD | 1 |
| p.M182V | UCEC | 1 |
| p.E522Q | BLCA | 1 |
| p.L505F | SKCM | 1 |
| p.A389T | COAD | 1 |
| p.A439S | LUAD | 1 |
| p.R517W | PRAD | 1 |
| p.D236N | LUAD | 1 |
| p.A439V | STAD | 1 |
| p.S147R | LIHC | 1 |
| p.E242K | BLCA | 1 |
| p.S366A | BRCA | 1 |
| p.G390V | HNSC | 1 |
| p.R526K | HNSC | 1 |
| p.R517Q | STAD | 1 |
| p.R495K | STAD | 1 |
| p.K409E | COAD | 1 |
| p.G281D | MESO | 1 |
| p.M498V | LIHC | 1 |
| p.R526* | LUAD | 1 |
| p.C309Y | CESC | 1 |
| p.R495S | LUAD | 1 |
| p.S285L | PRAD | 1 |
| p.D364H | ESCA | 1 |
| p.R494C | GBM | 1 |
| Top |
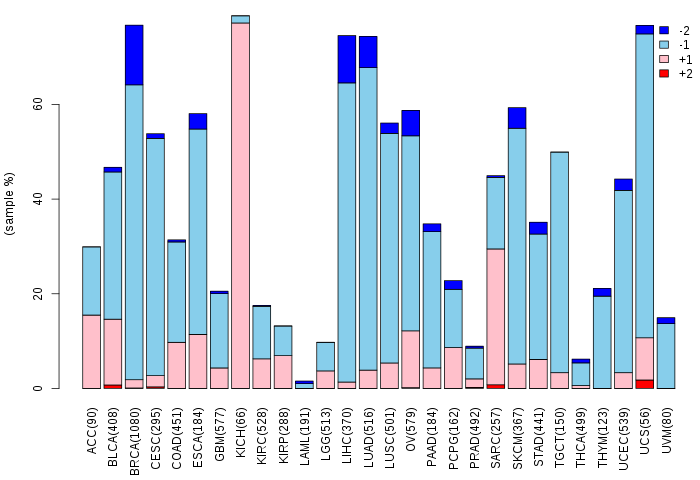
| TissGeneCNV for STK35 |
| Copy number variations of TissGene across 28 cancer types (X-axis: cancer type and Y-axis: % of CNV samples) (TCGA Gistic2_CopyNumber_Gistic2_all_data_by_genes, Gistic2 copy number data, version 2016-08-16) |
 |
| Top |
| TissGeneFusions for STK35 |
| Fusion genes including TissGene (ChimerDB 3.0, 2016-12-01 and TCGA fusion Portal 2015-12-01) |
| Database | Src | Cancer type | Sample | Fusion gene | ORF | 5'-gene BP | 3'-gene BP |
| Chimerdb3.0 | TopHat-Fusion | BRCA | TCGA-A2-A1FW-01A | STK35-SRGAP2 | 3'UTR-CDS | chr20:2128570 | chr1:206571885 |
| Chimerdb3.0 | TopHat-Fusion | BRCA | TCGA-A2-A1FW-01A | SRGAP2-AS1-STK35 | Out-of-Frame | chr1:121121667 | chr20:2128570 |
| TCGAfusionPortal | PRADA | BRCA | TCGA-EW-A1PF-01A | STK35-CHD6 | Out-of-frame | Chr20:2084011 | Chr20:40113247 |
| Top |
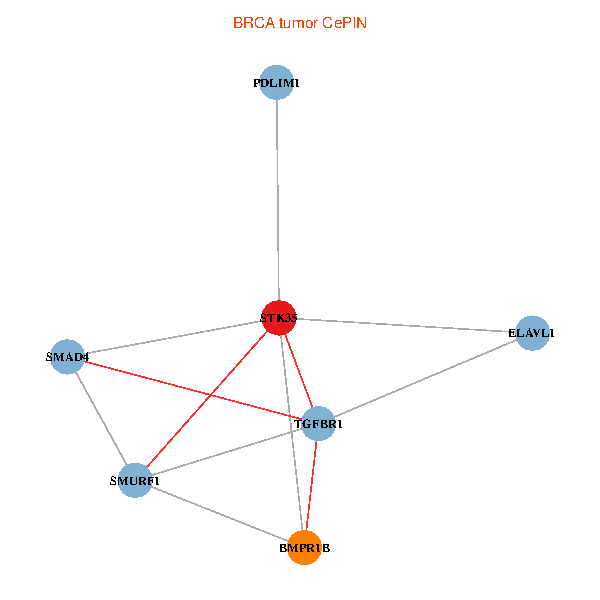
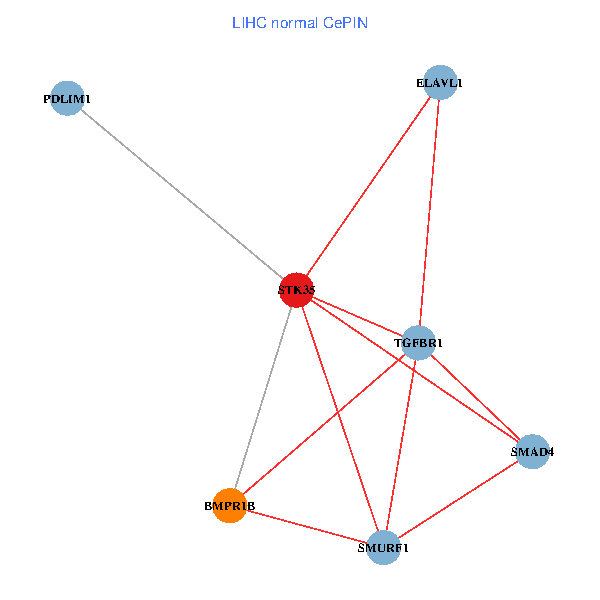
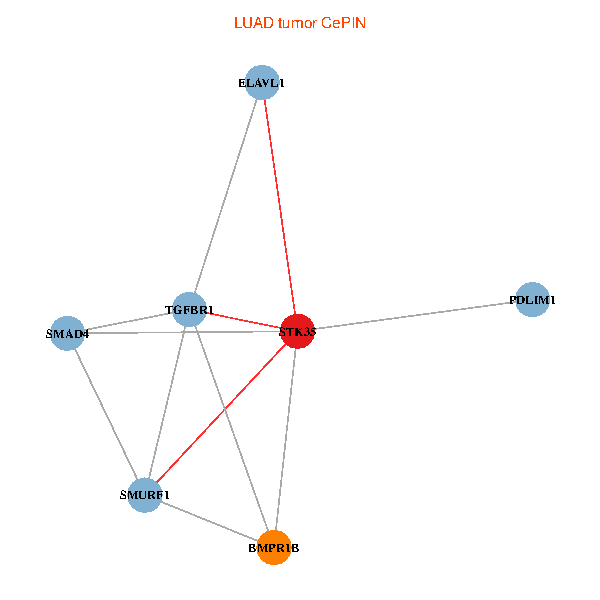
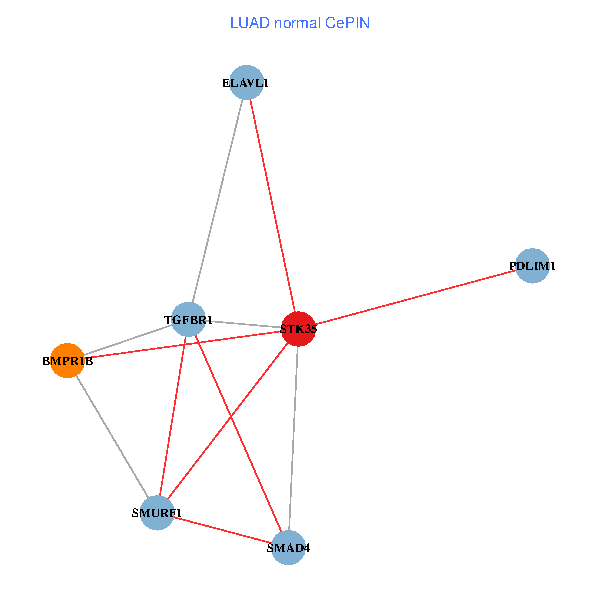
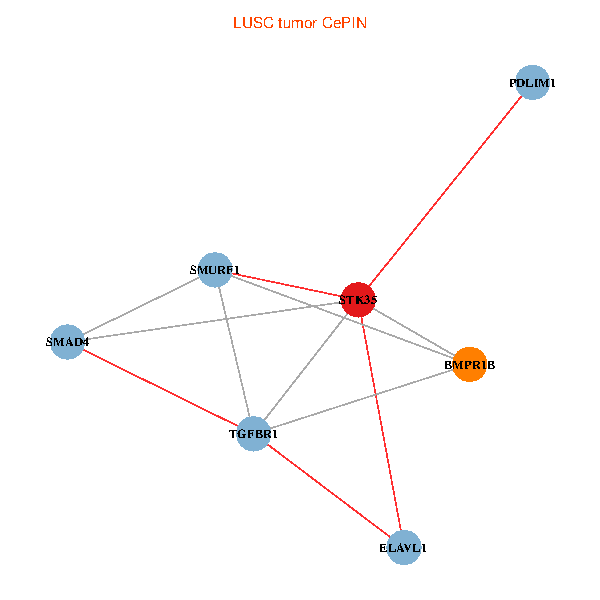
| TissGeneNet for STK35 |
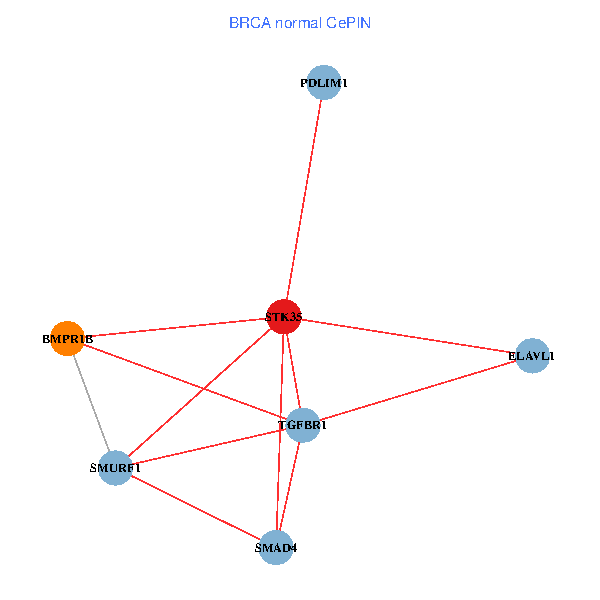
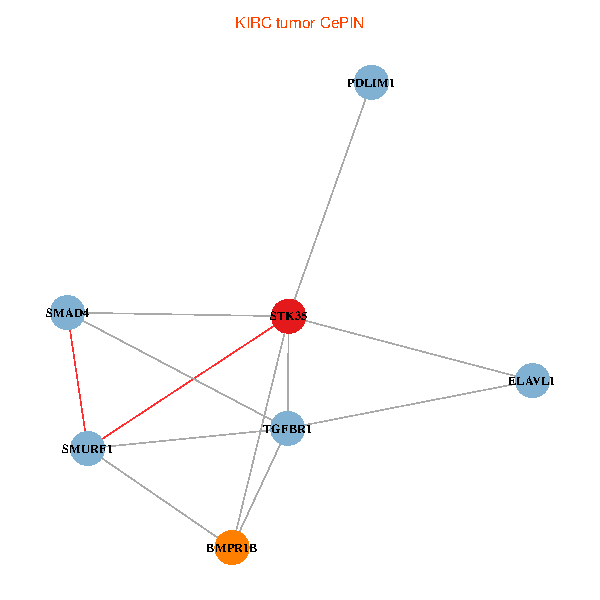
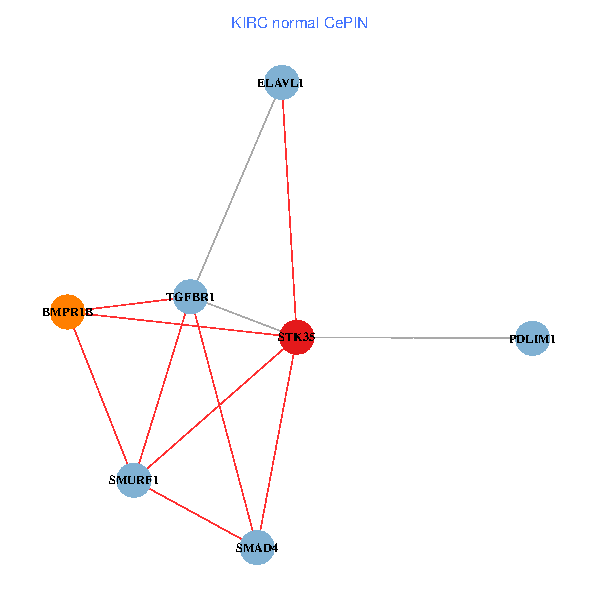
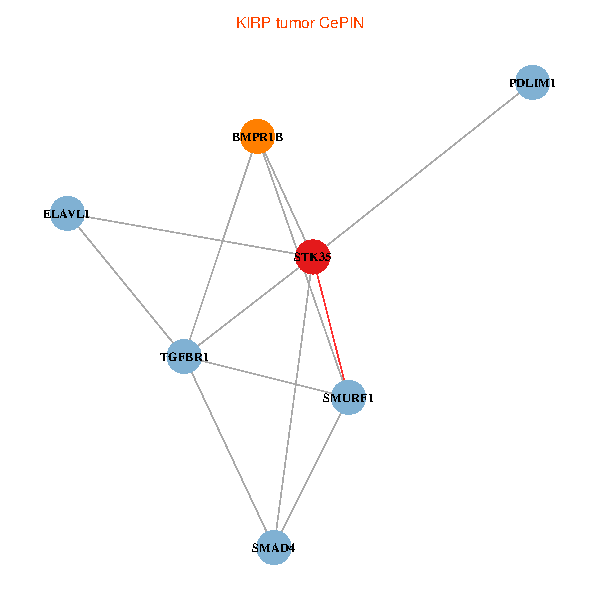
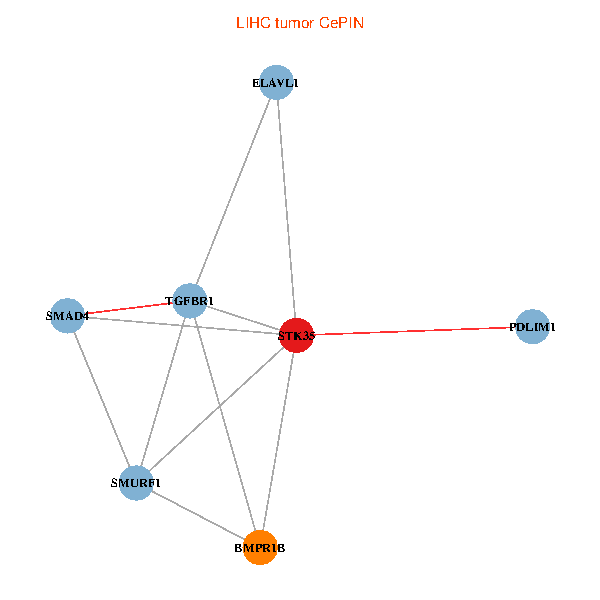
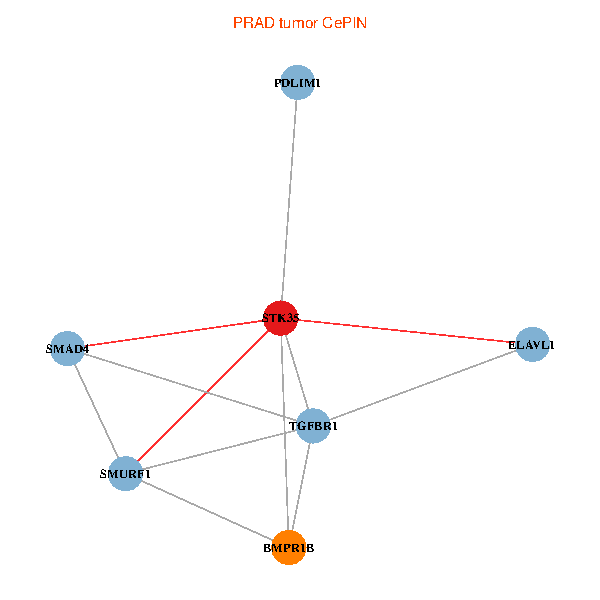
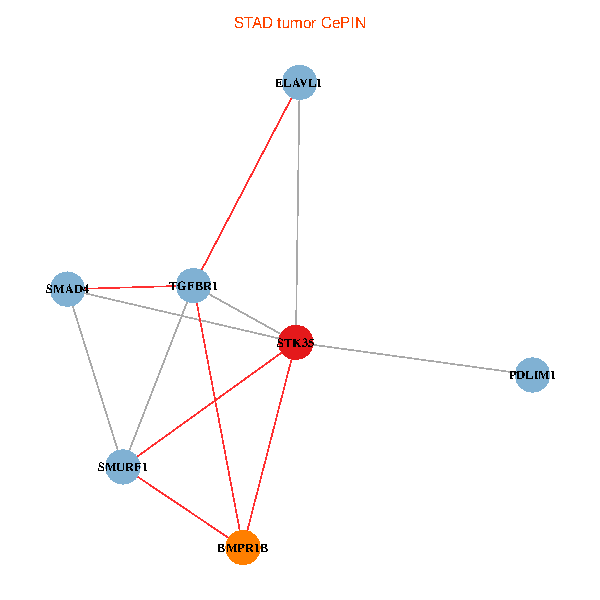
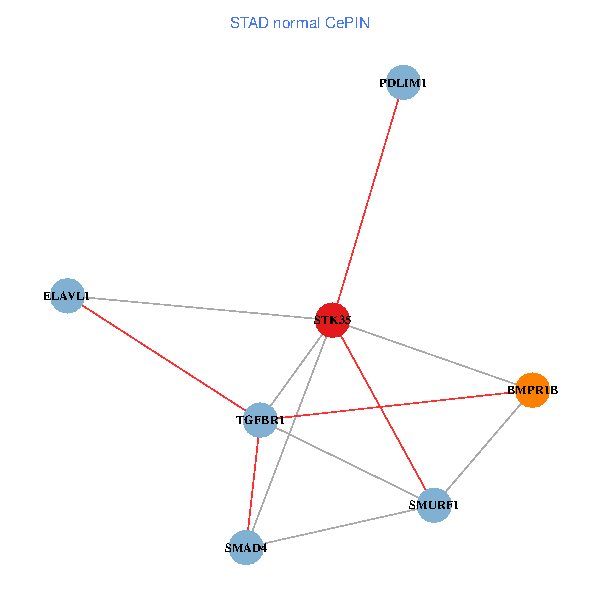
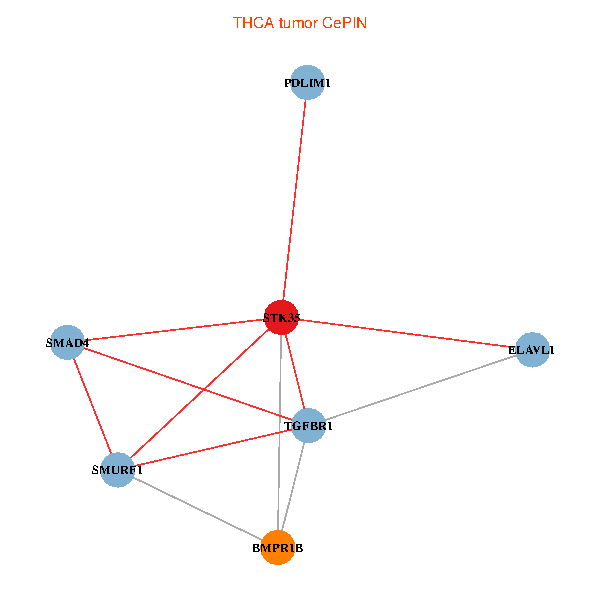
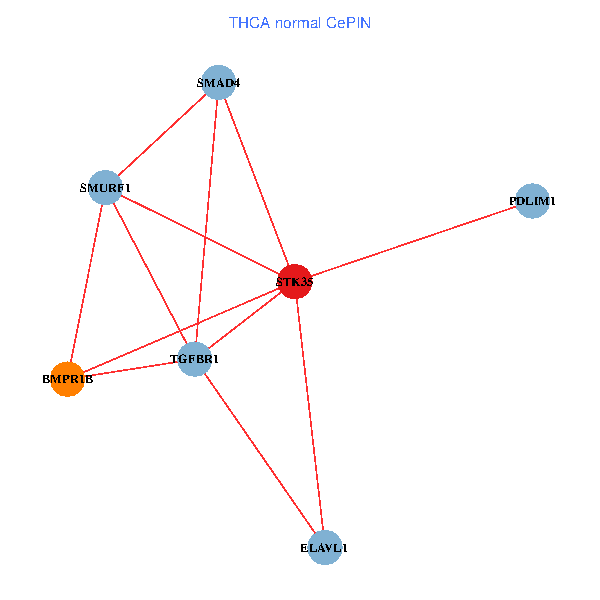
| Co-expressed gene networks based on protein-protein interaction data (CePIN) (TCGA IlluminaHiSeq_RNASeqV2, pan-cancer normalized log2(norm_counts+1) data, version 2016-08-16) (PINA2 ppi data) |
| BRCA (tumor) | BRCA (normal) |
| STK35, ELAVL1, TGFBR1, BMPR1B, SMAD4, SMURF1, PDLIM1 (tumor) | STK35, ELAVL1, TGFBR1, BMPR1B, SMAD4, SMURF1, PDLIM1 (normal) |
 |  |
| COAD (tumor) | COAD (normal) |
| STK35, ELAVL1, TGFBR1, BMPR1B, SMAD4, SMURF1, PDLIM1 (tumor) | STK35, ELAVL1, TGFBR1, BMPR1B, SMAD4, SMURF1, PDLIM1 (normal) |
 |  |
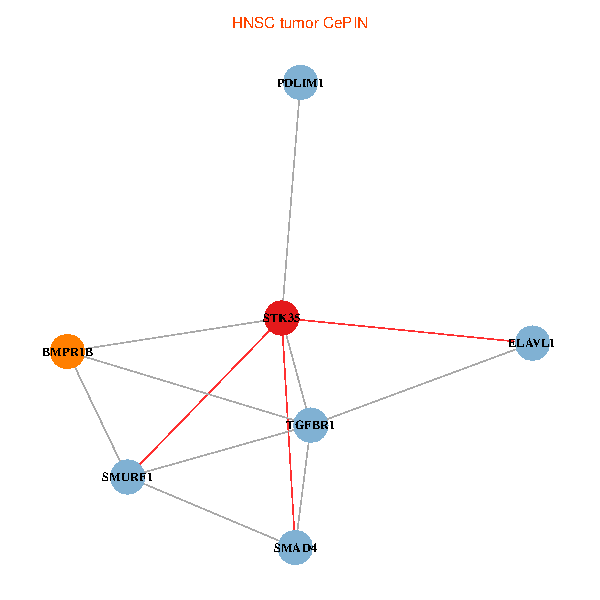
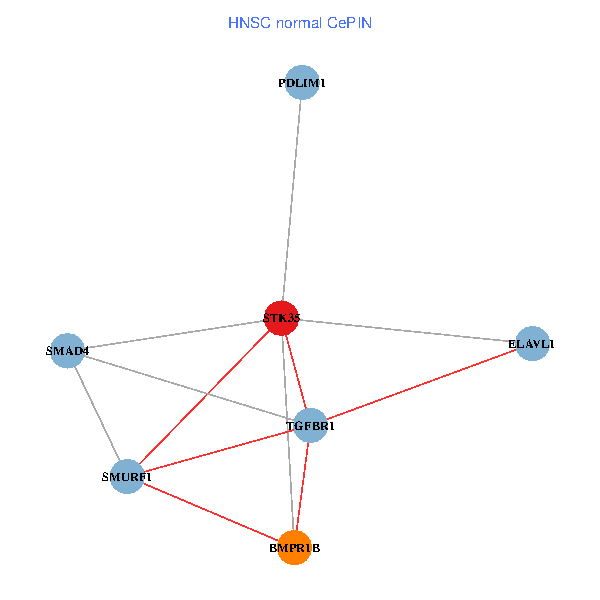
| HNSC (tumor) | HNSC (normal) |
| STK35, ELAVL1, TGFBR1, BMPR1B, SMAD4, SMURF1, PDLIM1 (tumor) | STK35, ELAVL1, TGFBR1, BMPR1B, SMAD4, SMURF1, PDLIM1 (normal) |
 |  |
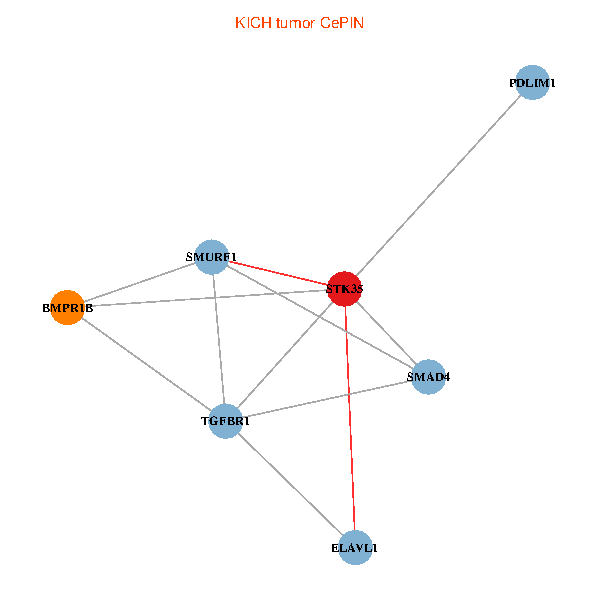
| KICH (tumor) | KICH (normal) |
| STK35, ELAVL1, TGFBR1, BMPR1B, SMAD4, SMURF1, PDLIM1 (tumor) | STK35, ELAVL1, TGFBR1, BMPR1B, SMAD4, SMURF1, PDLIM1 (normal) |
 |  |
| KIRC (tumor) | KIRC (normal) |
| STK35, ELAVL1, TGFBR1, BMPR1B, SMAD4, SMURF1, PDLIM1 (tumor) | STK35, ELAVL1, TGFBR1, BMPR1B, SMAD4, SMURF1, PDLIM1 (normal) |
 |  |
| KIRP (tumor) | KIRP (normal) |
| STK35, ELAVL1, TGFBR1, BMPR1B, SMAD4, SMURF1, PDLIM1 (tumor) | STK35, ELAVL1, TGFBR1, BMPR1B, SMAD4, SMURF1, PDLIM1 (normal) |
 |  |
| LIHC (tumor) | LIHC (normal) |
| STK35, ELAVL1, TGFBR1, BMPR1B, SMAD4, SMURF1, PDLIM1 (tumor) | STK35, ELAVL1, TGFBR1, BMPR1B, SMAD4, SMURF1, PDLIM1 (normal) |
 |  |
| LUAD (tumor) | LUAD (normal) |
| STK35, ELAVL1, TGFBR1, BMPR1B, SMAD4, SMURF1, PDLIM1 (tumor) | STK35, ELAVL1, TGFBR1, BMPR1B, SMAD4, SMURF1, PDLIM1 (normal) |
 |  |
| LUSC (tumor) | LUSC (normal) |
| STK35, ELAVL1, TGFBR1, BMPR1B, SMAD4, SMURF1, PDLIM1 (tumor) | STK35, ELAVL1, TGFBR1, BMPR1B, SMAD4, SMURF1, PDLIM1 (normal) |
 |  |
| PRAD (tumor) | PRAD (normal) |
| STK35, ELAVL1, TGFBR1, BMPR1B, SMAD4, SMURF1, PDLIM1 (tumor) | STK35, ELAVL1, TGFBR1, BMPR1B, SMAD4, SMURF1, PDLIM1 (normal) |
 |  |
| STAD (tumor) | STAD (normal) |
| STK35, ELAVL1, TGFBR1, BMPR1B, SMAD4, SMURF1, PDLIM1 (tumor) | STK35, ELAVL1, TGFBR1, BMPR1B, SMAD4, SMURF1, PDLIM1 (normal) |
 |  |
| THCA (tumor) | THCA (normal) |
| STK35, ELAVL1, TGFBR1, BMPR1B, SMAD4, SMURF1, PDLIM1 (tumor) | STK35, ELAVL1, TGFBR1, BMPR1B, SMAD4, SMURF1, PDLIM1 (normal) |
 |  |
| Top |
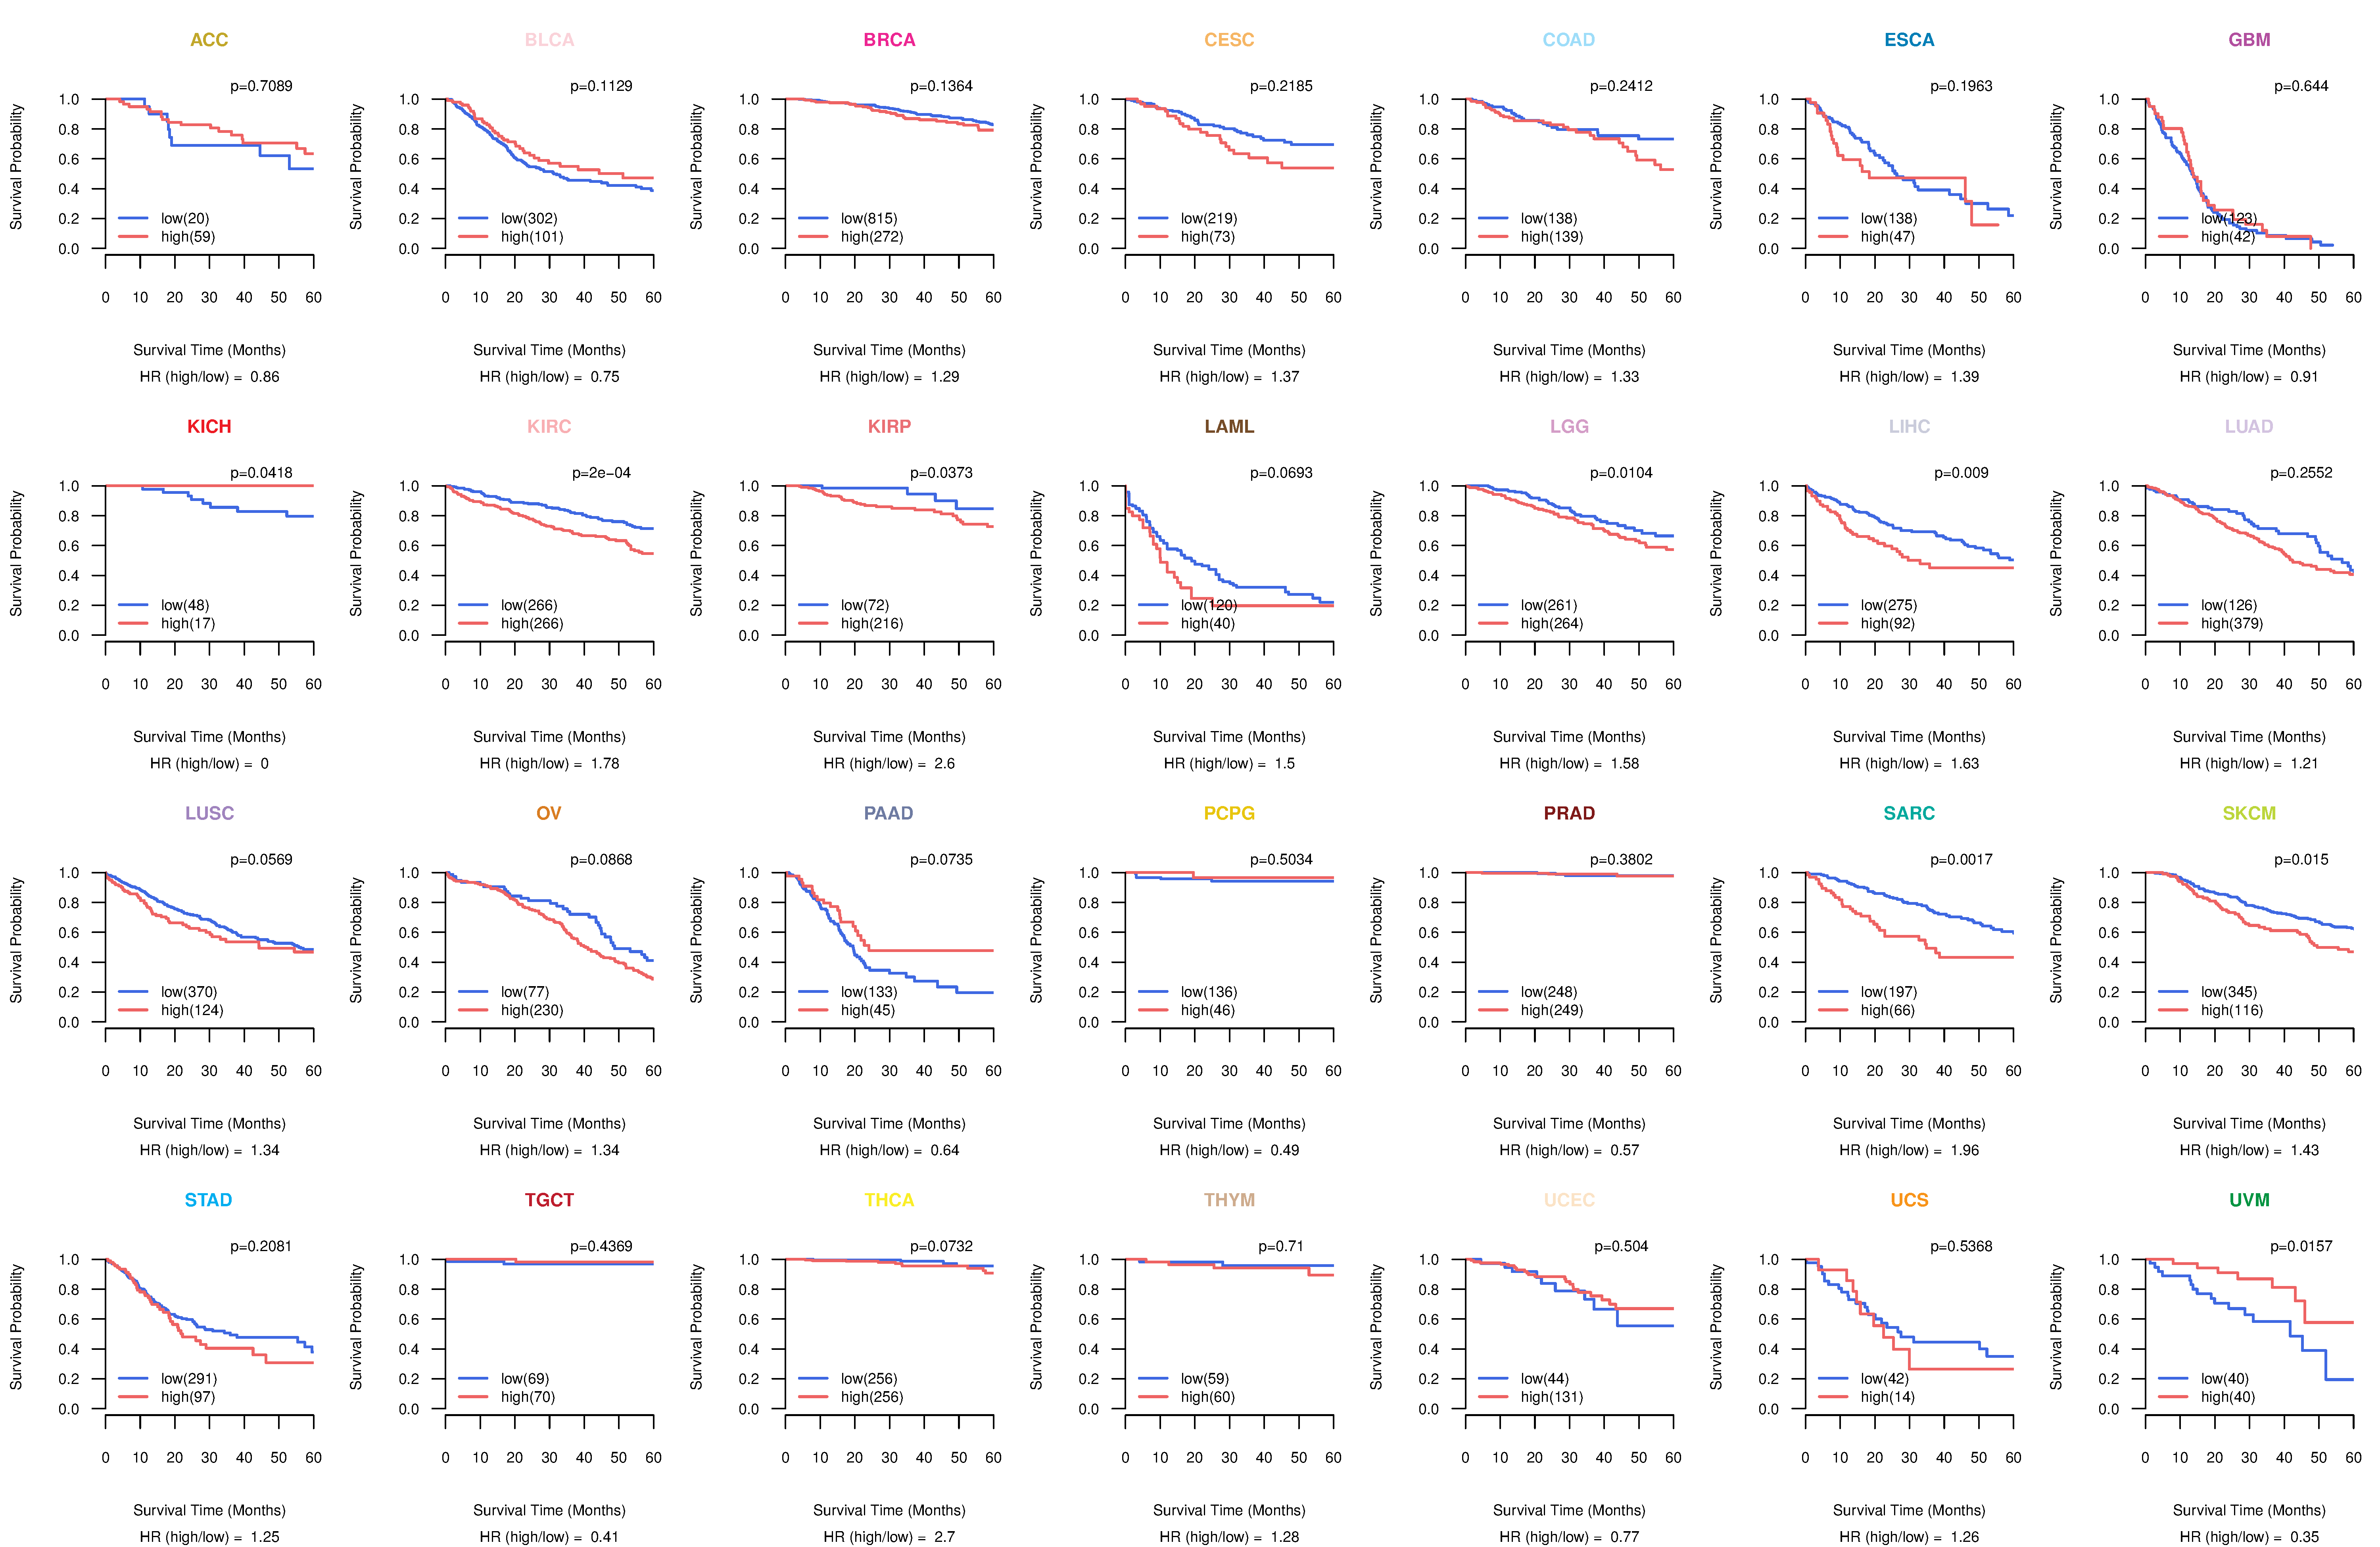
| TissGeneProg for STK35 |
| Kaplan-Meier plots with logrank tests of overall survival (OS) using 28 cancer types (TCGA IlluminaHiSeq_RNASeqV2, pan-cancer normalized log2(norm_counts+1) data, version 2016-08-16) (TCGA clinicalMatrix, phenotype data, version 2016-04-27) * Click on the image to enlarge it in a new window. |
 |
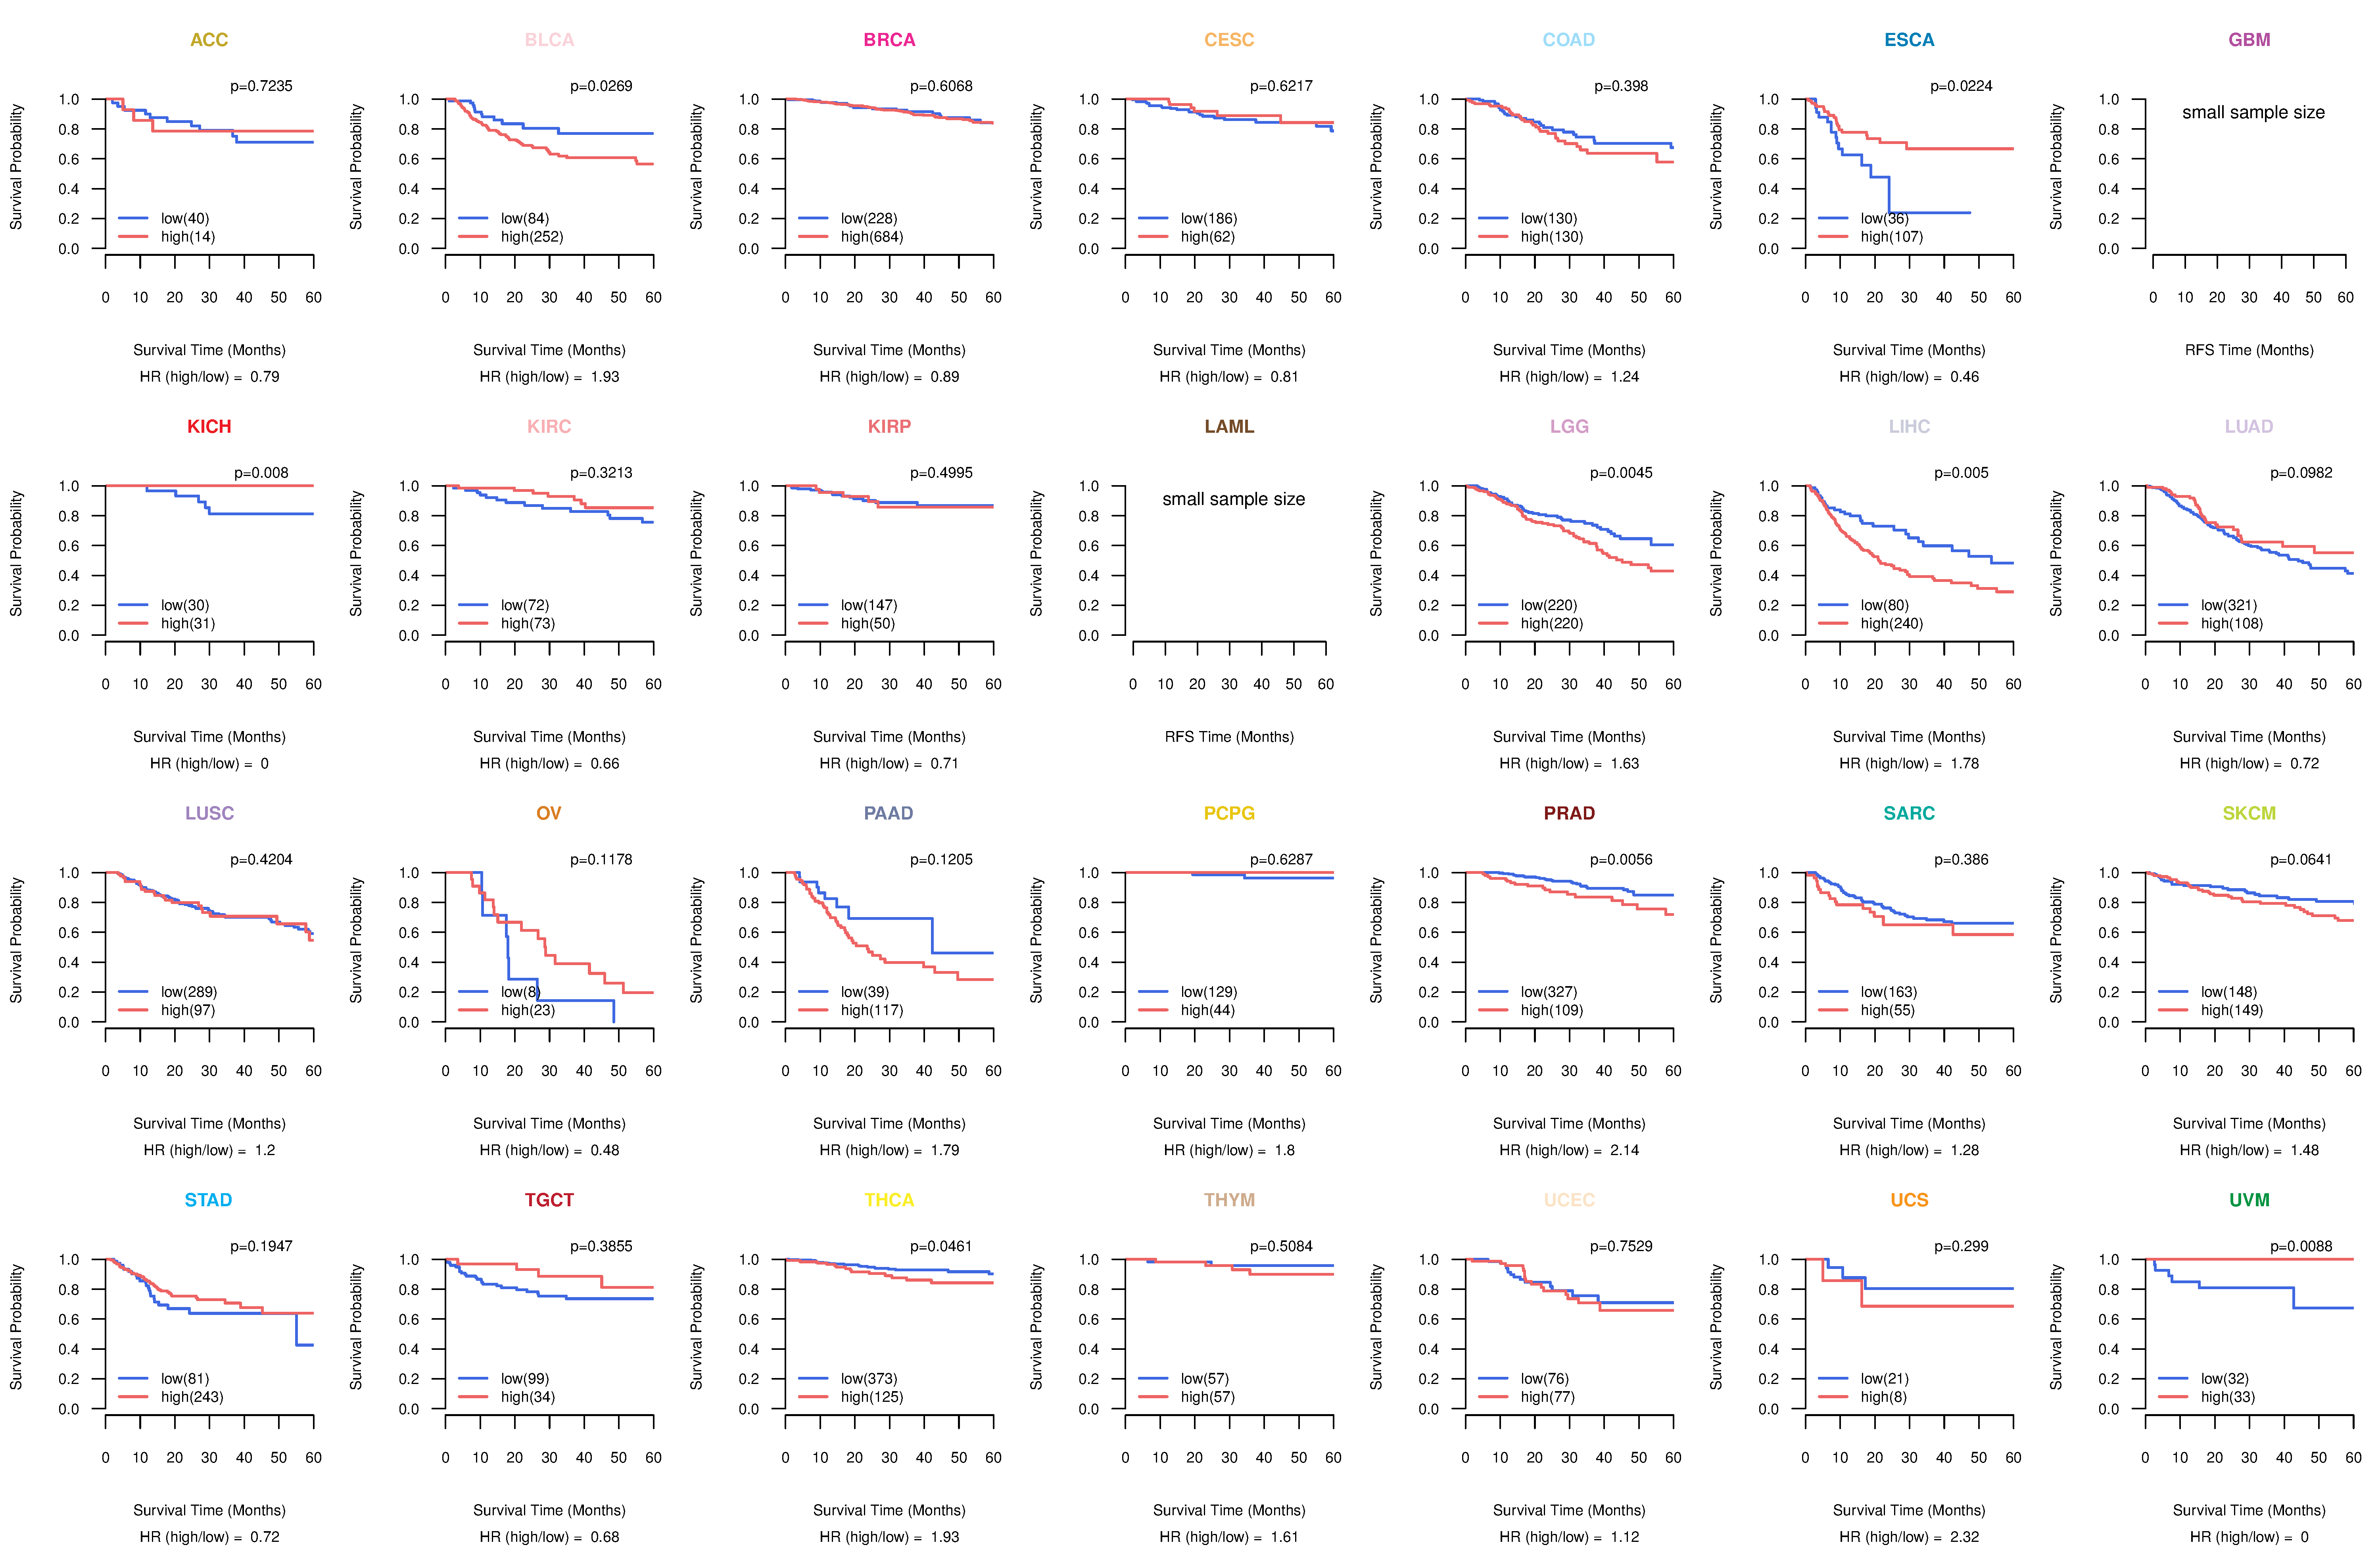
| Kaplan-Meier plots with logrank test of relapse free survival (RFS) using 28 cancer types (TCGA IlluminaHiSeq_RNASeqV2, pan-cancer normalized log2(norm_counts+1) data, version 2016-08-16) (TCGA clinicalMatrix, phenotype data, version 2016-04-27) * Click on the image enlarge it in a new window. |
 |
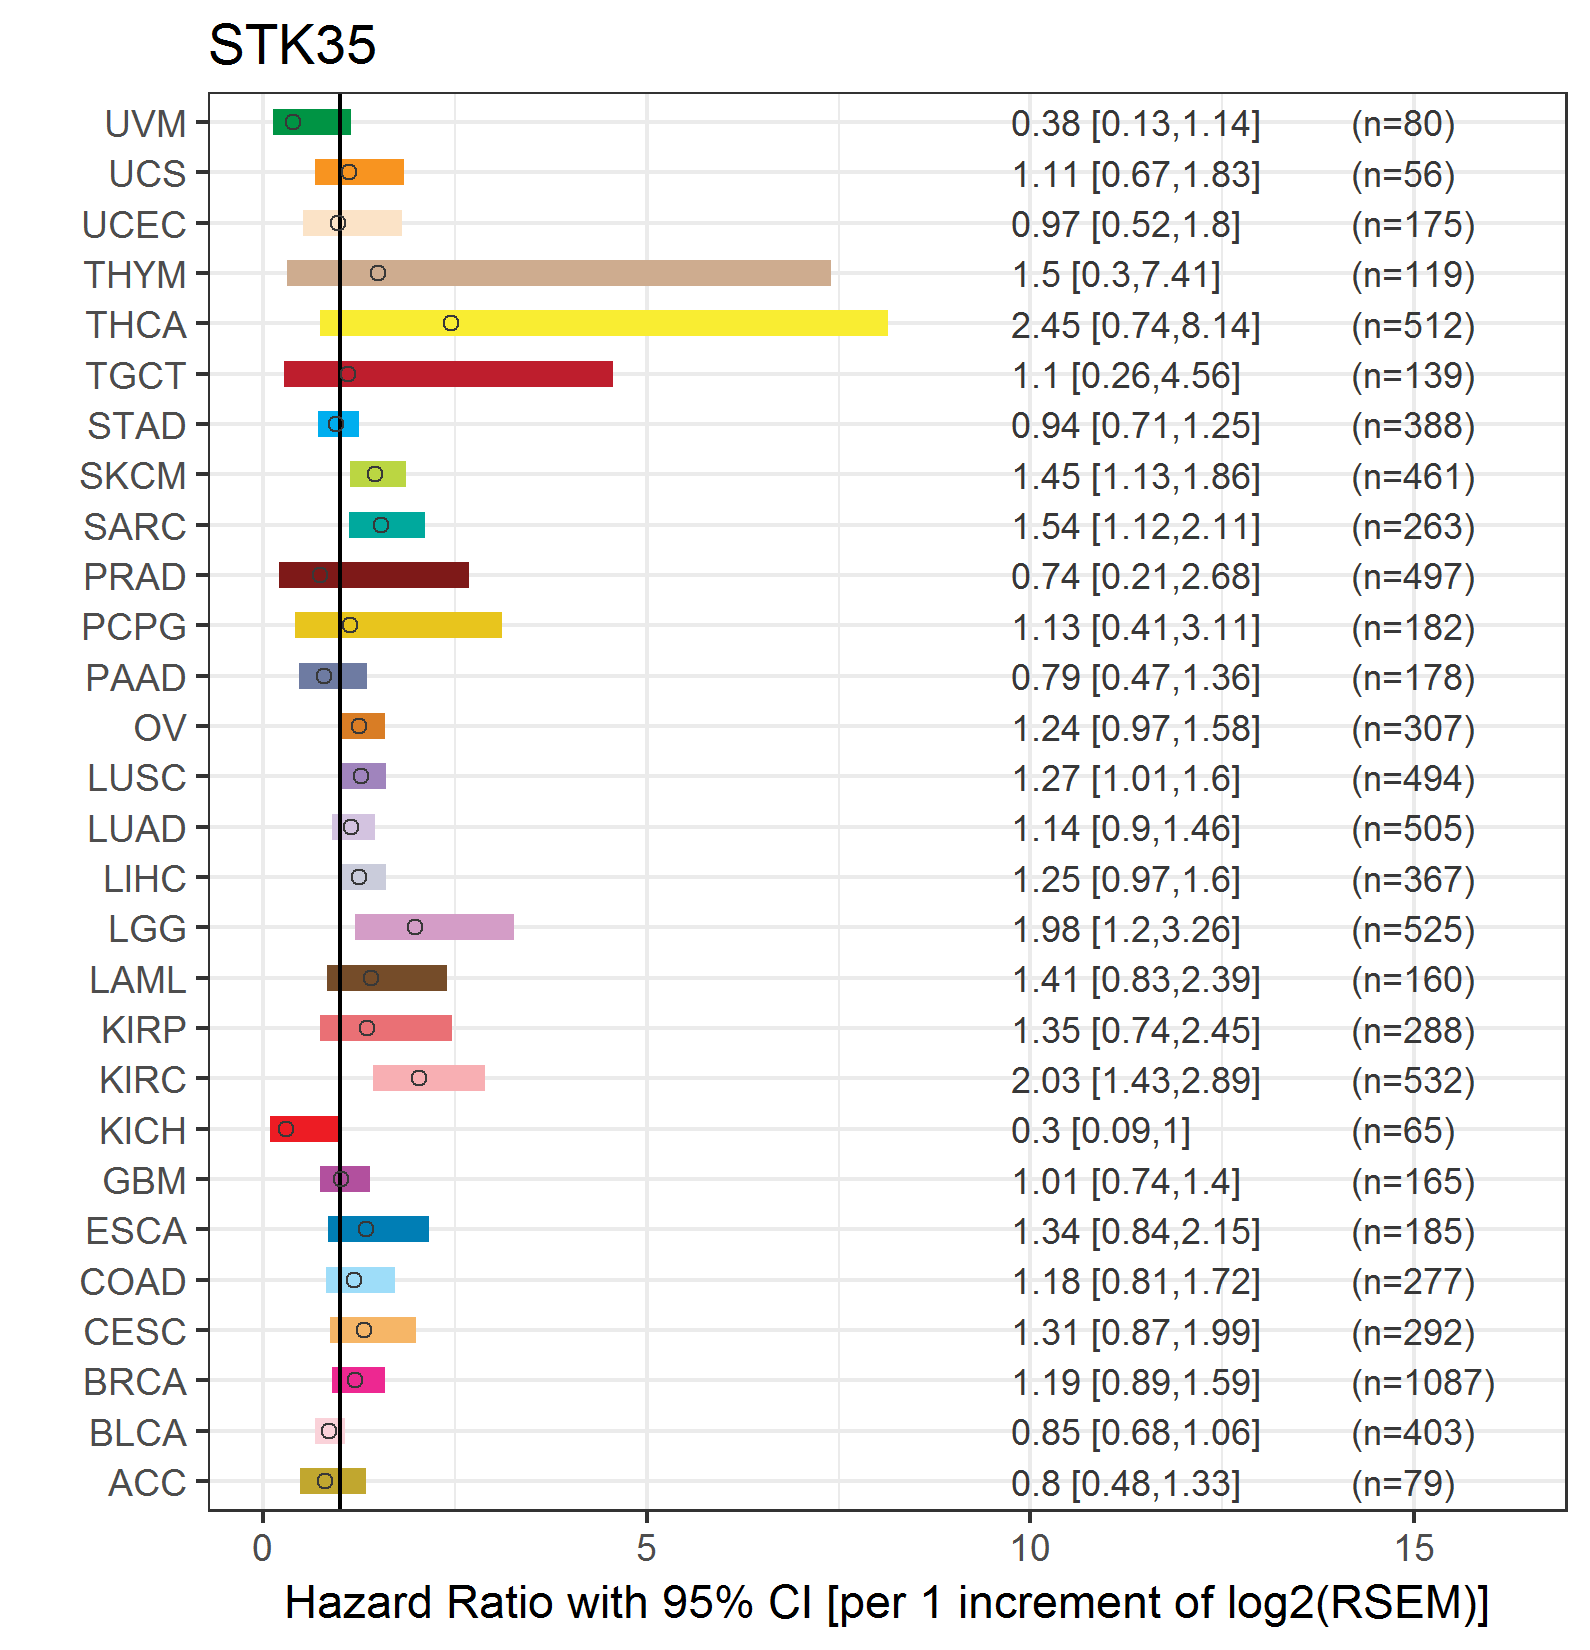
| Forest plot of Cox proportional hazard ratio (HR) and 95% CI of overall survival (OS) using 28 cancer types (TCGA IlluminaHiSeq_RNASeqV2, pan-cancer normalized log2(norm_counts+1) data, version 2016-08-16) (TCGA clinicalMatrix, phenotype data, version 2016-04-27) * Click on the image enlarge it in a new window. |
 |
| Forest plot of Cox proportional hazard ratio (HR) and 95% CI of relapse free survival (RFS) using 28 cancer types (TCGA IlluminaHiSeq_RNASeqV2, pan-cancer normalized log2(norm_counts+1) data, version 2016-08-16) (TCGA clinicalMatrix, phenotype data, version 2016-04-27) * Click on the image enlarge it in a new window. |
 |
| Top |
| TissGeneClin for STK35 |
| TissGeneDrug for STK35 |
| Drug information targeting TissGene (DrugBank Version 5.0.6, 2017-04-01) |
| DrugBank ID | Drug name | Drug activity | Drug type | Drug status |
| Top |
| TissGeneDisease for STK35 |
| Disease information associated with TissGene (DisGeNet, 2016-06-01) |
| Disease ID | Disease name | # pubmeds | Source |
|
Copyright 2016-Present - The University of Texas Health Science Center at Houston (UTHealth) Web File Viewing | How to Report, Fraud, Waste and Abuse | State of Texas | Statewide Search | Texas Homeland Security | Site Policies |