 |
| |
| |
| |
| |
| |
| |
|

| TissGeneSummary for CRYBA4 |
 Gene summary Gene summary |
| Basic gene information | Gene symbol | CRYBA4 |
| Gene name | crystallin, beta A4 | |
| Synonyms | CTRCT23|MCOPCT4 | |
| Cytomap | UCSC genome browser: 22q12.1 | |
| Type of gene | protein-coding | |
| RefGenes | NM_001886.2, | |
| Description | beta crystallin A4 chain transcript PSbeta-A4 crystallinbeta-crystallin A4crystallin, beta polypeptide A4eye lens structural protein | |
| Modification date | 20141207 | |
| dbXrefs | MIM : 123631 | |
| HGNC : HGNC | ||
| Ensembl : ENSG00000196431 | ||
| HPRD : 00432 | ||
| Vega : OTTHUMG00000150983 | ||
| Protein | UniProt: go to UniProt's Cross Reference DB Table | |
| Expression | CleanEX: HS_CRYBA4 | |
| BioGPS: 1413 | ||
| Pathway | NCI Pathway Interaction Database: CRYBA4 | |
| KEGG: CRYBA4 | ||
| REACTOME: CRYBA4 | ||
| Pathway Commons: CRYBA4 | ||
| Context | iHOP: CRYBA4 | |
| ligand binding site mutation search in PubMed: CRYBA4 | ||
| UCL Cancer Institute: CRYBA4 | ||
| Assigned class in TissGDB* | C | |
| Included tissue-specific gene expression resources | TiGER,GTEx | |
| Specific-tissues in normal samples (assigned by TissGDB using HPA, TiGER, and GTEx) | TestisEye | |
| Cancer types related to the specific-tissues in cancer samples (assigned by TissGDB using TCGA) | TGCTUVM | |
| Reference showing the relevant tissue of CRYBA4 | ||
| Description by TissGene annotations | TissgsKTS | |
| * Class A consists of genes with literature evidence and is part of the cTissGenes. Class B consists of only cTissGenes without additional evidence. The remaining genes belong to Class C. |
| Gene ontology having evidence of Inferred from Direct Assay (IDA) from Entrez |
| GO ID | GO term | PubMed ID |
| Top |
| TissGeneExp for CRYBA4 |
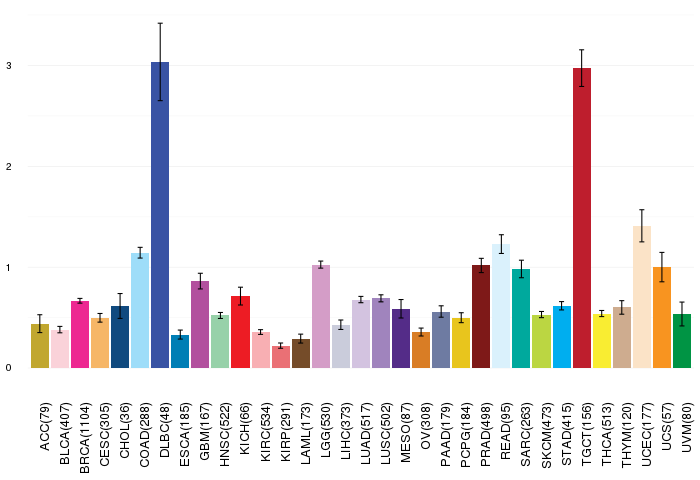
| Gene expressions across 28 cancer types (X-axis: cancer type and Y-axis: log2(norm_counts+1)) (TCGA IlluminaHiSeq_RNASeqV2, pan-cancer normalized log2(norm_counts+1) data, version 2016-08-16) |
 |
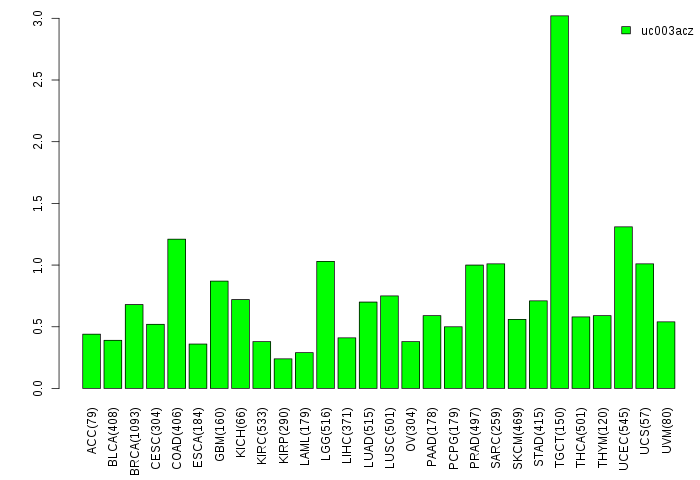
| Gene isoform expressions across 28 cancer types (X-axis: cancer type and Y-axis: log2(norm_counts+1)) (TCGA pan-cancer tcga_rsem_isoform_tpm, version 2016-09-01) |
 |
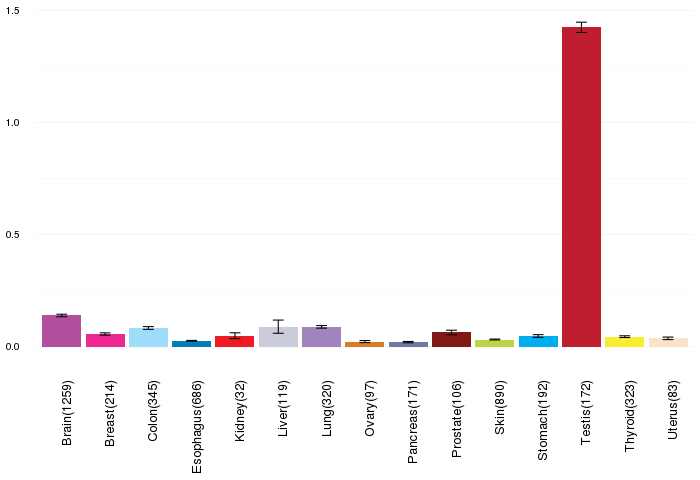
| Gene expressions across normal tissues of GTEx data (GTEx GTEx_Analysis_v6_RNA-seq_RNA-SeQCv1.1.8_gene_rpkm.gct) - Here, we shows the matched tissue types only among our 28 cancer types. |
 |
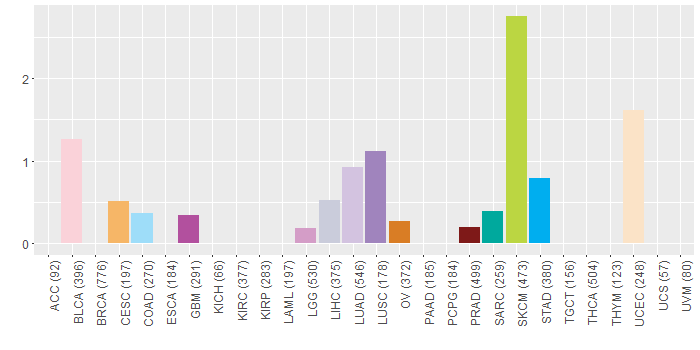
| Different expressions across 14 cancer types with more than 10 samples between matched tumors and normals (X-axis: cancer type and Y-axis: log2(norm_counts+1)) (TCGA IlluminaHiSeq_RNASeqV2, pan-cancer normalized log2(norm_counts+1) data, version 2016-08-16) |
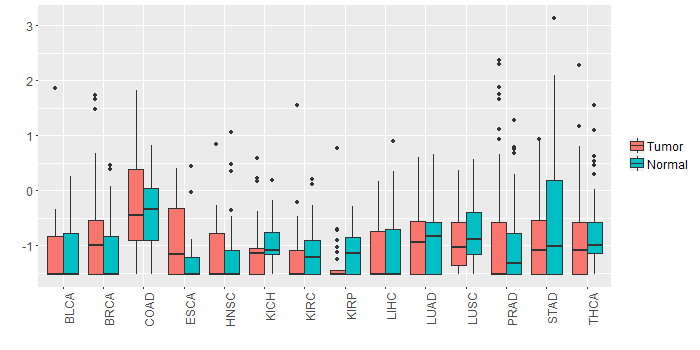 |
| - Significantly differentially expressed cancer types and information. (|Fold change|>1 and FDR<0.05) |
| Cancer type | Mean(exp) in tumor | Mean(exp) in matched normal | Log2FC | P-val. | FDR |
| Top |
| TissGene-miRNA for CRYBA4 |
| Significantly anti-correlated miRNAs of TissGene across 28 cancer types (Gene-miRNA relations from TargetScanHuman Relsease 7.1, Conserved_Site_Context_Scores.txt.zip, 06.01.2016) (TCGA IlluminaHiSeq_miRNASeq, log2(RPM+1) data, version 2016-11-21) (TCGA IlluminaHiSeq_RNASeqV2, log2(normalized_count+1) data, version 2016-08-16) (Spearman’s Rank Correlation (p-value<0.05 and coefficient<-0.25)) |
| Cancer type | miRNA id | miRNA accession | P-val. | Coeff. | # samples |
| Top |
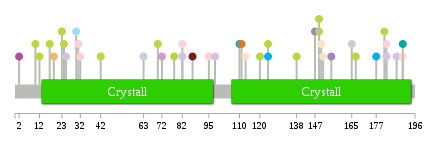
| TissGeneMut for CRYBA4 |
| TissGeneSNV for CRYBA4 |
| nsSNV counts per each loci. Different colors of circles represent different cancer types. Circle size denotes number of samples. (TCGA somatic mutation (SNPs and small INDELs) data, version 2016-04-25) * Click on the image to enlarge it in a new window. |
 |
 |
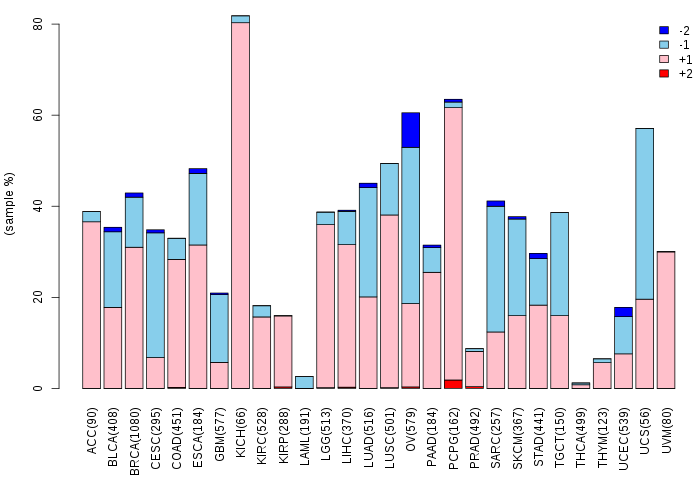
| Somatic nucleotide variants of TissGene across 28 cancer types (X-axis: cancer type and Y-axis: % of mutated samples) The numbers in parentheses are numbers of samples with mutation (nsSNVs). (TCGA somatic mutation (SNPs and small INDELs) data, version 2016-04-25) |
 |
| - nsSNVs sorted by frequency. |
| AAchange | Cancer type | # samples |
| p.A31V | BLCA | 1 |
| p.H182Y | BLCA | 1 |
| p.E32Q | BLCA | 1 |
| p.E42K | SKCM | 1 |
| p.D124N | SKCM | 1 |
| p.F110I | HNSC | 1 |
| p.C151Y | UCEC | 1 |
| p.S181F | SKCM | 1 |
| p.H182D | LUAD | 1 |
| p.G24D | SKCM | 1 |
| p.E111D | OV | 1 |
| p.Q23* | SKCM | 1 |
| p.G10E | SKCM | 1 |
| p.S190N | UCEC | 1 |
| p.G72C | LGG | 1 |
| p.T30M | COAD | 1 |
| p.E113D | UCEC | 1 |
| p.Q63H | LIHC | 1 |
| p.S190I | SARC | 1 |
| p.E165D | LIHC | 1 |
| p.G147V | LUSC | 1 |
| p.W149* | SKCM | 1 |
| p.E19K | CESC | 1 |
| p.D78N | SKCM | 1 |
| p.F110V | STAD | 1 |
| p.G82V | LUAD | 1 |
| p.V150G | UCEC | 1 |
| p.R95Q | BLCA | 1 |
| p.W149X | SKCM | 1 |
| p.P87H | PRAD | 1 |
| p.P155S | LUSC | 1 |
| p.G120R | SKCM | 1 |
| p.E70K | SKCM | 1 |
| p.Q187L | LUAD | 1 |
| p.E19K | HNSC | 1 |
| p.E138K | SKCM | 1 |
| p.G82S | BLCA | 1 |
| p.W17* | SKCM | 1 |
| p.M132I | HNSC | 1 |
| p.W12* | SKCM | 1 |
| p.D124N | STAD | 1 |
| p.C99F | HNSC | 1 |
| p.Q161* | HNSC | 1 |
| p.D167N | SKCM | 1 |
| p.R25L | LUAD | 1 |
| p.A98S | LUAD | 1 |
| p.R177W | STAD | 1 |
| p.T2A | GBM | 1 |
| Top |
| TissGeneCNV for CRYBA4 |
| Copy number variations of TissGene across 28 cancer types (X-axis: cancer type and Y-axis: % of CNV samples) (TCGA Gistic2_CopyNumber_Gistic2_all_data_by_genes, Gistic2 copy number data, version 2016-08-16) |
 |
| Top |
| TissGeneFusions for CRYBA4 |
| Fusion genes including TissGene (ChimerDB 3.0, 2016-12-01 and TCGA fusion Portal 2015-12-01) |
| Database | Src | Cancer type | Sample | Fusion gene | ORF | 5'-gene BP | 3'-gene BP |
| TCGAfusionPortal | PRADA | BRCA | TCGA-D8-A1XL-01A | USP32-CRYBA4 | CDS-5UTR | Chr17:58372044 | Chr22:27018549 |
| Top |
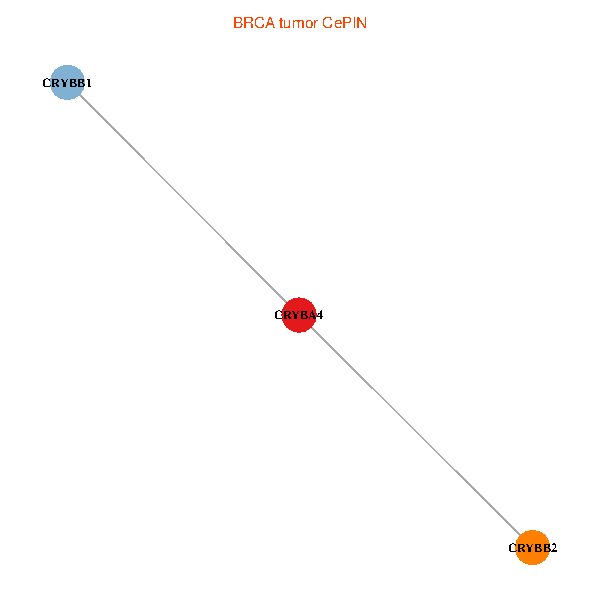
| TissGeneNet for CRYBA4 |
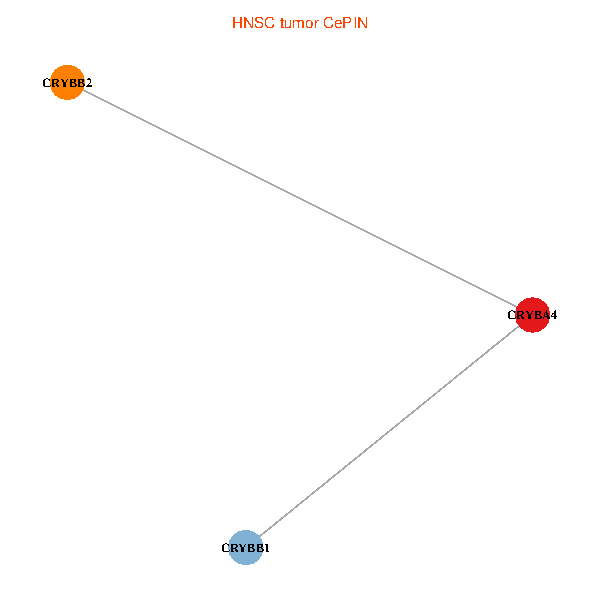
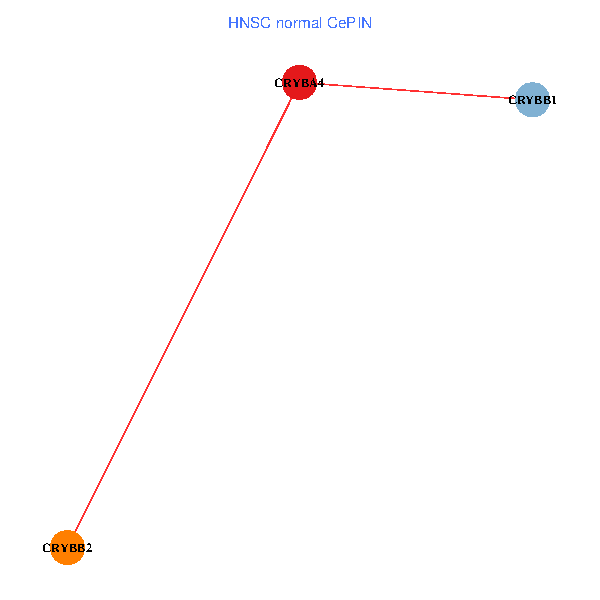
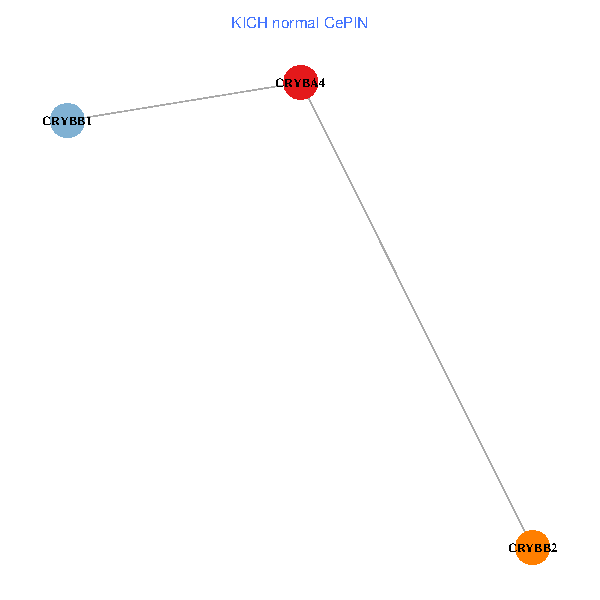
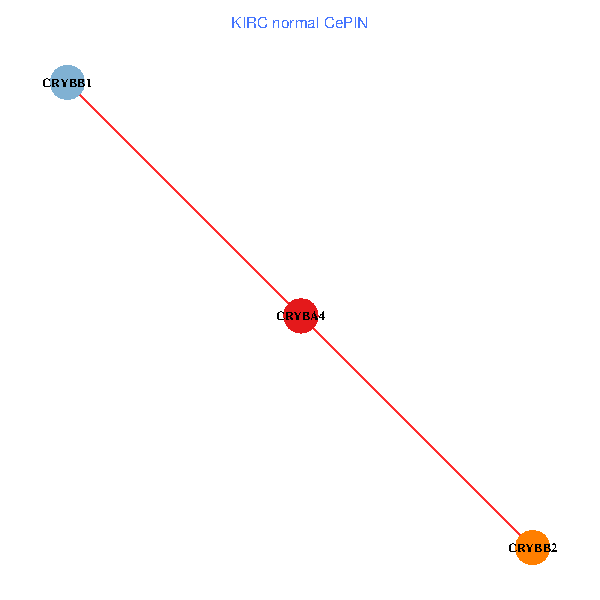
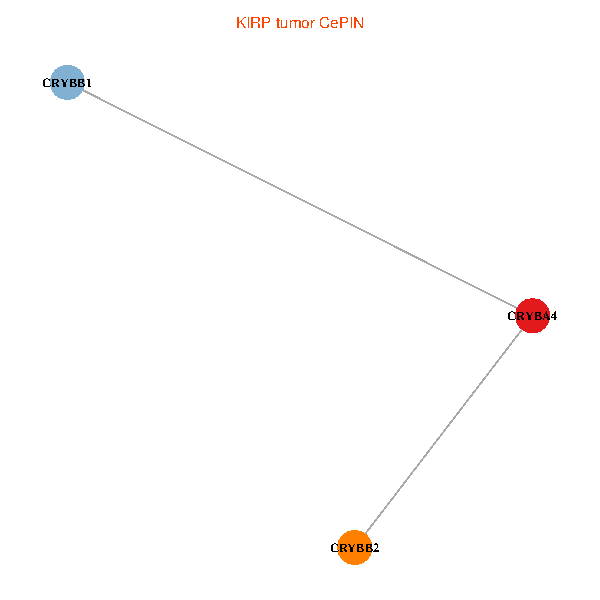
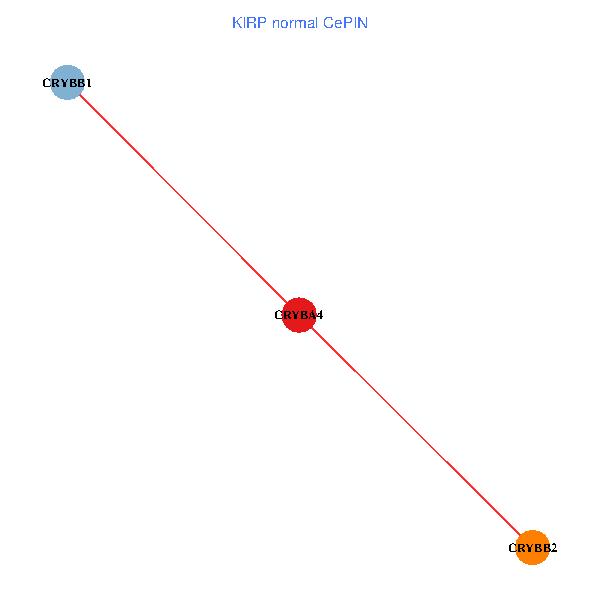
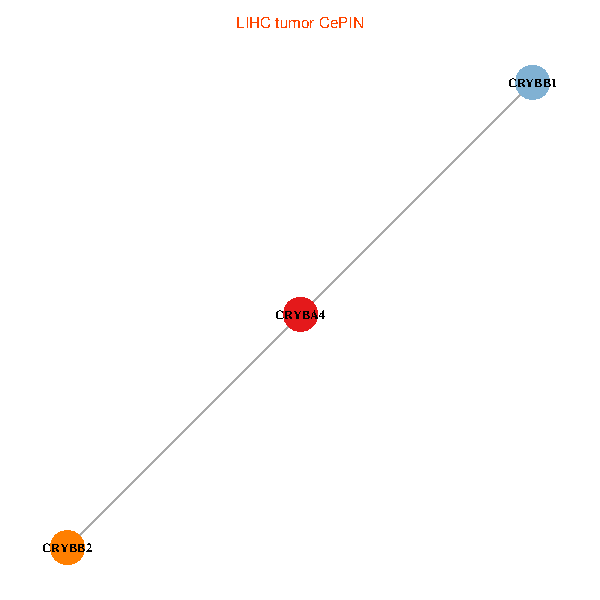
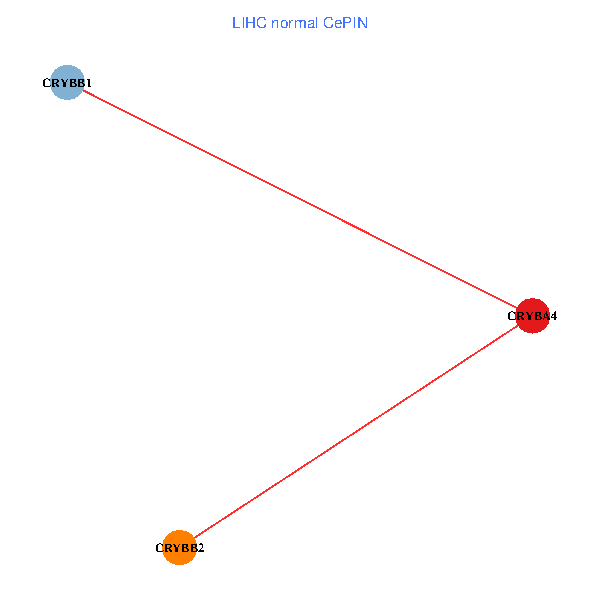
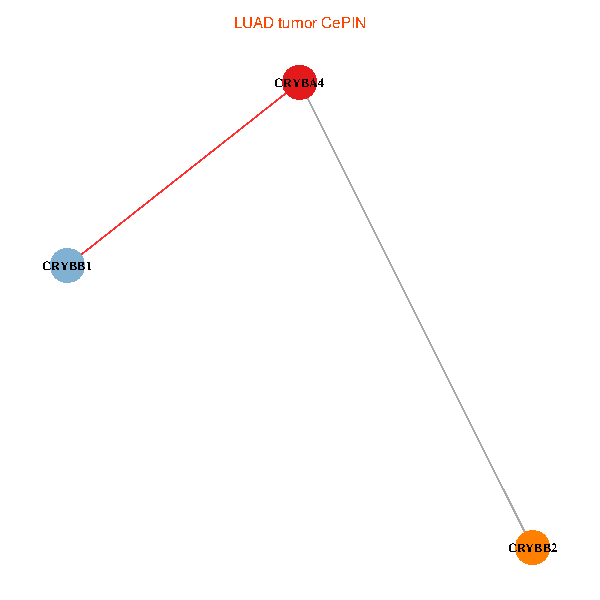
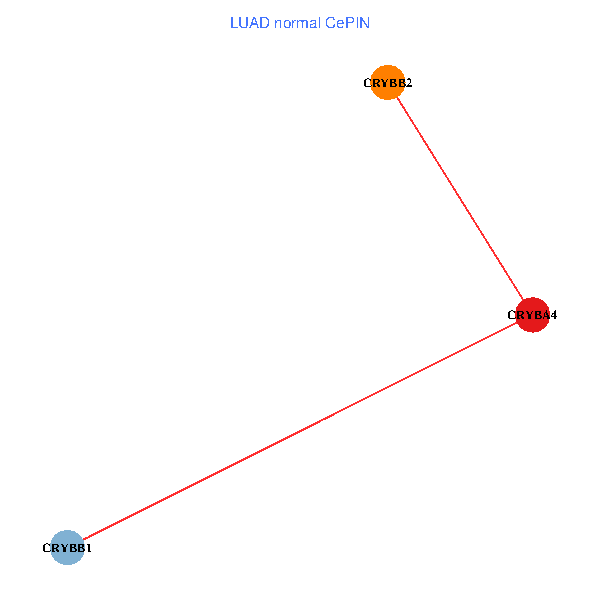
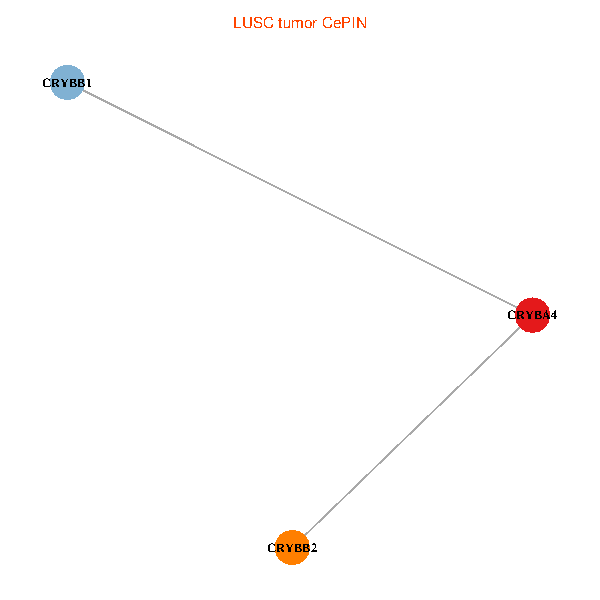
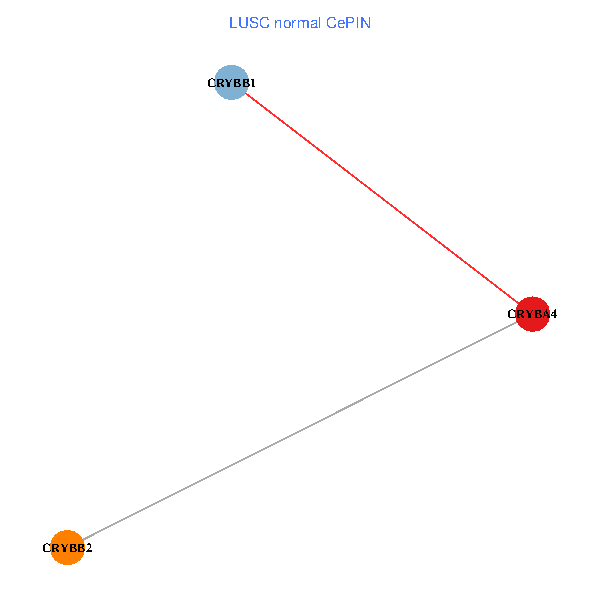
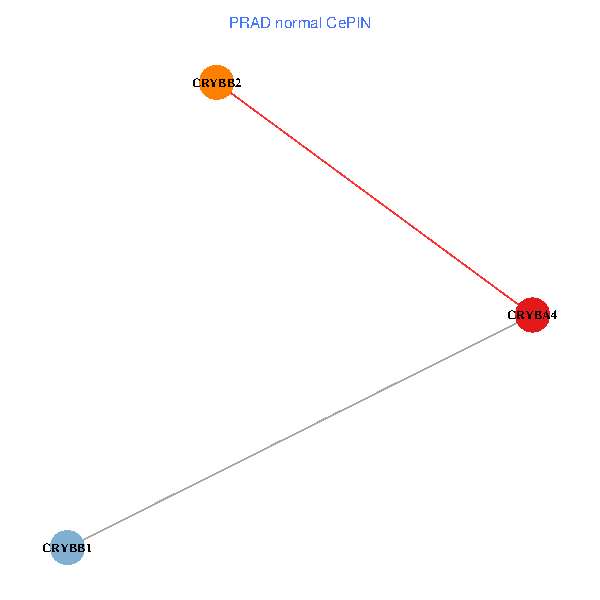
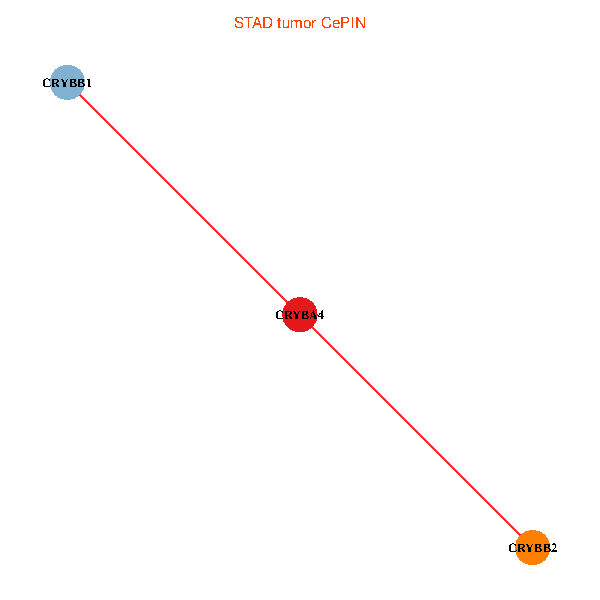
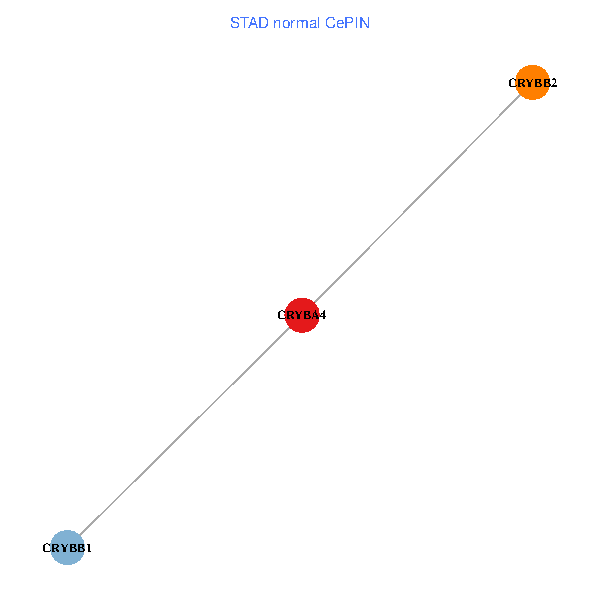
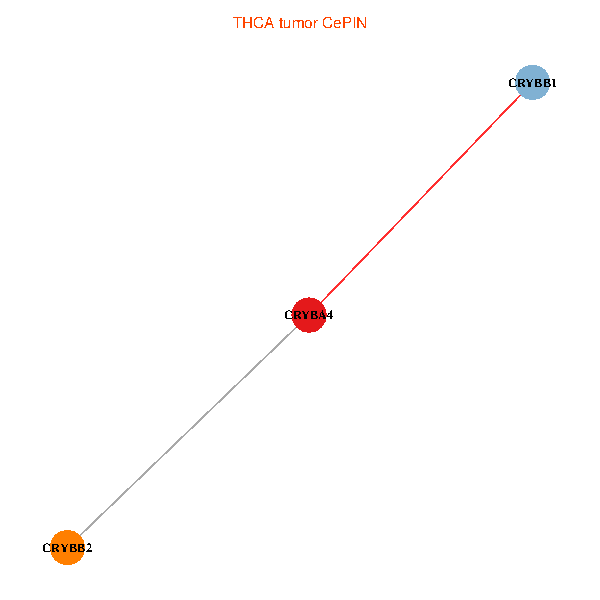
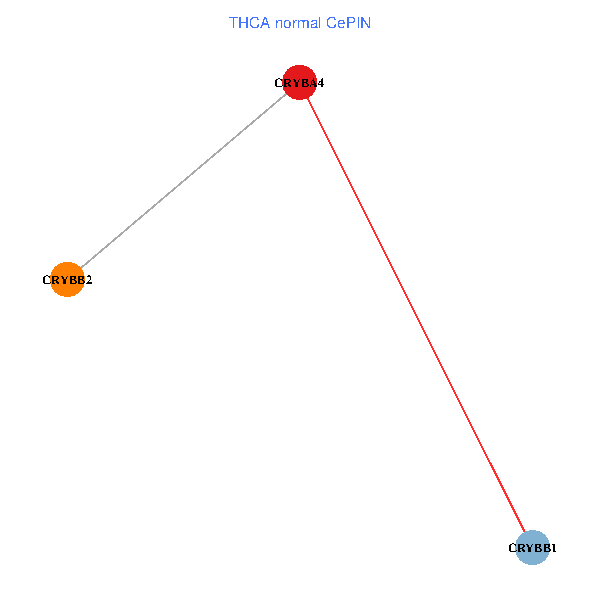
| Co-expressed gene networks based on protein-protein interaction data (CePIN) (TCGA IlluminaHiSeq_RNASeqV2, pan-cancer normalized log2(norm_counts+1) data, version 2016-08-16) (PINA2 ppi data) |
| BRCA (tumor) | BRCA (normal) |
| CRYBA4, CRYBB1, CRYBB2 (tumor) | CRYBA4, CRYBB1, CRYBB2 (normal) |
 |  |
| COAD (tumor) | COAD (normal) |
| CRYBA4, CRYBB1, CRYBB2 (tumor) | CRYBA4, CRYBB1, CRYBB2 (normal) |
 |  |
| HNSC (tumor) | HNSC (normal) |
| CRYBA4, CRYBB1, CRYBB2 (tumor) | CRYBA4, CRYBB1, CRYBB2 (normal) |
 |  |
| KICH (tumor) | KICH (normal) |
| CRYBA4, CRYBB1, CRYBB2 (tumor) | CRYBA4, CRYBB1, CRYBB2 (normal) |
 |  |
| KIRC (tumor) | KIRC (normal) |
| CRYBA4, CRYBB1, CRYBB2 (tumor) | CRYBA4, CRYBB1, CRYBB2 (normal) |
 |  |
| KIRP (tumor) | KIRP (normal) |
| CRYBA4, CRYBB1, CRYBB2 (tumor) | CRYBA4, CRYBB1, CRYBB2 (normal) |
 |  |
| LIHC (tumor) | LIHC (normal) |
| CRYBA4, CRYBB1, CRYBB2 (tumor) | CRYBA4, CRYBB1, CRYBB2 (normal) |
 |  |
| LUAD (tumor) | LUAD (normal) |
| CRYBA4, CRYBB1, CRYBB2 (tumor) | CRYBA4, CRYBB1, CRYBB2 (normal) |
 |  |
| LUSC (tumor) | LUSC (normal) |
| CRYBA4, CRYBB1, CRYBB2 (tumor) | CRYBA4, CRYBB1, CRYBB2 (normal) |
 |  |
| PRAD (tumor) | PRAD (normal) |
| CRYBA4, CRYBB1, CRYBB2 (tumor) | CRYBA4, CRYBB1, CRYBB2 (normal) |
 |  |
| STAD (tumor) | STAD (normal) |
| CRYBA4, CRYBB1, CRYBB2 (tumor) | CRYBA4, CRYBB1, CRYBB2 (normal) |
 |  |
| THCA (tumor) | THCA (normal) |
| CRYBA4, CRYBB1, CRYBB2 (tumor) | CRYBA4, CRYBB1, CRYBB2 (normal) |
 |  |
| Top |
| TissGeneProg for CRYBA4 |
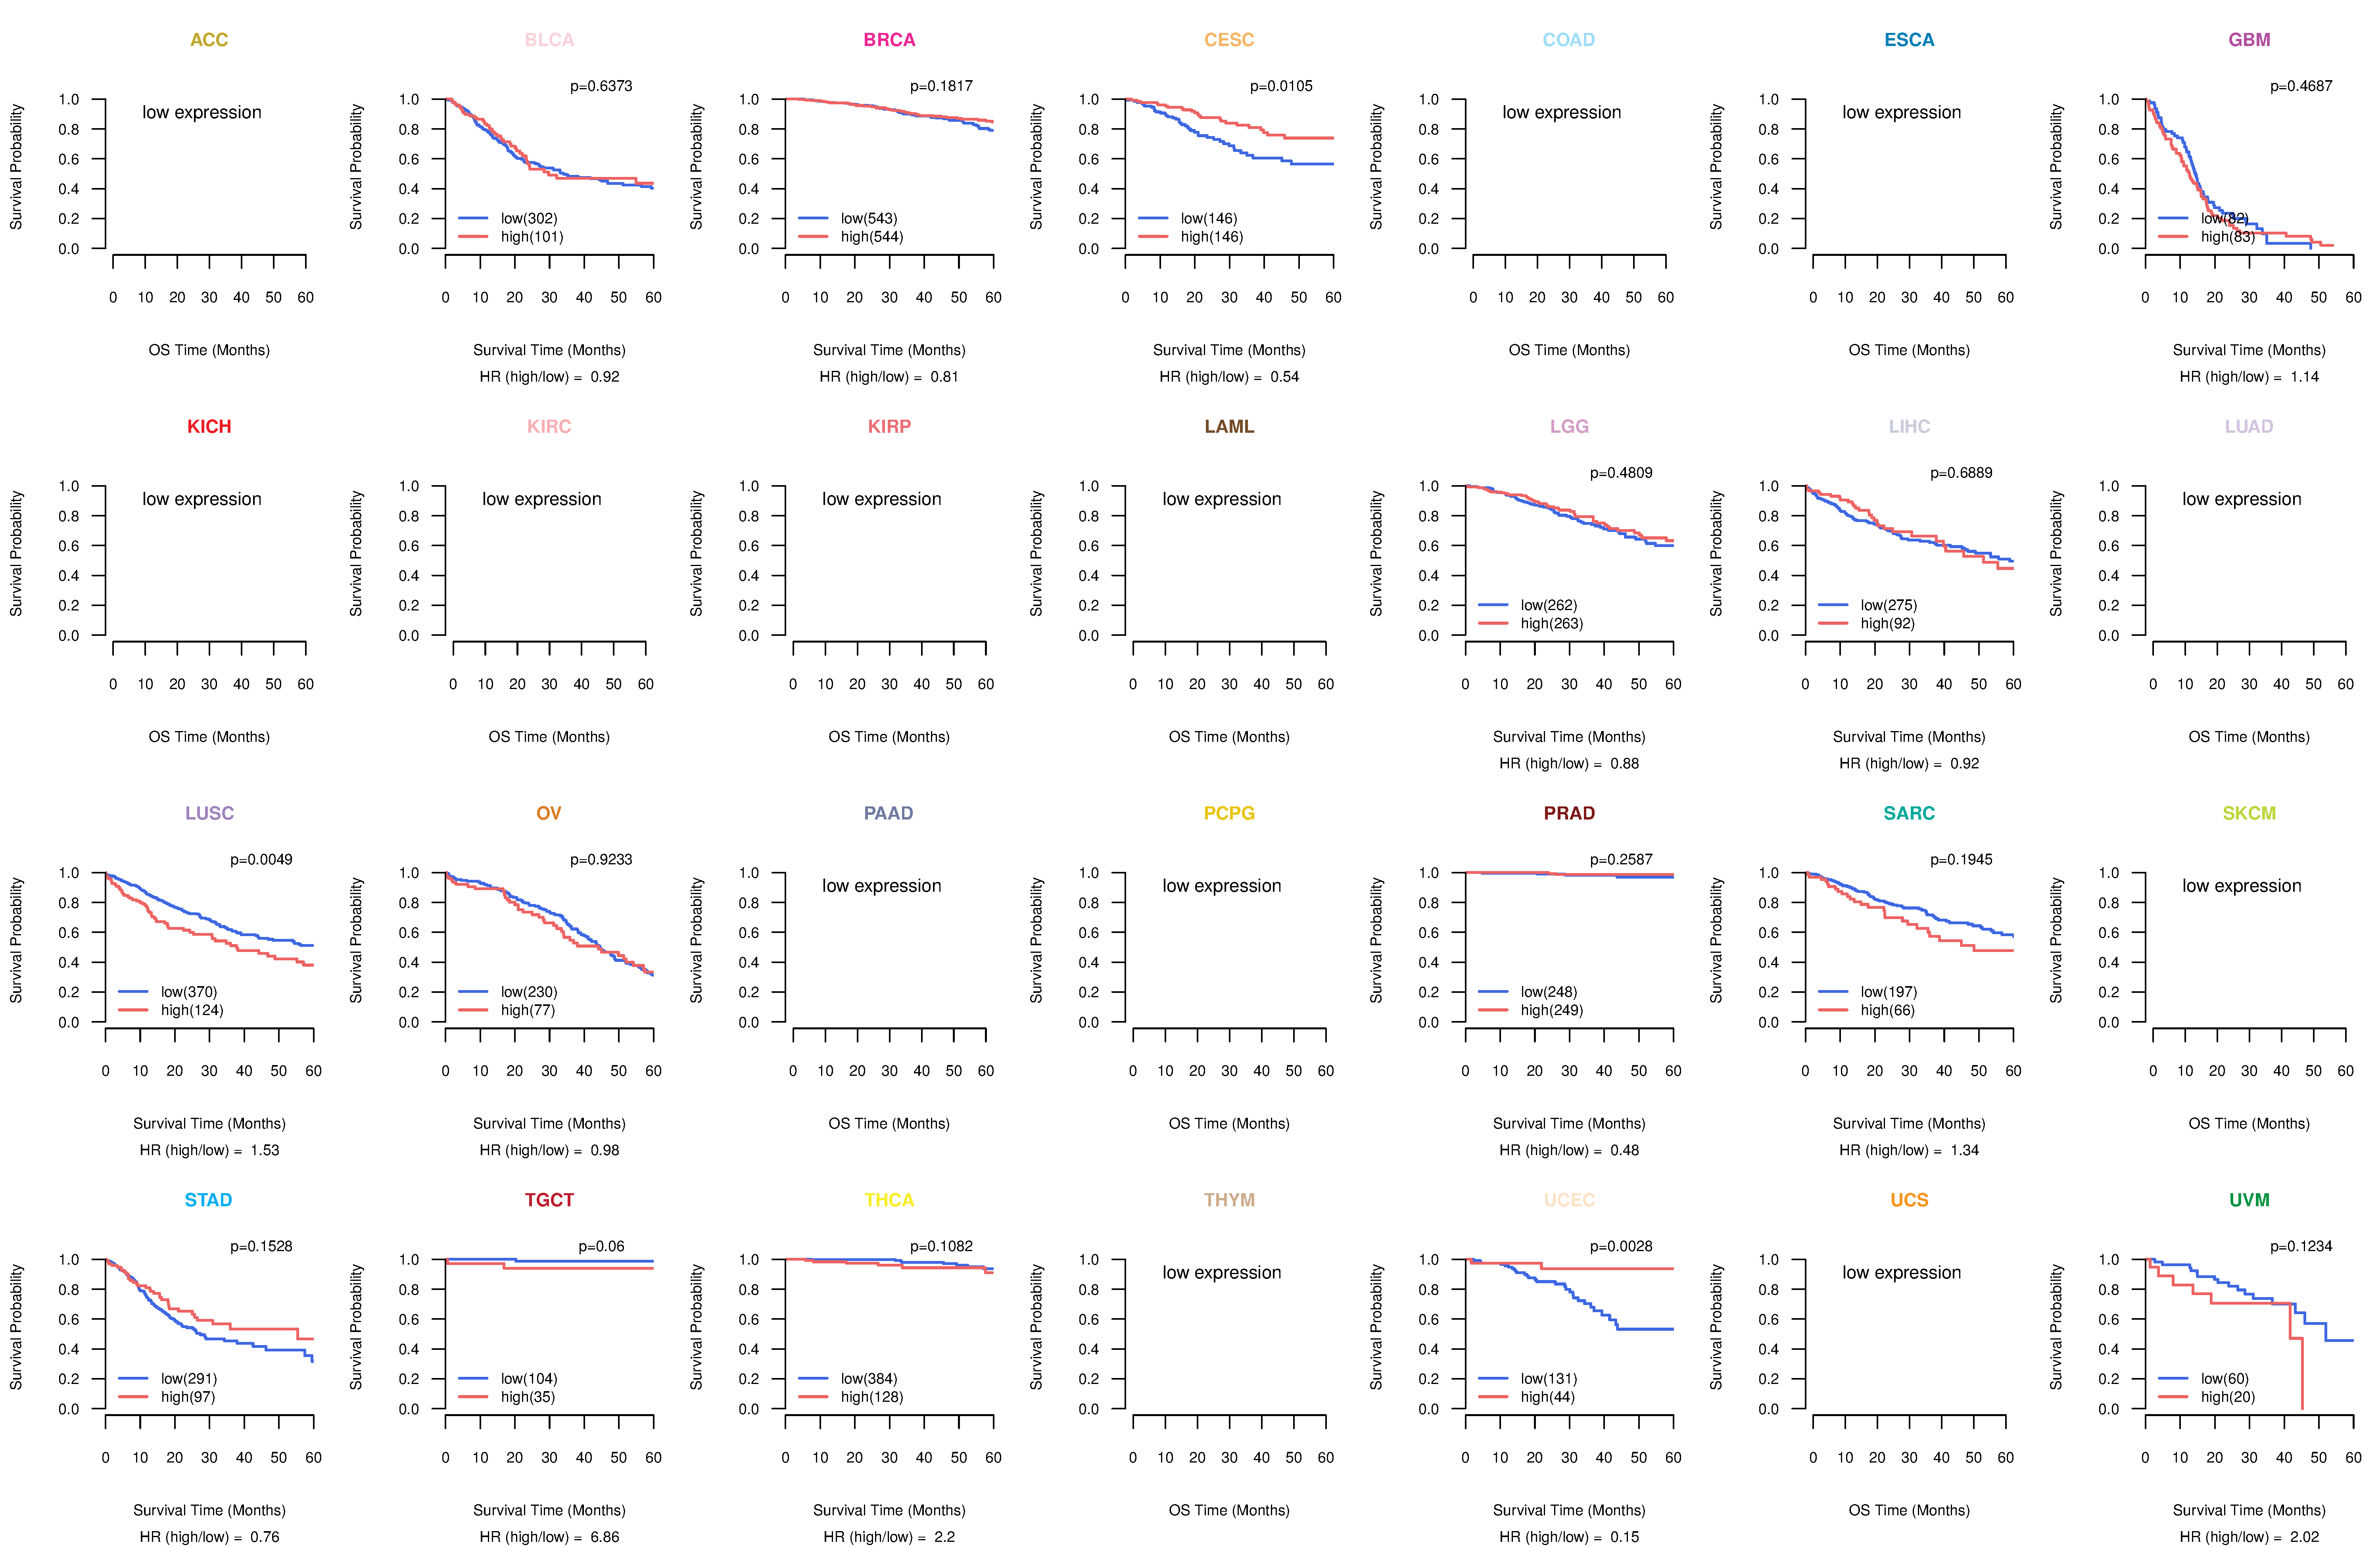
| Kaplan-Meier plots with logrank tests of overall survival (OS) using 28 cancer types (TCGA IlluminaHiSeq_RNASeqV2, pan-cancer normalized log2(norm_counts+1) data, version 2016-08-16) (TCGA clinicalMatrix, phenotype data, version 2016-04-27) * Click on the image to enlarge it in a new window. |
 |
| Kaplan-Meier plots with logrank test of relapse free survival (RFS) using 28 cancer types (TCGA IlluminaHiSeq_RNASeqV2, pan-cancer normalized log2(norm_counts+1) data, version 2016-08-16) (TCGA clinicalMatrix, phenotype data, version 2016-04-27) * Click on the image enlarge it in a new window. |
 |
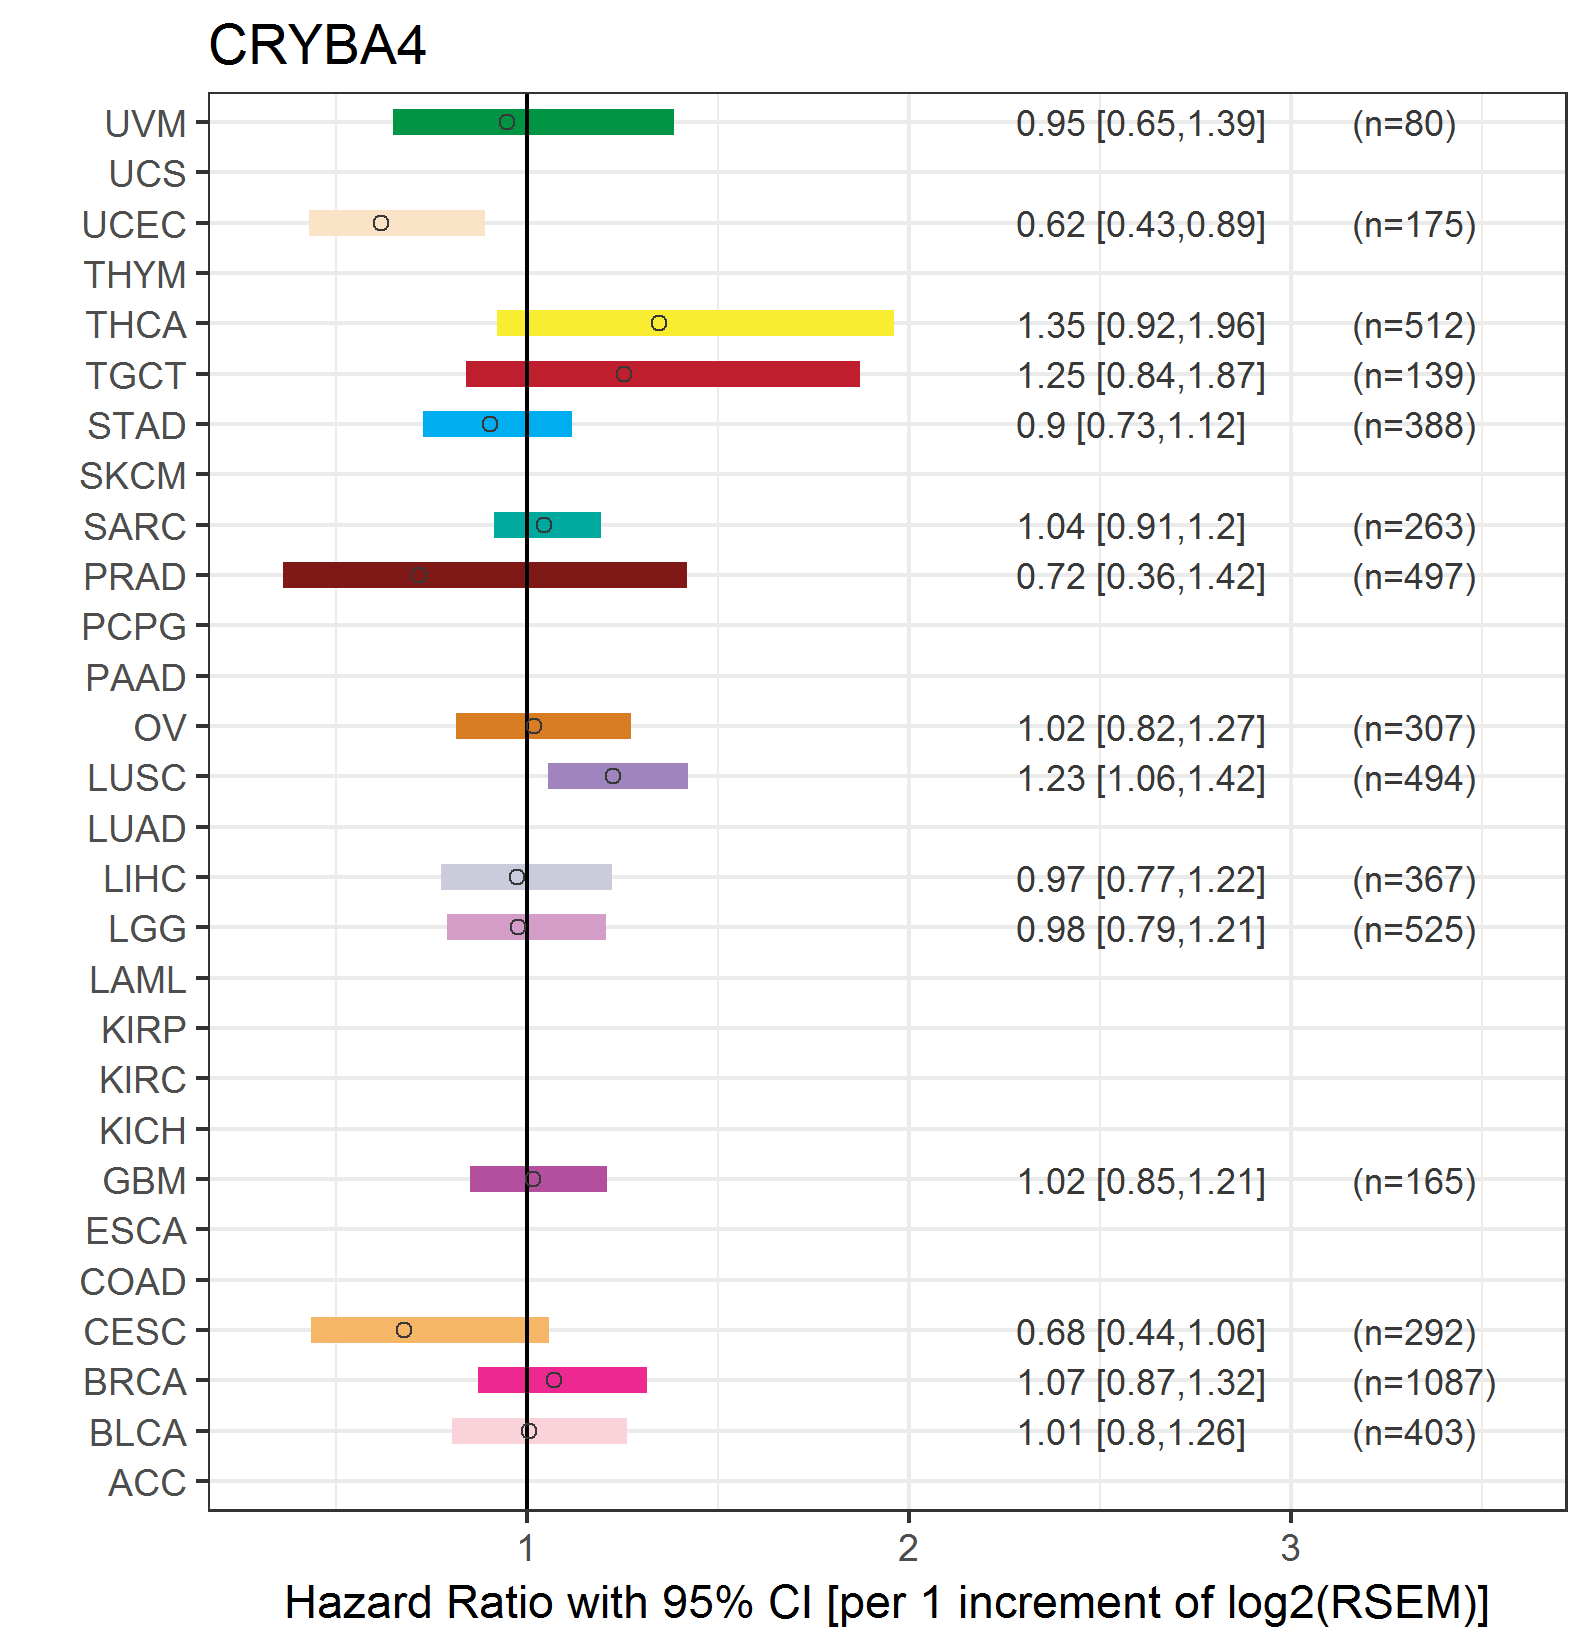
| Forest plot of Cox proportional hazard ratio (HR) and 95% CI of overall survival (OS) using 28 cancer types (TCGA IlluminaHiSeq_RNASeqV2, pan-cancer normalized log2(norm_counts+1) data, version 2016-08-16) (TCGA clinicalMatrix, phenotype data, version 2016-04-27) * Click on the image enlarge it in a new window. |
 |
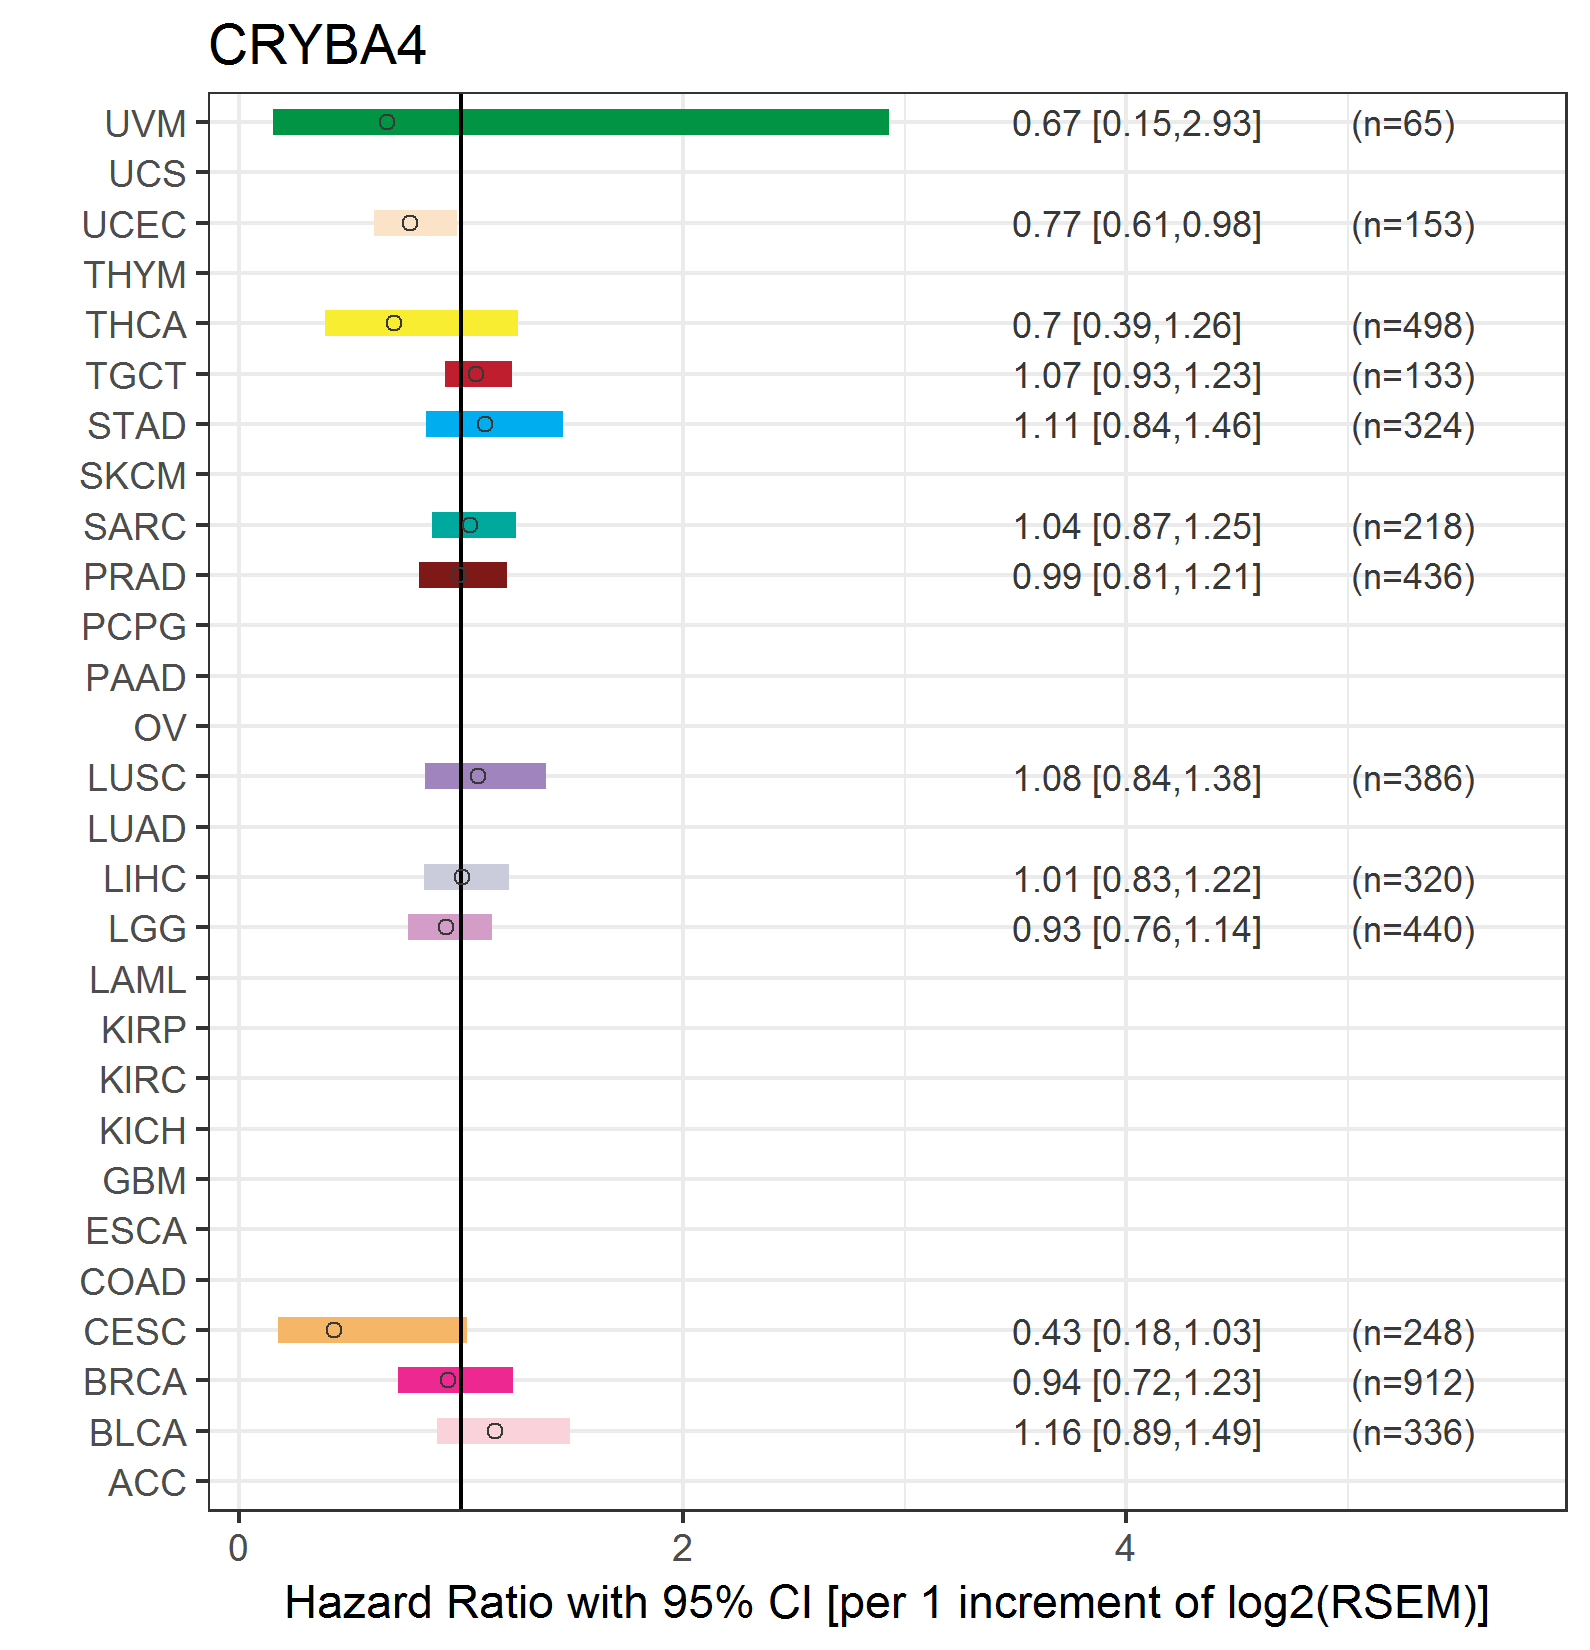
| Forest plot of Cox proportional hazard ratio (HR) and 95% CI of relapse free survival (RFS) using 28 cancer types (TCGA IlluminaHiSeq_RNASeqV2, pan-cancer normalized log2(norm_counts+1) data, version 2016-08-16) (TCGA clinicalMatrix, phenotype data, version 2016-04-27) * Click on the image enlarge it in a new window. |
 |
| Top |
| TissGeneClin for CRYBA4 |
| TissGeneDrug for CRYBA4 |
| Drug information targeting TissGene (DrugBank Version 5.0.6, 2017-04-01) |
| DrugBank ID | Drug name | Drug activity | Drug type | Drug status |
| Top |
| TissGeneDisease for CRYBA4 |
| Disease information associated with TissGene (DisGeNet, 2016-06-01) |
| Disease ID | Disease name | # pubmeds | Source |
| umls:C0086543 | Cataract | 4 | BeFree,RGD |
| umls:C0026010 | Microphthalmos | 3 | BeFree,GAD |
| umls:C0009363 | Congenital ocular coloboma (disorder) | 1 | GAD |
| umls:C0271183 | Severe myopia | 1 | BeFree |
| umls:C1858679 | CATARACT, AUTOSOMAL DOMINANT | 1 | BeFree |
| umls:C3808012 | CATARACT 23 | 1 | CTD_human,UNIPROT |
| umls:C1861821 | CATARACT, MARNER TYPE | 0 | ORPHANET |
| umls:C1861829 | Cataract microcornea syndrome | 0 | ORPHANET |
| umls:C1864879 | Cataract, Lamellar 2 | 0 | CLINVAR |
|
Copyright 2016-Present - The University of Texas Health Science Center at Houston (UTHealth) Web File Viewing | How to Report, Fraud, Waste and Abuse | State of Texas | Statewide Search | Texas Homeland Security | Site Policies |