 |
| |
| |
| |
| |
| |
| |
|

| TissGeneSummary for GLIPR1L2 |
 Gene summary Gene summary |
| Basic gene information | Gene symbol | GLIPR1L2 |
| Gene name | GLI pathogenesis-related 1 like 2 | |
| Synonyms | - | |
| Cytomap | UCSC genome browser: 12q21.2 | |
| Type of gene | protein-coding | |
| RefGenes | NM_001270396.1, NM_152436.2,NR_072995.1, | |
| Description | GLIPR1-like protein 2 | |
| Modification date | 20141207 | |
| dbXrefs | MIM : 610394 | |
| HGNC : HGNC | ||
| Ensembl : ENSG00000180481 | ||
| HPRD : 17538 | ||
| Vega : OTTHUMG00000169756 | ||
| Protein | UniProt: go to UniProt's Cross Reference DB Table | |
| Expression | CleanEX: HS_GLIPR1L2 | |
| BioGPS: 144321 | ||
| Pathway | NCI Pathway Interaction Database: GLIPR1L2 | |
| KEGG: GLIPR1L2 | ||
| REACTOME: GLIPR1L2 | ||
| Pathway Commons: GLIPR1L2 | ||
| Context | iHOP: GLIPR1L2 | |
| ligand binding site mutation search in PubMed: GLIPR1L2 | ||
| UCL Cancer Institute: GLIPR1L2 | ||
| Assigned class in TissGDB* | B | |
| Included tissue-specific gene expression resources | HPA,TiGER,GTEx | |
| Specific-tissues in normal samples (assigned by TissGDB using HPA, TiGER, and GTEx) | Testis | |
| Cancer types related to the specific-tissues in cancer samples (assigned by TissGDB using TCGA) | TGCT | |
| Reference showing the relevant tissue of GLIPR1L2 | ||
| Description by TissGene annotations | ||
| * Class A consists of genes with literature evidence and is part of the cTissGenes. Class B consists of only cTissGenes without additional evidence. The remaining genes belong to Class C. |
| Gene ontology having evidence of Inferred from Direct Assay (IDA) from Entrez |
| GO ID | GO term | PubMed ID |
| Top |
| TissGeneExp for GLIPR1L2 |
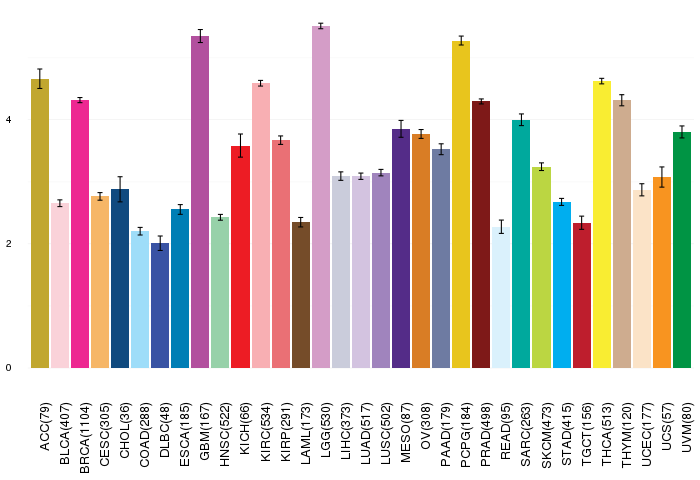
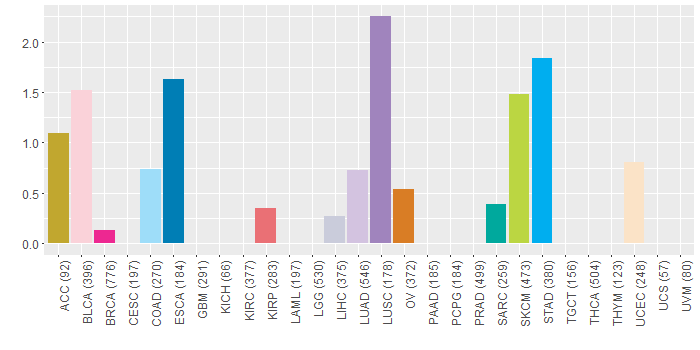
| Gene expressions across 28 cancer types (X-axis: cancer type and Y-axis: log2(norm_counts+1)) (TCGA IlluminaHiSeq_RNASeqV2, pan-cancer normalized log2(norm_counts+1) data, version 2016-08-16) |
 |
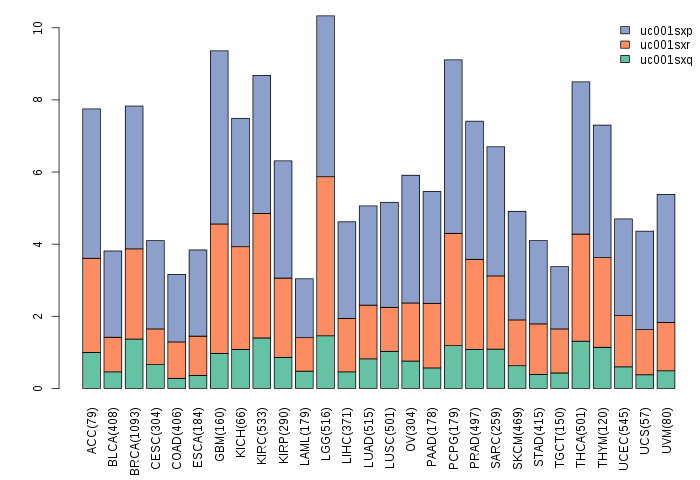
| Gene isoform expressions across 28 cancer types (X-axis: cancer type and Y-axis: log2(norm_counts+1)) (TCGA pan-cancer tcga_rsem_isoform_tpm, version 2016-09-01) |
 |
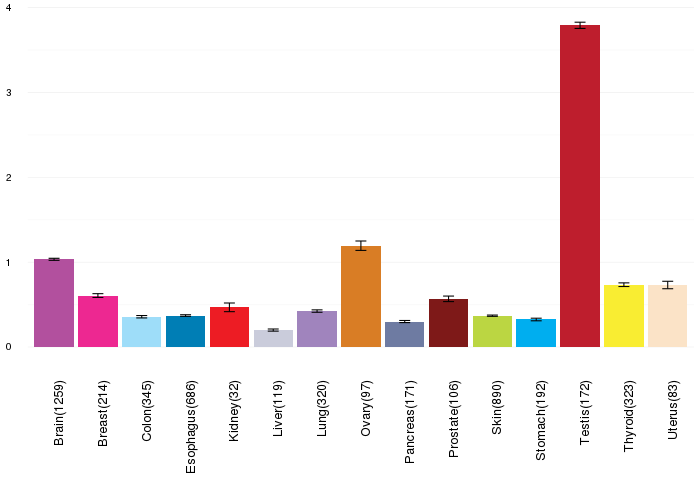
| Gene expressions across normal tissues of GTEx data (GTEx GTEx_Analysis_v6_RNA-seq_RNA-SeQCv1.1.8_gene_rpkm.gct) - Here, we shows the matched tissue types only among our 28 cancer types. |
 |
| Different expressions across 14 cancer types with more than 10 samples between matched tumors and normals (X-axis: cancer type and Y-axis: log2(norm_counts+1)) (TCGA IlluminaHiSeq_RNASeqV2, pan-cancer normalized log2(norm_counts+1) data, version 2016-08-16) |
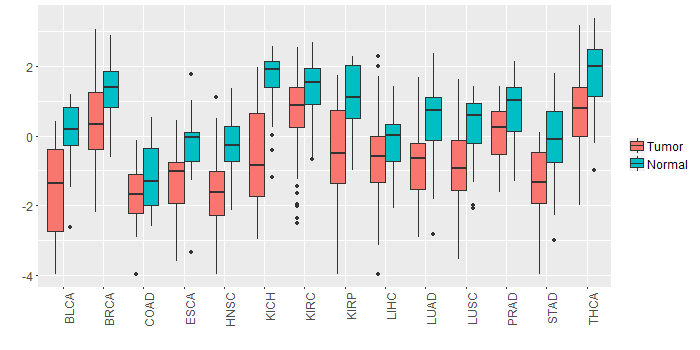 |
| - Significantly differentially expressed cancer types and information. (|Fold change|>1 and FDR<0.05) |
| Cancer type | Mean(exp) in tumor | Mean(exp) in matched normal | Log2FC | P-val. | FDR |
| LUSC | -0.849348047 | 0.277473522 | -1.126821569 | 3.27E-07 | 8.68E-07 |
| KIRP | -0.599404236 | 1.190064514 | -1.78946875 | 1.05E-06 | 5.36E-06 |
| THCA | 0.621976114 | 1.749816792 | -1.127840678 | 9.10E-08 | 3.97E-07 |
| LUAD | -0.753680636 | 0.437202122 | -1.190882759 | 3.83E-09 | 1.84E-08 |
| HNSC | -1.609188174 | -0.227497477 | -1.381690698 | 9.42E-10 | 1.54E-08 |
| KICH | -0.563032361 | 1.534007639 | -2.09704 | 3.71E-07 | 1.51E-06 |
| BLCA | -1.506553413 | 0.123725534 | -1.630278947 | 0.000273 | 0.002508893 |
| STAD | -1.396419861 | -0.214872986 | -1.181546875 | 3.56E-05 | 0.000325465 |
| Top |
| TissGene-miRNA for GLIPR1L2 |
| Significantly anti-correlated miRNAs of TissGene across 28 cancer types (Gene-miRNA relations from TargetScanHuman Relsease 7.1, Conserved_Site_Context_Scores.txt.zip, 06.01.2016) (TCGA IlluminaHiSeq_miRNASeq, log2(RPM+1) data, version 2016-11-21) (TCGA IlluminaHiSeq_RNASeqV2, log2(normalized_count+1) data, version 2016-08-16) (Spearman’s Rank Correlation (p-value<0.05 and coefficient<-0.25)) |
| Cancer type | miRNA id | miRNA accession | P-val. | Coeff. | # samples |
| Top |
| TissGeneMut for GLIPR1L2 |
| TissGeneSNV for GLIPR1L2 |
| nsSNV counts per each loci. Different colors of circles represent different cancer types. Circle size denotes number of samples. (TCGA somatic mutation (SNPs and small INDELs) data, version 2016-04-25) * Click on the image to enlarge it in a new window. |
 |
 |
| Somatic nucleotide variants of TissGene across 28 cancer types (X-axis: cancer type and Y-axis: % of mutated samples) The numbers in parentheses are numbers of samples with mutation (nsSNVs). (TCGA somatic mutation (SNPs and small INDELs) data, version 2016-04-25) |
 |
| - nsSNVs sorted by frequency. |
| AAchange | Cancer type | # samples |
| p.A193V | STAD | 2 |
| p.A193V | ESCA | 1 |
| p.E204K | BLCA | 1 |
| p.R245W | SARC | 1 |
| p.L222I | UCEC | 1 |
| p.C151F | LUAD | 1 |
| p.S136R | STAD | 1 |
| p.R135I | LUAD | 1 |
| p.K228T | READ | 1 |
| p.G123C | ESCA | 1 |
| p.F249L | SKCM | 1 |
| p.P46S | STAD | 1 |
| p.G123S | LUSC | 1 |
| p.W241L | ESCA | 1 |
| p.E48K | LUSC | 1 |
| p.W163L | SKCM | 1 |
| p.A19E | STAD | 1 |
| p.R89I | ACC | 1 |
| p.I116M | LUAD | 1 |
| p.R244Q | SKCM | 1 |
| p.P111S | SKCM | 1 |
| p.A193V | LIHC | 1 |
| p.R201S | OV | 1 |
| p.A193V | COAD | 1 |
| p.T210A | STAD | 1 |
| p.R211Q | OV | 1 |
| p.V82I | BLCA | 1 |
| p.K112E | HNSC | 1 |
| p.K240N | COAD | 1 |
| p.G123D | SKCM | 1 |
| p.E127K | SKCM | 1 |
| p.D154Y | BLCA | 1 |
| p.T199M | STAD | 1 |
| p.Y167H | LUSC | 1 |
| p.V169A | SKCM | 1 |
| p.D67N | HNSC | 1 |
| p.P70T | KIRP | 1 |
| p.M1T | BLCA | 1 |
| p.W163R | BLCA | 1 |
| p.G117V | LUSC | 1 |
| p.E140D | BLCA | 1 |
| p.T199R | LUAD | 1 |
| p.R211Q | BRCA | 1 |
| p.T163I | UCEC | 1 |
| Top |
| TissGeneCNV for GLIPR1L2 |
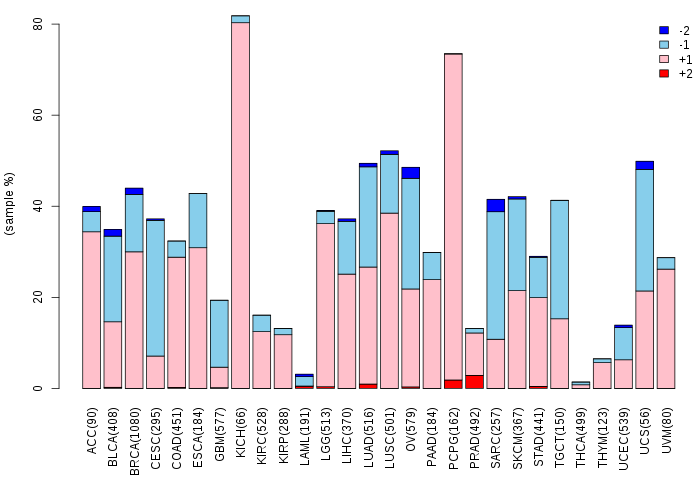
| Copy number variations of TissGene across 28 cancer types (X-axis: cancer type and Y-axis: % of CNV samples) (TCGA Gistic2_CopyNumber_Gistic2_all_data_by_genes, Gistic2 copy number data, version 2016-08-16) |
 |
| Top |
| TissGeneFusions for GLIPR1L2 |
| Fusion genes including TissGene (ChimerDB 3.0, 2016-12-01 and TCGA fusion Portal 2015-12-01) |
| Database | Src | Cancer type | Sample | Fusion gene | ORF | 5'-gene BP | 3'-gene BP |
| Top |
| TissGeneNet for GLIPR1L2 |
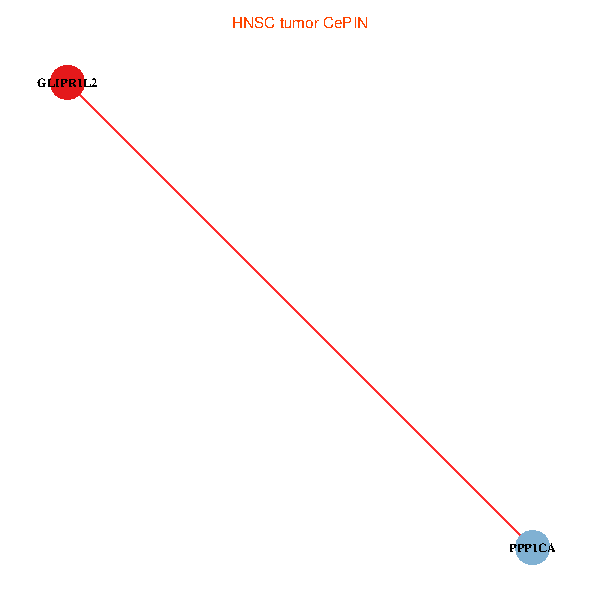
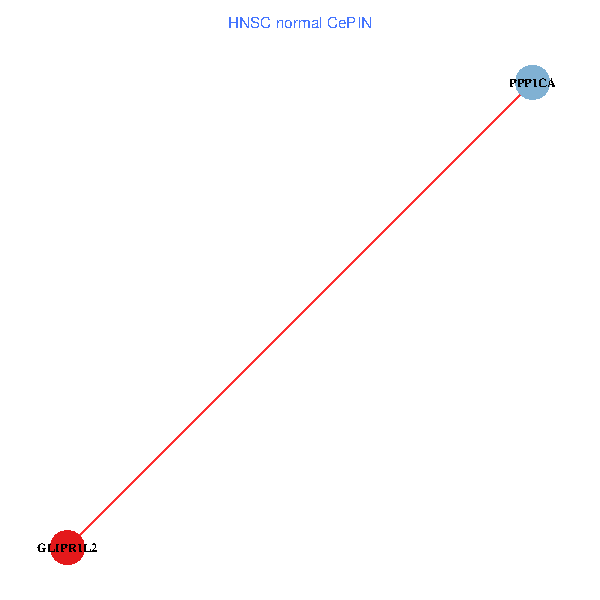
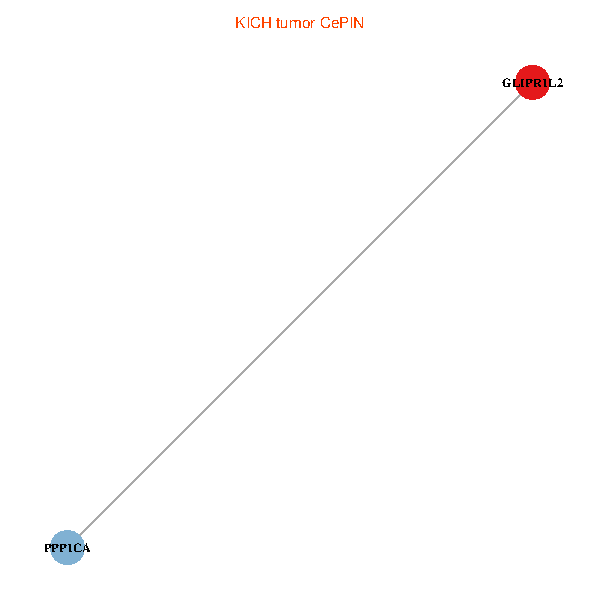
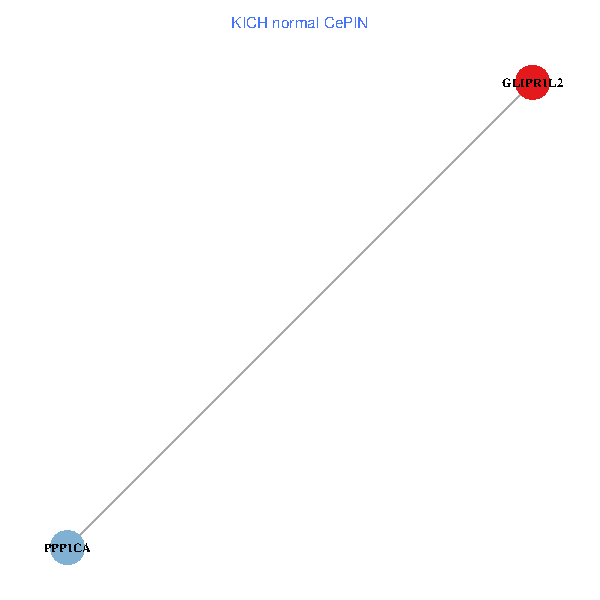
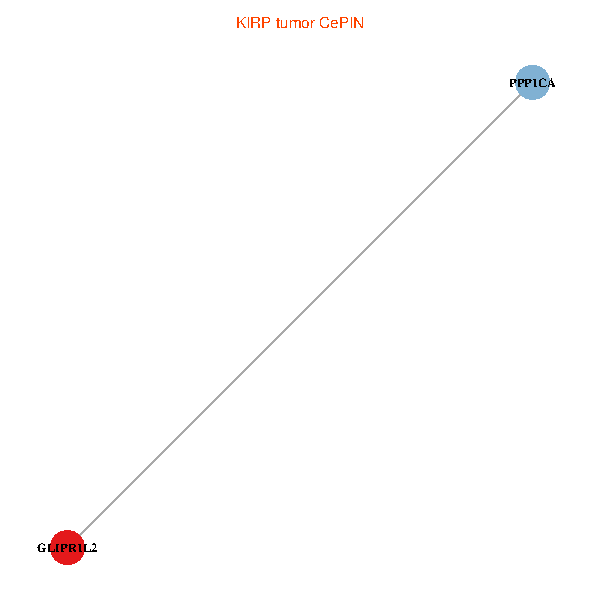
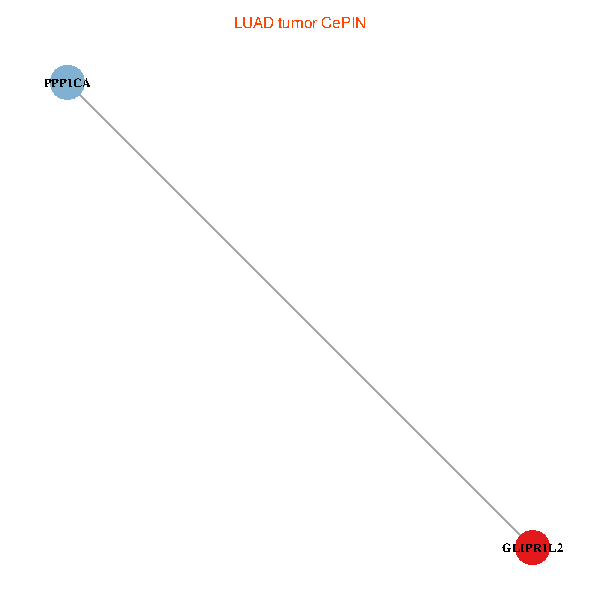
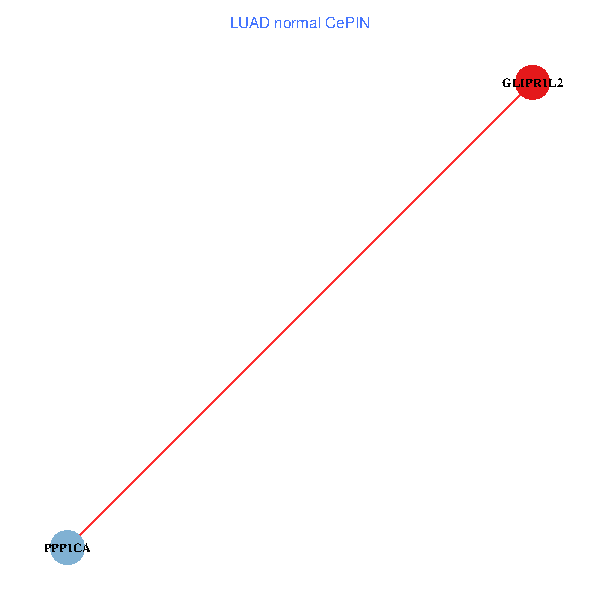
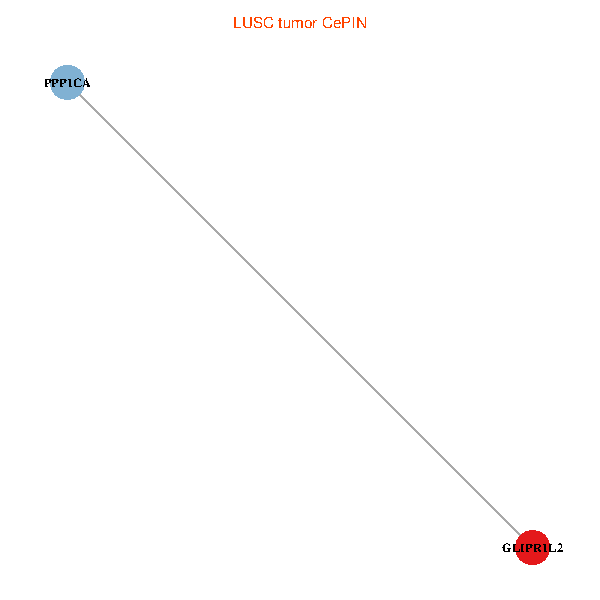
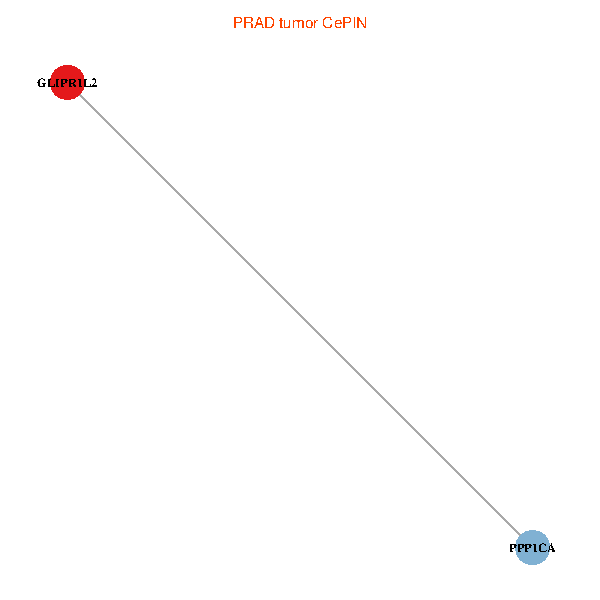
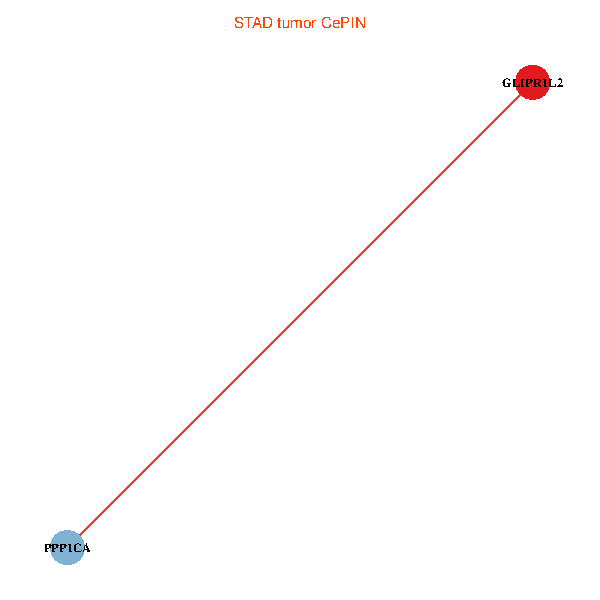
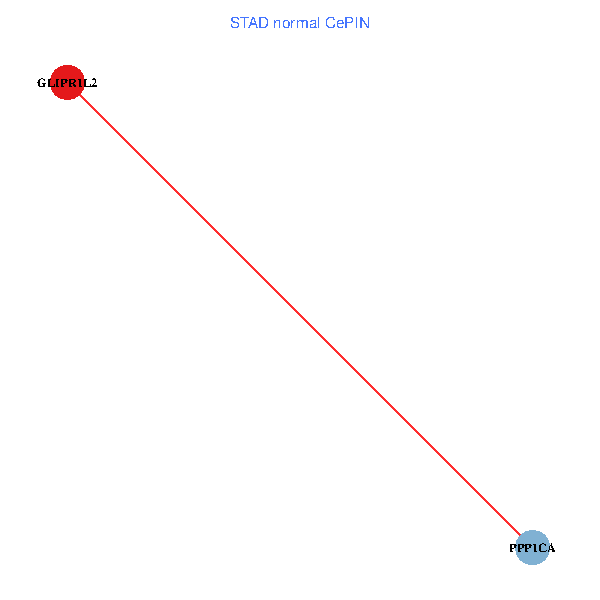
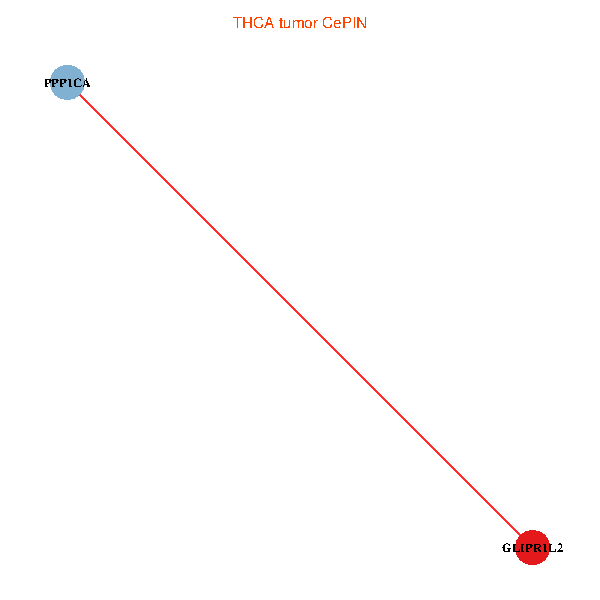
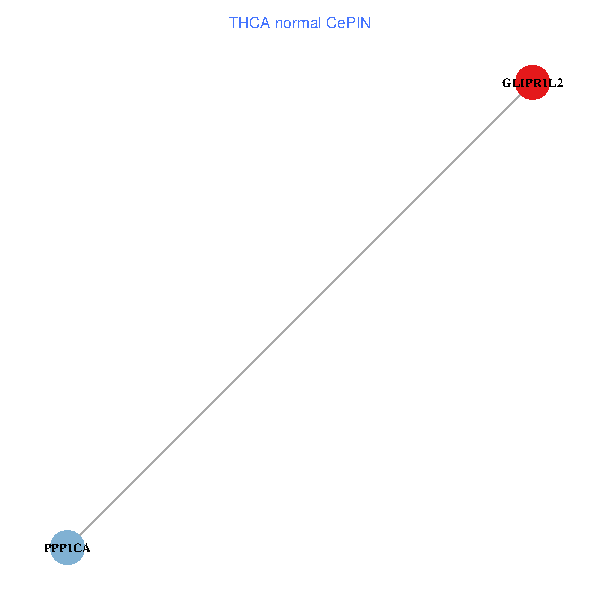
| Co-expressed gene networks based on protein-protein interaction data (CePIN) (TCGA IlluminaHiSeq_RNASeqV2, pan-cancer normalized log2(norm_counts+1) data, version 2016-08-16) (PINA2 ppi data) |
| BRCA (tumor) | BRCA (normal) |
| GLIPR1L2, PPP1CA (tumor) | GLIPR1L2, PPP1CA (normal) |
 |  |
| COAD (tumor) | COAD (normal) |
| GLIPR1L2, PPP1CA (tumor) | GLIPR1L2, PPP1CA (normal) |
 |  |
| HNSC (tumor) | HNSC (normal) |
| GLIPR1L2, PPP1CA (tumor) | GLIPR1L2, PPP1CA (normal) |
 |  |
| KICH (tumor) | KICH (normal) |
| GLIPR1L2, PPP1CA (tumor) | GLIPR1L2, PPP1CA (normal) |
 |  |
| KIRC (tumor) | KIRC (normal) |
| GLIPR1L2, PPP1CA (tumor) | GLIPR1L2, PPP1CA (normal) |
 |  |
| KIRP (tumor) | KIRP (normal) |
| GLIPR1L2, PPP1CA (tumor) | GLIPR1L2, PPP1CA (normal) |
 |  |
| LIHC (tumor) | LIHC (normal) |
| GLIPR1L2, PPP1CA (tumor) | GLIPR1L2, PPP1CA (normal) |
 |  |
| LUAD (tumor) | LUAD (normal) |
| GLIPR1L2, PPP1CA (tumor) | GLIPR1L2, PPP1CA (normal) |
 |  |
| LUSC (tumor) | LUSC (normal) |
| GLIPR1L2, PPP1CA (tumor) | GLIPR1L2, PPP1CA (normal) |
 |  |
| PRAD (tumor) | PRAD (normal) |
| GLIPR1L2, PPP1CA (tumor) | GLIPR1L2, PPP1CA (normal) |
 |  |
| STAD (tumor) | STAD (normal) |
| GLIPR1L2, PPP1CA (tumor) | GLIPR1L2, PPP1CA (normal) |
 |  |
| THCA (tumor) | THCA (normal) |
| GLIPR1L2, PPP1CA (tumor) | GLIPR1L2, PPP1CA (normal) |
 |  |
| Top |
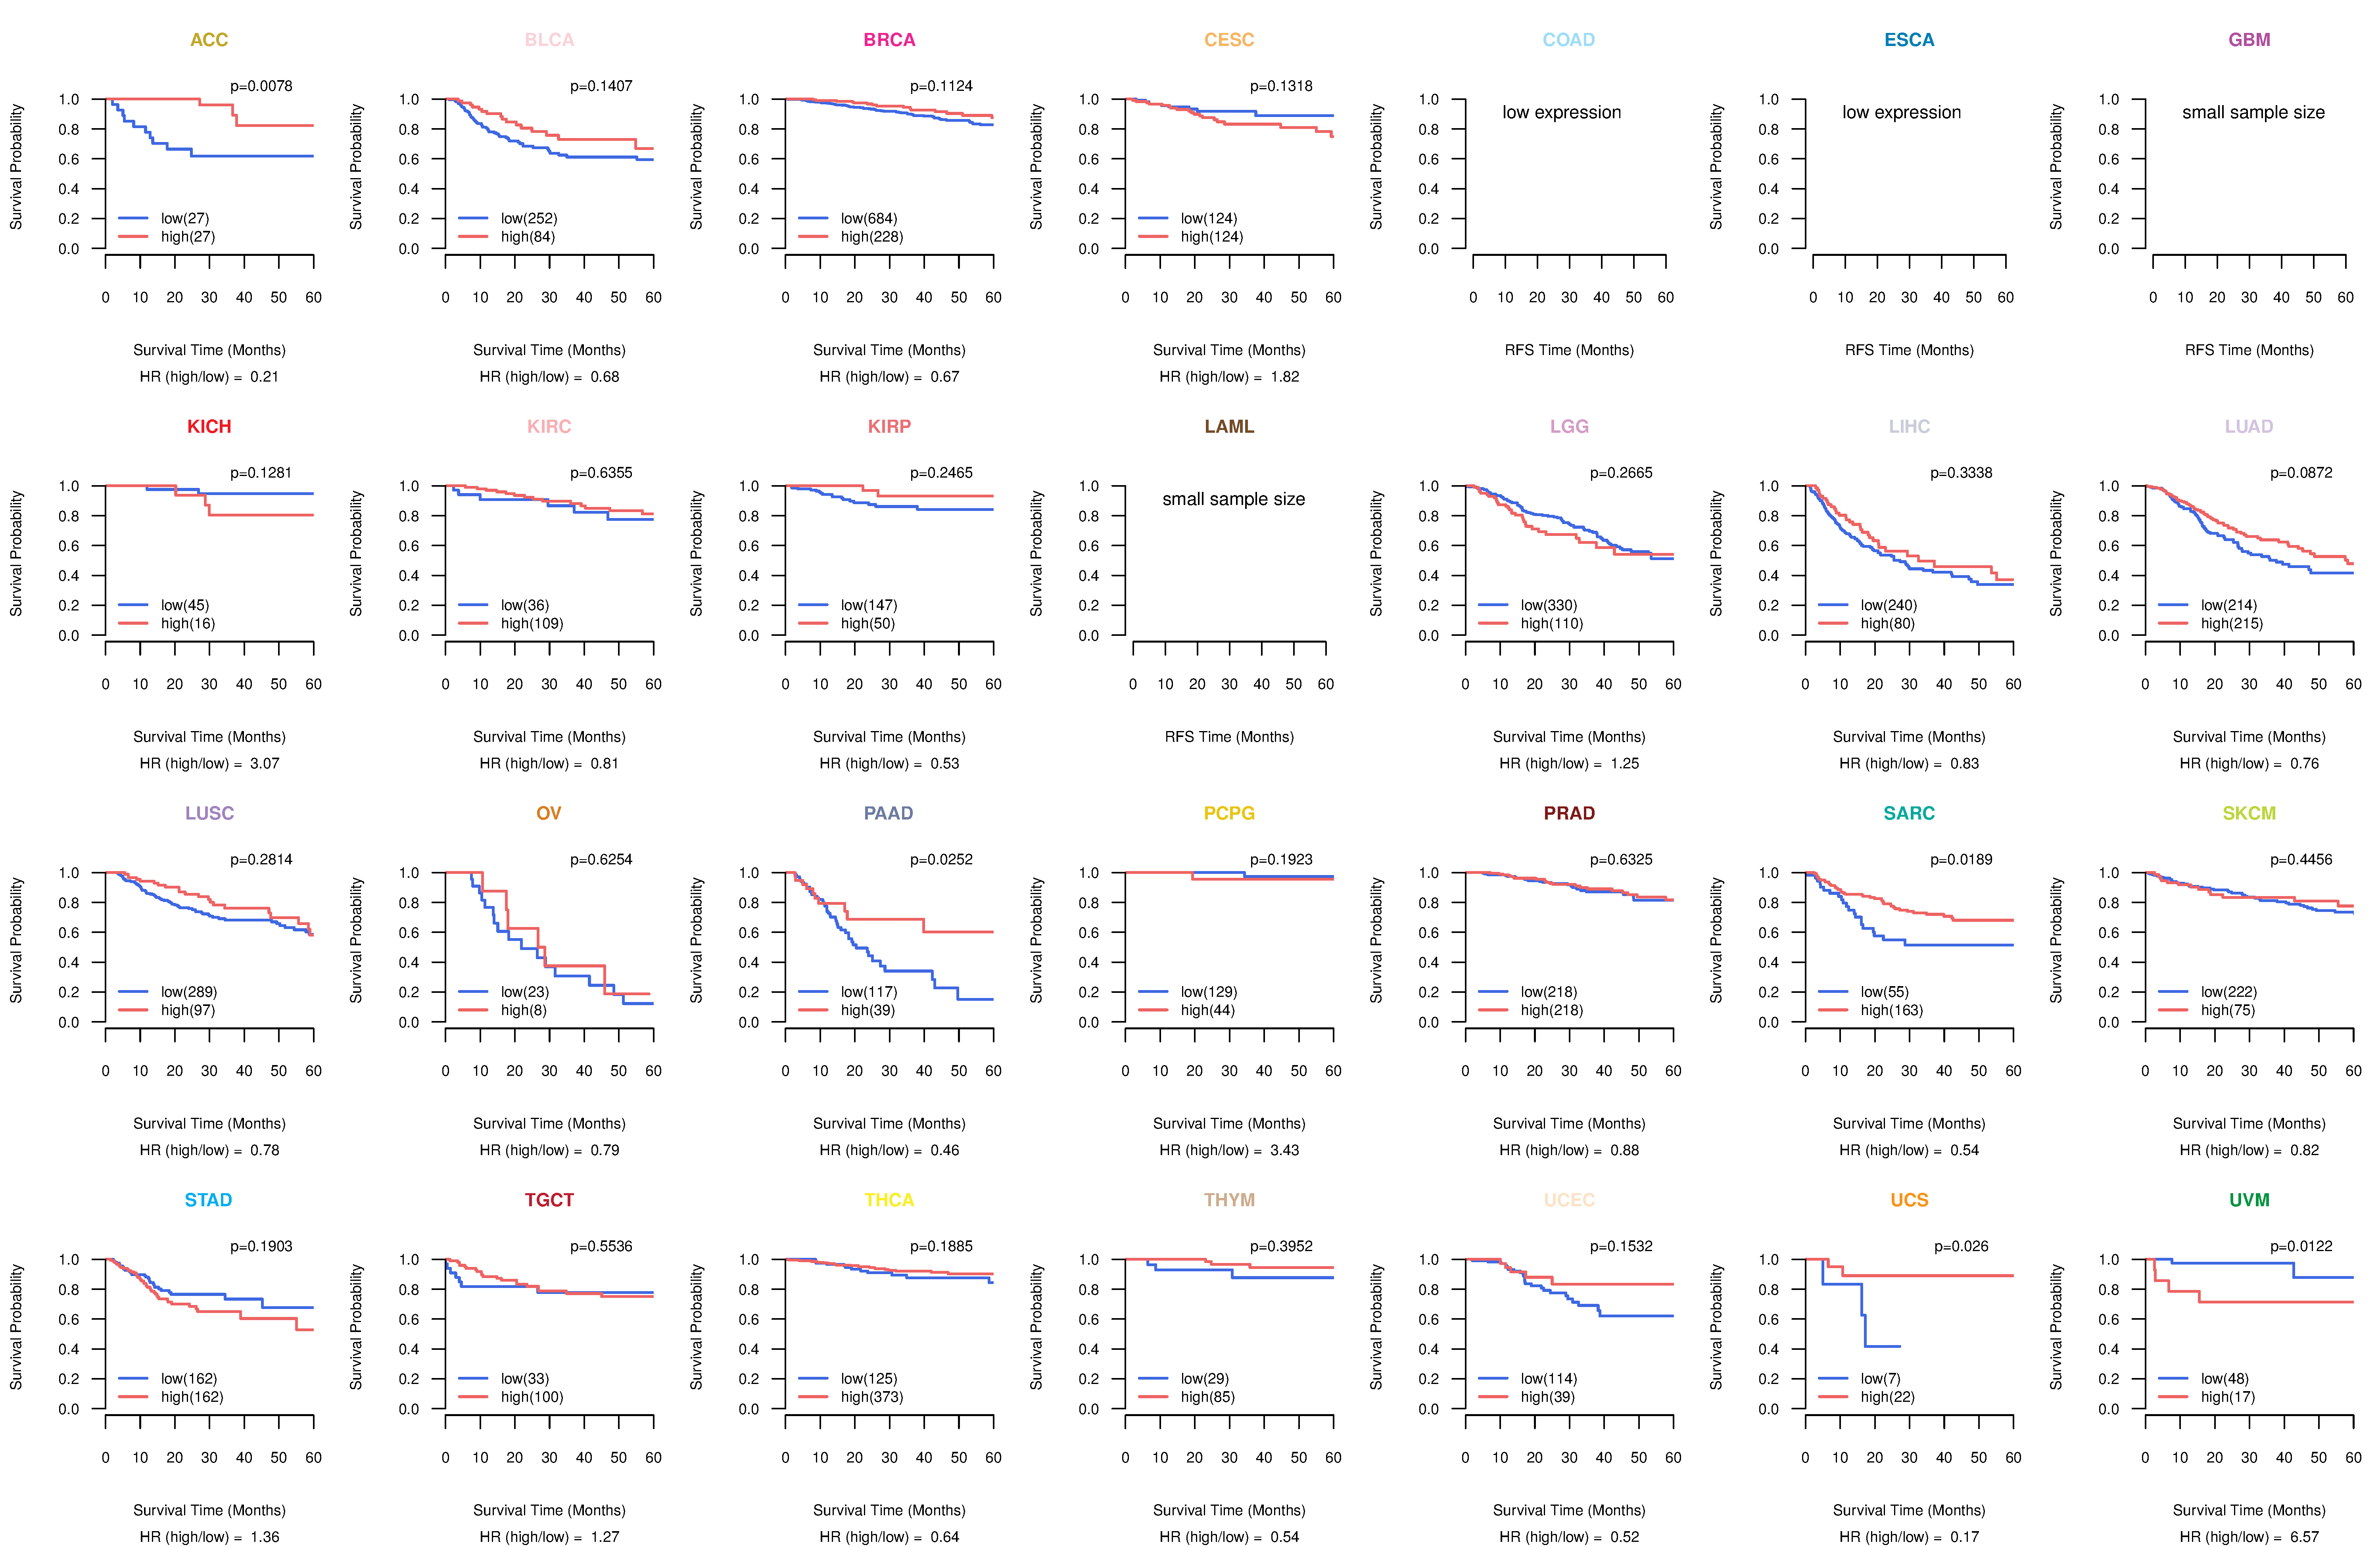
| TissGeneProg for GLIPR1L2 |
| Kaplan-Meier plots with logrank tests of overall survival (OS) using 28 cancer types (TCGA IlluminaHiSeq_RNASeqV2, pan-cancer normalized log2(norm_counts+1) data, version 2016-08-16) (TCGA clinicalMatrix, phenotype data, version 2016-04-27) * Click on the image to enlarge it in a new window. |
 |
| Kaplan-Meier plots with logrank test of relapse free survival (RFS) using 28 cancer types (TCGA IlluminaHiSeq_RNASeqV2, pan-cancer normalized log2(norm_counts+1) data, version 2016-08-16) (TCGA clinicalMatrix, phenotype data, version 2016-04-27) * Click on the image enlarge it in a new window. |
 |
| Forest plot of Cox proportional hazard ratio (HR) and 95% CI of overall survival (OS) using 28 cancer types (TCGA IlluminaHiSeq_RNASeqV2, pan-cancer normalized log2(norm_counts+1) data, version 2016-08-16) (TCGA clinicalMatrix, phenotype data, version 2016-04-27) * Click on the image enlarge it in a new window. |
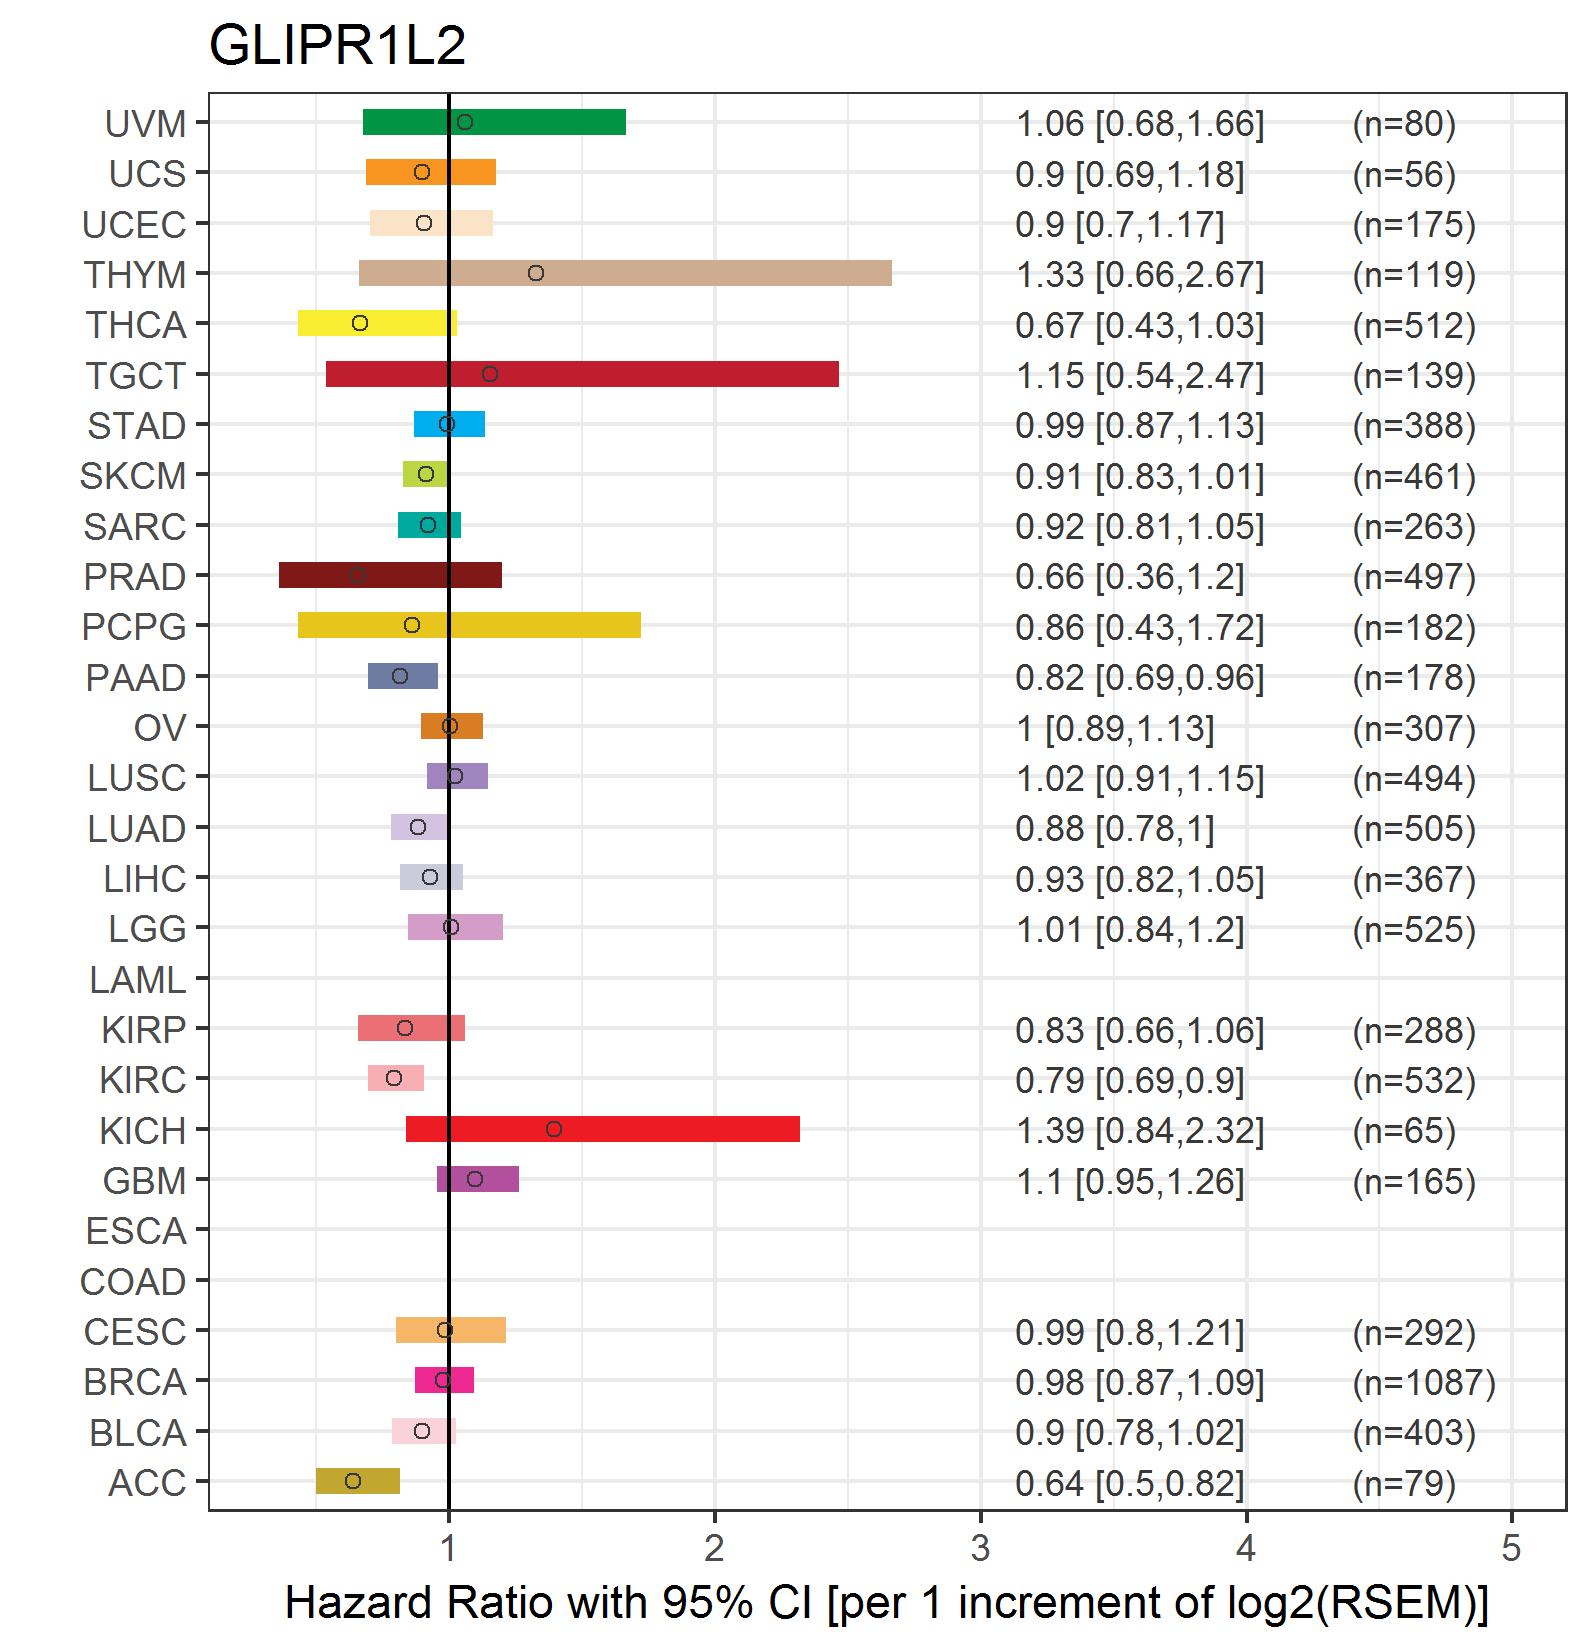 |
| Forest plot of Cox proportional hazard ratio (HR) and 95% CI of relapse free survival (RFS) using 28 cancer types (TCGA IlluminaHiSeq_RNASeqV2, pan-cancer normalized log2(norm_counts+1) data, version 2016-08-16) (TCGA clinicalMatrix, phenotype data, version 2016-04-27) * Click on the image enlarge it in a new window. |
 |
| Top |
| TissGeneClin for GLIPR1L2 |
| TissGeneDrug for GLIPR1L2 |
| Drug information targeting TissGene (DrugBank Version 5.0.6, 2017-04-01) |
| DrugBank ID | Drug name | Drug activity | Drug type | Drug status |
| Top |
| TissGeneDisease for GLIPR1L2 |
| Disease information associated with TissGene (DisGeNet, 2016-06-01) |
| Disease ID | Disease name | # pubmeds | Source |
|
Copyright 2016-Present - The University of Texas Health Science Center at Houston (UTHealth) Web File Viewing | How to Report, Fraud, Waste and Abuse | State of Texas | Statewide Search | Texas Homeland Security | Site Policies |