 |
| |
| |
| |
| |
| |
| |
|

| TissGeneSummary for A2ML1 |
 Gene summary Gene summary |
| Basic gene information | Gene symbol | A2ML1 |
| Gene name | alpha-2-macroglobulin-like 1 | |
| Synonyms | CPAMD9 | |
| Cytomap | UCSC genome browser: 12p13.31 | |
| Type of gene | protein-coding | |
| RefGenes | NM_001282424.1, NM_144670.4, | |
| Description | C3 and PZP-like, alpha-2-macroglobulin domain containing 9alpha-2-macroglobulin-like protein 1 | |
| Modification date | 20141207 | |
| dbXrefs | MIM : 610627 | |
| HGNC : HGNC | ||
| Ensembl : ENSG00000166535 | ||
| HPRD : 08684 | ||
| Vega : OTTHUMG00000128499 | ||
| Protein | UniProt: go to UniProt's Cross Reference DB Table | |
| Expression | CleanEX: HS_A2ML1 | |
| BioGPS: 144568 | ||
| Pathway | NCI Pathway Interaction Database: A2ML1 | |
| KEGG: A2ML1 | ||
| REACTOME: A2ML1 | ||
| Pathway Commons: A2ML1 | ||
| Context | iHOP: A2ML1 | |
| ligand binding site mutation search in PubMed: A2ML1 | ||
| UCL Cancer Institute: A2ML1 | ||
| Assigned class in TissGDB* | B | |
| Included tissue-specific gene expression resources | HPA,TiGER,GTEx | |
| Specific-tissues in normal samples (assigned by TissGDB using HPA, TiGER, and GTEx) | ColonEsophagus | |
| Cancer types related to the specific-tissues in cancer samples (assigned by TissGDB using TCGA) | COADESCA | |
| Reference showing the relevant tissue of A2ML1 | ||
| Description by TissGene annotations | ||
| * Class A consists of genes with literature evidence and is part of the cTissGenes. Class B consists of only cTissGenes without additional evidence. The remaining genes belong to Class C. |
| Gene ontology having evidence of Inferred from Direct Assay (IDA) from Entrez |
| GO ID | GO term | PubMed ID | GO:0052548 | regulation of endopeptidase activity | 16298998 | GO:0052548 | regulation of endopeptidase activity | 16298998 |
| Top |
| TissGeneExp for A2ML1 |
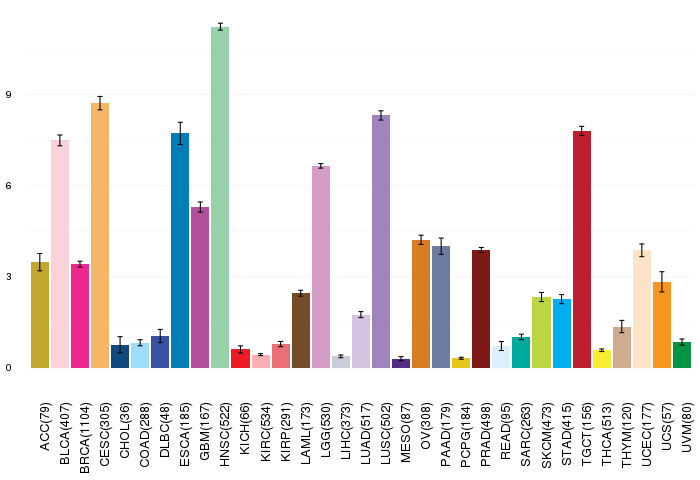
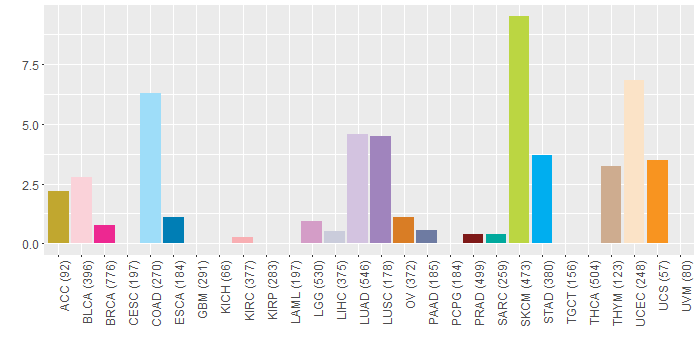
| Gene expressions across 28 cancer types (X-axis: cancer type and Y-axis: log2(norm_counts+1)) (TCGA IlluminaHiSeq_RNASeqV2, pan-cancer normalized log2(norm_counts+1) data, version 2016-08-16) |
 |
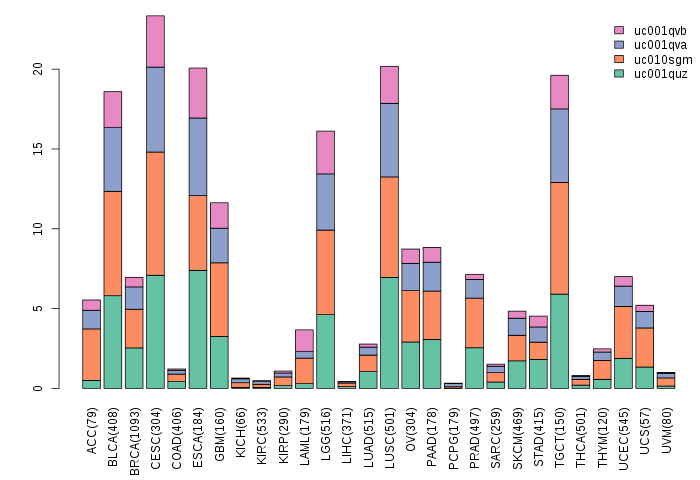
| Gene isoform expressions across 28 cancer types (X-axis: cancer type and Y-axis: log2(norm_counts+1)) (TCGA pan-cancer tcga_rsem_isoform_tpm, version 2016-09-01) |
 |
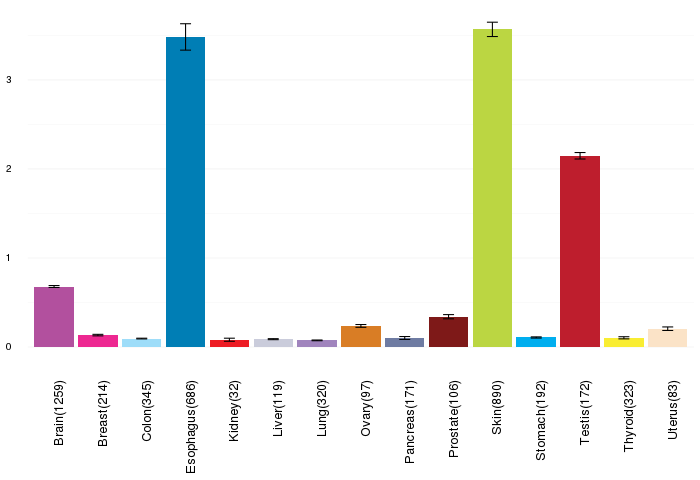
| Gene expressions across normal tissues of GTEx data (GTEx GTEx_Analysis_v6_RNA-seq_RNA-SeQCv1.1.8_gene_rpkm.gct) - Here, we shows the matched tissue types only among our 28 cancer types. |
 |
| Different expressions across 14 cancer types with more than 10 samples between matched tumors and normals (X-axis: cancer type and Y-axis: log2(norm_counts+1)) (TCGA IlluminaHiSeq_RNASeqV2, pan-cancer normalized log2(norm_counts+1) data, version 2016-08-16) |
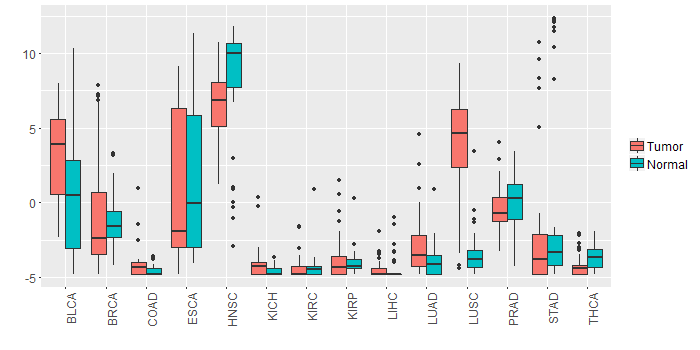 |
| - Significantly differentially expressed cancer types and information. (|Fold change|>1 and FDR<0.05) |
| Cancer type | Mean(exp) in tumor | Mean(exp) in matched normal | Log2FC | P-val. | FDR |
| LUSC | 4.044227905 | -3.54180935 | 7.586037255 | 3.67E-23 | 6.41E-22 |
| LUAD | -3.033228113 | -4.044083285 | 1.010855172 | 0.000442 | 0.001012672 |
| Top |
| TissGene-miRNA for A2ML1 |
| Significantly anti-correlated miRNAs of TissGene across 28 cancer types (Gene-miRNA relations from TargetScanHuman Relsease 7.1, Conserved_Site_Context_Scores.txt.zip, 06.01.2016) (TCGA IlluminaHiSeq_miRNASeq, log2(RPM+1) data, version 2016-11-21) (TCGA IlluminaHiSeq_RNASeqV2, log2(normalized_count+1) data, version 2016-08-16) (Spearman’s Rank Correlation (p-value<0.05 and coefficient<-0.25)) |
| Cancer type | miRNA id | miRNA accession | P-val. | Coeff. | # samples |
| Top |
| TissGeneMut for A2ML1 |
| TissGeneSNV for A2ML1 |
| nsSNV counts per each loci. Different colors of circles represent different cancer types. Circle size denotes number of samples. (TCGA somatic mutation (SNPs and small INDELs) data, version 2016-04-25) * Click on the image to enlarge it in a new window. |
 |
 |
| Somatic nucleotide variants of TissGene across 28 cancer types (X-axis: cancer type and Y-axis: % of mutated samples) The numbers in parentheses are numbers of samples with mutation (nsSNVs). (TCGA somatic mutation (SNPs and small INDELs) data, version 2016-04-25) |
 |
| - nsSNVs sorted by frequency. |
| AAchange | Cancer type | # samples |
| p.R807C | SKCM | 2 |
| p.R268Q | SKCM | 2 |
| p.M421I | SKCM | 2 |
| p.A925V | STAD | 1 |
| p.A481T | LUAD | 1 |
| p.Q1159K | LUAD | 1 |
| p.N1133S | SKCM | 1 |
| p.R1345* | OV | 1 |
| p.D1161Y | UCEC | 1 |
| p.S1127L | SKCM | 1 |
| p.W408X | SKCM | 1 |
| p.R1001Q | COAD | 1 |
| p.N166S | COAD | 1 |
| p.E18K | UCEC | 1 |
| p.D287E | COAD | 1 |
| p.P634L | SKCM | 1 |
| p.R893Q | SKCM | 1 |
| p.Q1305* | BLCA | 1 |
| p.R1001W | LUAD | 1 |
| p.P1295H | STAD | 1 |
| p.E835Q | ESCA | 1 |
| p.P743L | SKCM | 1 |
| p.S636C | BRCA | 1 |
| p.D423Y | UCEC | 1 |
| p.K110N | READ | 1 |
| p.Q436K | LUSC | 1 |
| p.R802H | LGG | 1 |
| p.S843F | SKCM | 1 |
| p.T523I | COAD | 1 |
| p.V1331E | UCEC | 1 |
| p.D1061A | PAAD | 1 |
| p.R364G | SKCM | 1 |
| p.A590V | LUAD | 1 |
| p.E109K | SKCM | 1 |
| p.T411A | UCEC | 1 |
| p.V594M | SKCM | 1 |
| p.V392I | SKCM | 1 |
| p.V413I | UCEC | 1 |
| p.V1222M | SKCM | 1 |
| p.F445L | STAD | 1 |
| p.S165I | THYM | 1 |
| p.T719N | LUAD | 1 |
| p.E190K | BRCA | 1 |
| p.E92X | COAD | 1 |
| p.S1361F | SKCM | 1 |
| p.S968N | SKCM | 1 |
| p.L1210M | COAD | 1 |
| p.E1260Q | LUAD | 1 |
| p.F790L | COAD | 1 |
| p.P85S | MESO | 1 |
| p.A956V | COAD | 1 |
| p.Q1049* | LUAD | 1 |
| p.Y308H | STAD | 1 |
| p.Y474X | SKCM | 1 |
| p.I1262M | HNSC | 1 |
| p.A1099V | PRAD | 1 |
| p.G614E | HNSC | 1 |
| p.P1295S | SKCM | 1 |
| p.R140H | THYM | 1 |
| p.K511* | BRCA | 1 |
| p.E735D | HNSC | 1 |
| p.R610C | STAD | 1 |
| p.R272W | SKCM | 1 |
| p.V1391L | HNSC | 1 |
| p.A751V | PAAD | 1 |
| p.E173K | SKCM | 1 |
| p.P1341Q | BLCA | 1 |
| p.D302Y | COAD | 1 |
| p.Y1298C | UCEC | 1 |
| p.D693Y | LUAD | 1 |
| p.E578Q | SKCM | 1 |
| p.W408* | SKCM | 1 |
| p.R443Q | UCEC | 1 |
| p.E202K | BLCA | 1 |
| p.A1077S | LUAD | 1 |
| p.E222K | BLCA | 1 |
| p.D1092Y | LUAD | 1 |
| p.G574* | UCEC | 1 |
| p.F1375L | LUAD | 1 |
| p.T913S | LUSC | 1 |
| p.S654L | UCEC | 1 |
| p.L1156F | READ | 1 |
| p.V224M | UCEC | 1 |
| p.L897I | UCEC | 1 |
| p.R893Q | UCEC | 1 |
| p.Q1413E | HNSC | 1 |
| p.T1197R | OV | 1 |
| p.S80F | SKCM | 1 |
| p.S1303L | SKCM | 1 |
| p.I380M | COAD | 1 |
| p.P1377A | BLCA | 1 |
| p.C970Y | COAD | 1 |
| p.Y474* | SKCM | 1 |
| p.D394N | COAD | 1 |
| p.Q116K | READ | 1 |
| p.Q561X | ACC | 1 |
| p.R807H | BLCA | 1 |
| p.L1428M | LIHC | 1 |
| p.W763S | BLCA | 1 |
| p.L738I | COAD | 1 |
| p.A329V | SKCM | 1 |
| p.S35F | LUAD | 1 |
| p.Q389K | LUAD | 1 |
| p.P743S | SKCM | 1 |
| p.P573L | LUAD | 1 |
| p.E57D | UCEC | 1 |
| p.G119E | SKCM | 1 |
| p.K923N | COAD | 1 |
| p.G1397R | SKCM | 1 |
| p.A481T | ACC | 1 |
| p.E19X | COAD | 1 |
| p.K1125N | UCEC | 1 |
| p.C970S | LUAD | 1 |
| p.S608R | LUSC | 1 |
| p.D480N | SKCM | 1 |
| p.P889S | LUAD | 1 |
| p.D145N | SKCM | 1 |
| p.R268* | SKCM | 1 |
| p.N1126H | COAD | 1 |
| p.E19* | PAAD | 1 |
| p.V861A | ESCA | 1 |
| p.R433H | BRCA | 1 |
| p.D473N | SKCM | 1 |
| p.G1357E | HNSC | 1 |
| p.M966I | UCEC | 1 |
| p.F139L | STAD | 1 |
| p.D531N | SKCM | 1 |
| p.E19X | PAAD | 1 |
| p.L303V | SKCM | 1 |
| p.S1280L | LGG | 1 |
| p.E1260K | LUSC | 1 |
| p.G382V | SARC | 1 |
| p.M298K | OV | 1 |
| p.S844R | STAD | 1 |
| p.L371F | SKCM | 1 |
| p.K239N | READ | 1 |
| p.E555K | UCEC | 1 |
| p.H456N | LUAD | 1 |
| p.V1394A | OV | 1 |
| p.T1299M | STAD | 1 |
| p.R272Q | COAD | 1 |
| p.W639R | LUAD | 1 |
| p.V1265F | PAAD | 1 |
| p.W408C | BRCA | 1 |
| p.Q958* | PAAD | 1 |
| p.P967R | LUSC | 1 |
| p.P86S | COAD | 1 |
| p.G100E | LGG | 1 |
| p.L1124F | BLCA | 1 |
| p.G119W | THYM | 1 |
| p.P712S | STAD | 1 |
| p.M144I | SKCM | 1 |
| p.Q561* | ACC | 1 |
| p.S829L | LIHC | 1 |
| p.Q170P | STAD | 1 |
| p.I646T | LGG | 1 |
| p.T1290S | LUAD | 1 |
| p.G1233E | LUAD | 1 |
| p.V1313M | SKCM | 1 |
| p.P176S | BLCA | 1 |
| p.M975T | THYM | 1 |
| p.R457W | LUAD | 1 |
| p.P1341L | BRCA | 1 |
| p.S498R | STAD | 1 |
| p.I240M | READ | 1 |
| p.N1154T | PRAD | 1 |
| p.N1182K | LUSC | 1 |
| p.V1394I | SKCM | 1 |
| p.L522R | BLCA | 1 |
| p.A1039V | UCEC | 1 |
| p.E1395K | SKCM | 1 |
| p.R657H | STAD | 1 |
| p.P638L | SKCM | 1 |
| p.D127N | SKCM | 1 |
| p.I1143V | LGG | 1 |
| p.R1029Q | UCEC | 1 |
| p.R802H | STAD | 1 |
| p.E629V | LUAD | 1 |
| p.T1219N | COAD | 1 |
| p.A1183T | PAAD | 1 |
| p.S718L | BLCA | 1 |
| p.M501I | SKCM | 1 |
| p.S829L | SKCM | 1 |
| p.G706S | SKCM | 1 |
| p.G1090D | STAD | 1 |
| p.E1407K | SKCM | 1 |
| p.P356S | SKCM | 1 |
| p.D876N | LUAD | 1 |
| p.K418R | KIRC | 1 |
| p.Q161H | UCEC | 1 |
| p.S526L | SKCM | 1 |
| p.N609S | SKCM | 1 |
| p.T853P | STAD | 1 |
| p.A1099V | UCEC | 1 |
| p.Y474N | LUAD | 1 |
| p.T1275A | LUAD | 1 |
| p.R268* | UCEC | 1 |
| p.Q430P | UCS | 1 |
| p.L534Q | LUAD | 1 |
| p.H722Y | COAD | 1 |
| p.A590V | STAD | 1 |
| p.G460D | UCS | 1 |
| p.N32H | UCEC | 1 |
| p.A1002S | THYM | 1 |
| p.K72E | HNSC | 1 |
| p.P617T | LUSC | 1 |
| p.C1307F | LUSC | 1 |
| Top |
| TissGeneCNV for A2ML1 |
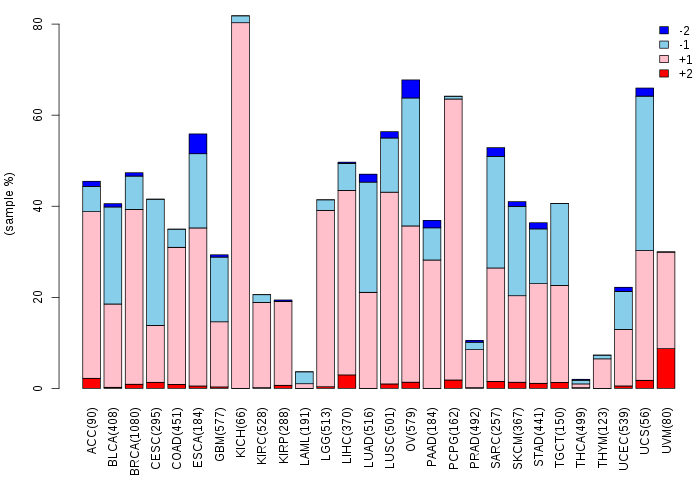
| Copy number variations of TissGene across 28 cancer types (X-axis: cancer type and Y-axis: % of CNV samples) (TCGA Gistic2_CopyNumber_Gistic2_all_data_by_genes, Gistic2 copy number data, version 2016-08-16) |
 |
| Top |
| TissGeneFusions for A2ML1 |
| Fusion genes including TissGene (ChimerDB 3.0, 2016-12-01 and TCGA fusion Portal 2015-12-01) |
| Database | Src | Cancer type | Sample | Fusion gene | ORF | 5'-gene BP | 3'-gene BP |
| Chimerdb3.0 | ChiTaRs | NA | BF088823 | CD163-A2ML1 | chr12:7651516 | chr12:9010636 | |
| Chimerdb3.0 | ChiTaRs | NA | BF832717 | A2ML1-SNX29 | chr12:8995787 | chr16:12119888 | |
| Chimerdb3.0 | FusionScan | HNSC | TCGA-QK-A6II-01A | A2ML1-RBM39 | In-Frame | chr12:8988262 | chr20:34301018 |
| Top |
| TissGeneNet for A2ML1 |
| Co-expressed gene networks based on protein-protein interaction data (CePIN) (TCGA IlluminaHiSeq_RNASeqV2, pan-cancer normalized log2(norm_counts+1) data, version 2016-08-16) (PINA2 ppi data) |
| Top |
| TissGeneProg for A2ML1 |
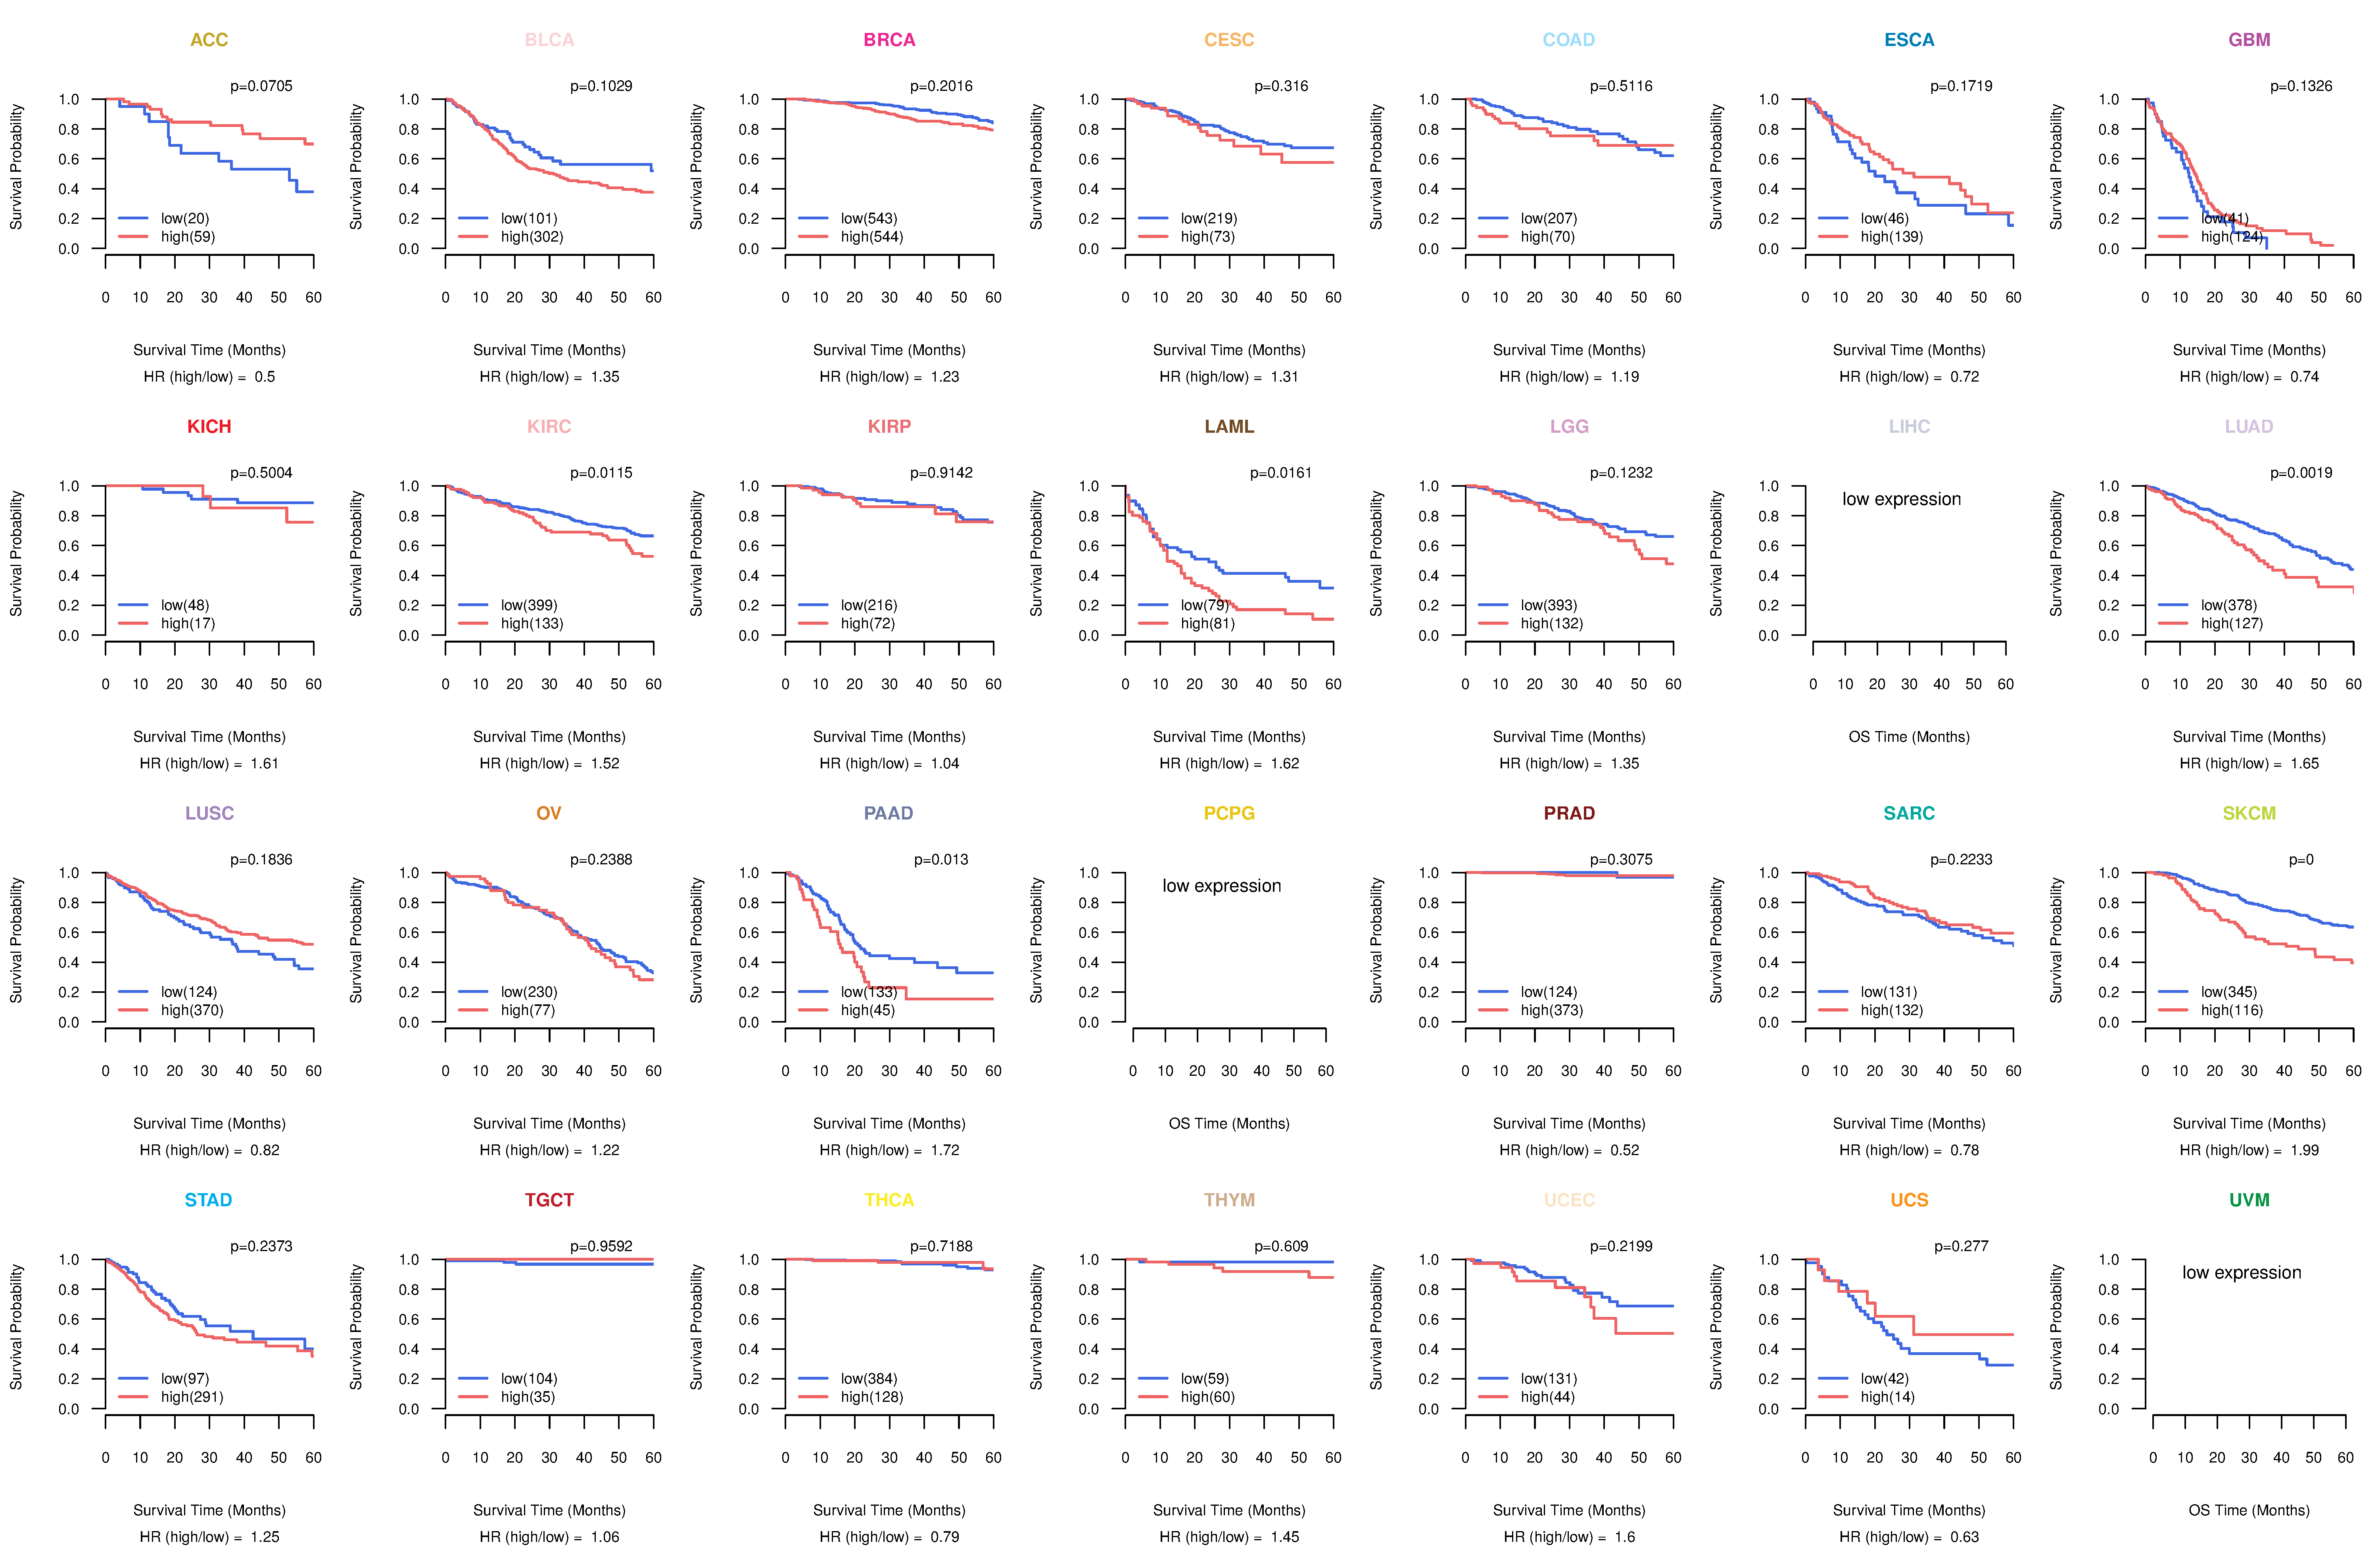
| Kaplan-Meier plots with logrank tests of overall survival (OS) using 28 cancer types (TCGA IlluminaHiSeq_RNASeqV2, pan-cancer normalized log2(norm_counts+1) data, version 2016-08-16) (TCGA clinicalMatrix, phenotype data, version 2016-04-27) * Click on the image to enlarge it in a new window. |
 |
| Kaplan-Meier plots with logrank test of relapse free survival (RFS) using 28 cancer types (TCGA IlluminaHiSeq_RNASeqV2, pan-cancer normalized log2(norm_counts+1) data, version 2016-08-16) (TCGA clinicalMatrix, phenotype data, version 2016-04-27) * Click on the image enlarge it in a new window. |
 |
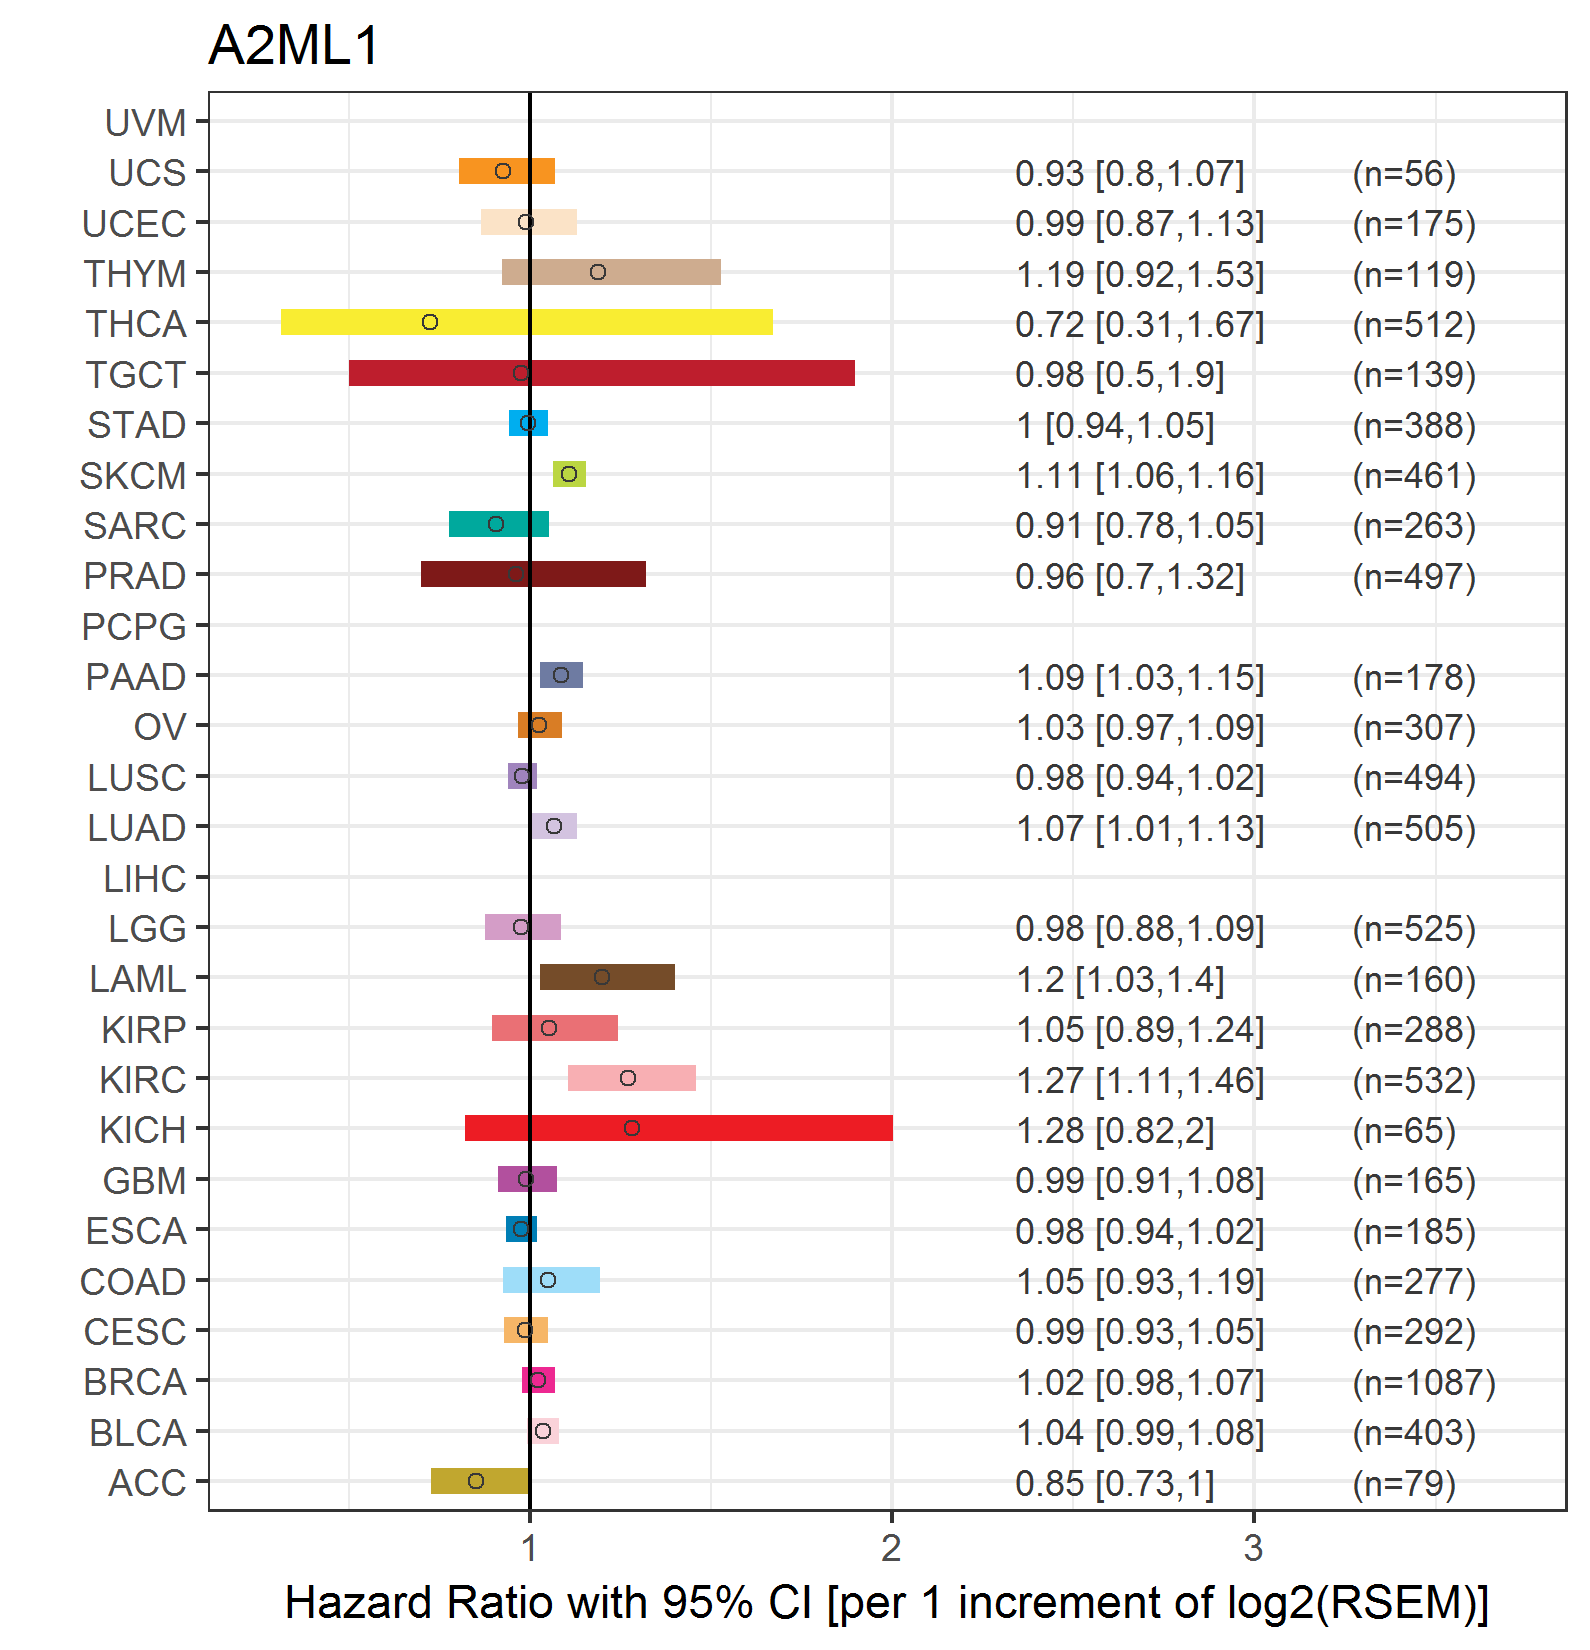
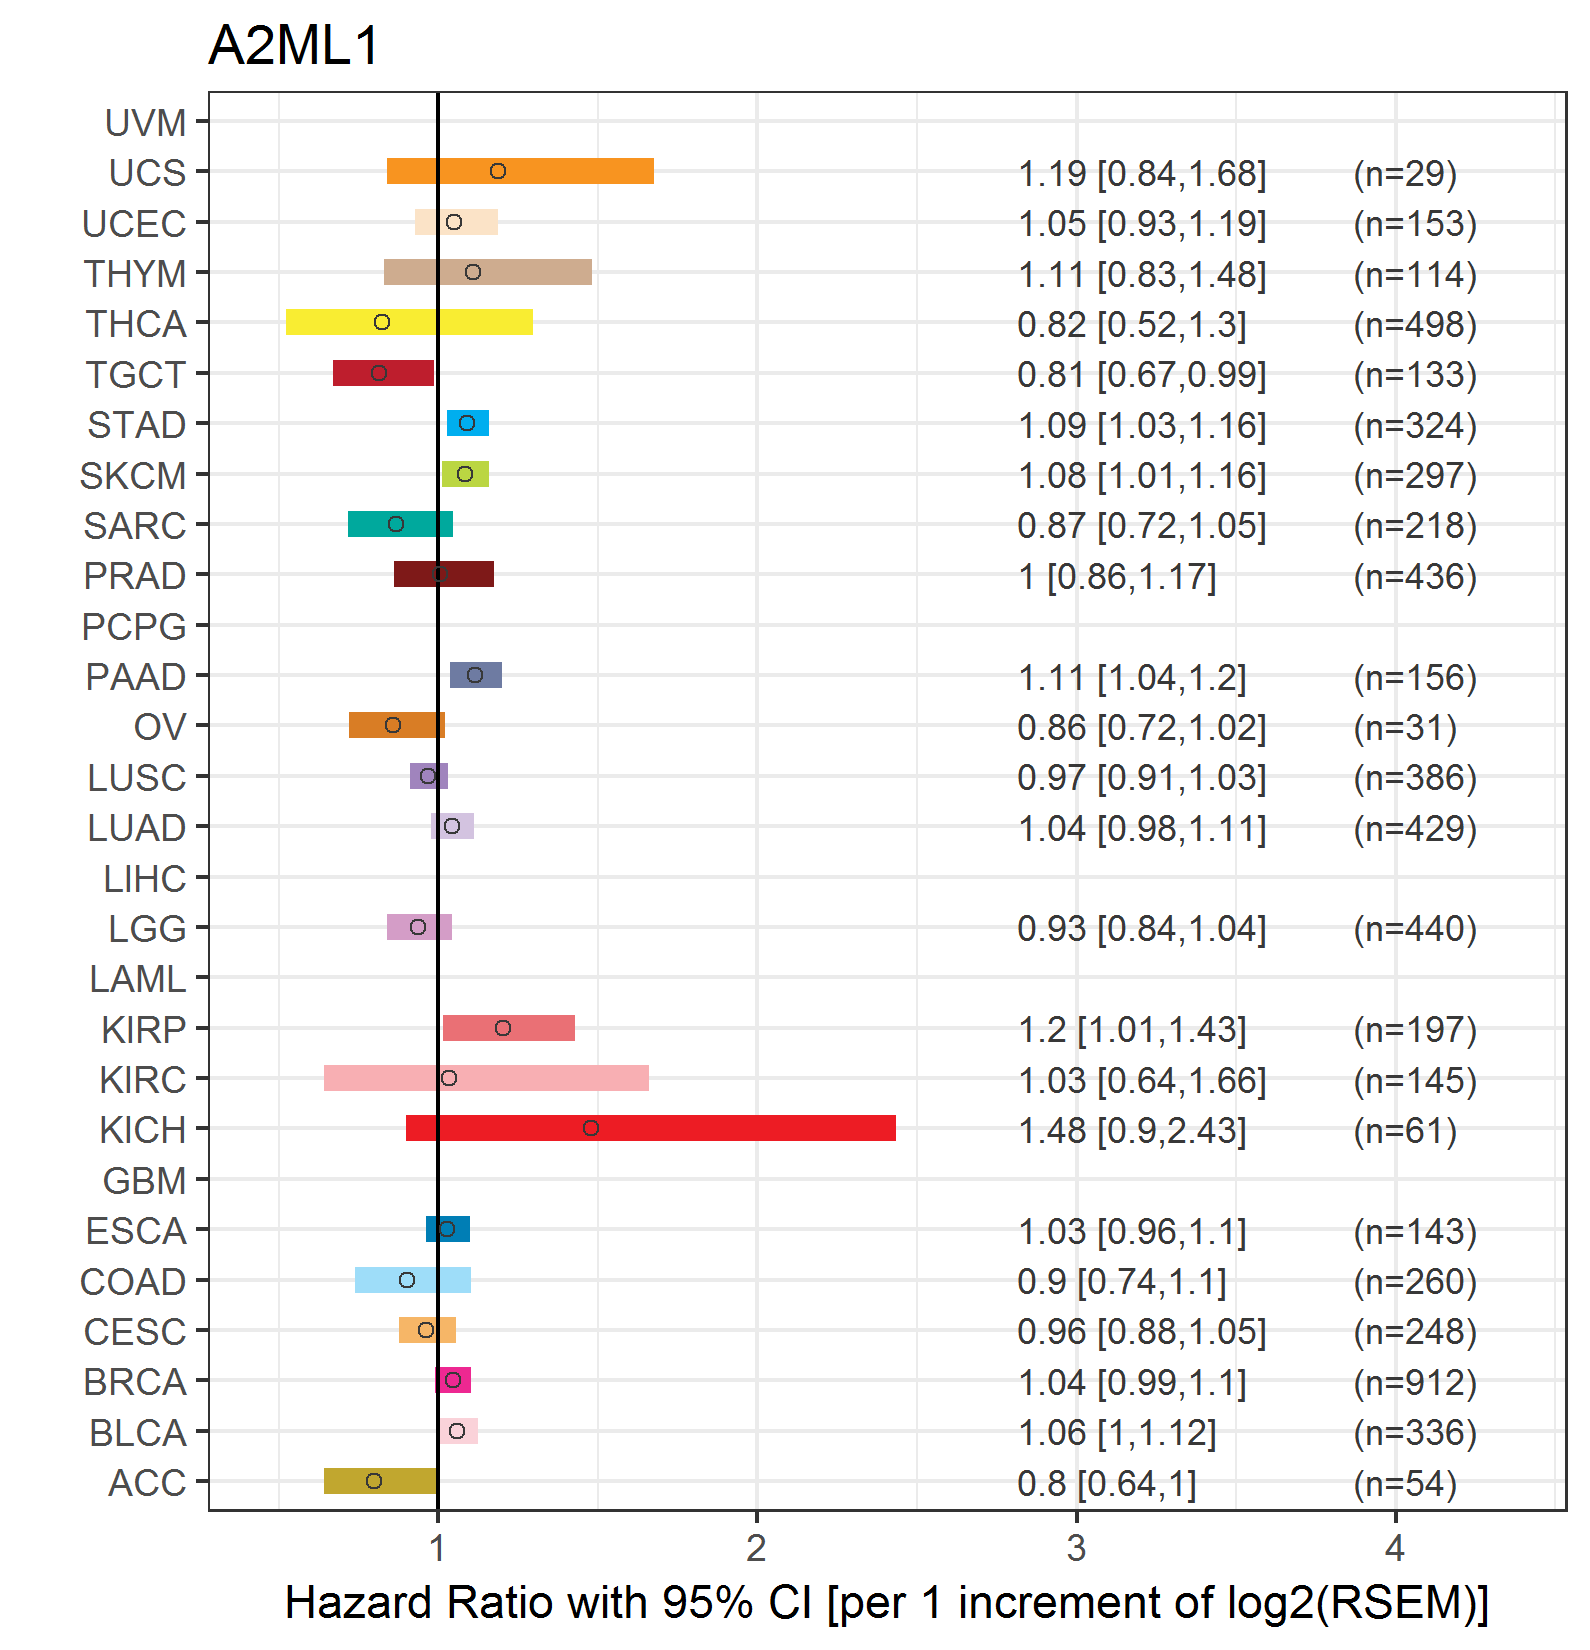
| Forest plot of Cox proportional hazard ratio (HR) and 95% CI of overall survival (OS) using 28 cancer types (TCGA IlluminaHiSeq_RNASeqV2, pan-cancer normalized log2(norm_counts+1) data, version 2016-08-16) (TCGA clinicalMatrix, phenotype data, version 2016-04-27) * Click on the image enlarge it in a new window. |
 |
| Forest plot of Cox proportional hazard ratio (HR) and 95% CI of relapse free survival (RFS) using 28 cancer types (TCGA IlluminaHiSeq_RNASeqV2, pan-cancer normalized log2(norm_counts+1) data, version 2016-08-16) (TCGA clinicalMatrix, phenotype data, version 2016-04-27) * Click on the image enlarge it in a new window. |
 |
| Top |
| TissGeneClin for A2ML1 |
| TissGeneDrug for A2ML1 |
| Drug information targeting TissGene (DrugBank Version 5.0.6, 2017-04-01) |
| DrugBank ID | Drug name | Drug activity | Drug type | Drug status |
| Top |
| TissGeneDisease for A2ML1 |
| Disease information associated with TissGene (DisGeNet, 2016-06-01) |
| Disease ID | Disease name | # pubmeds | Source |
| umls:C0002395 | Alzheimer's Disease | 1 | GAD |
| umls:C0029882 | Otitis Media | 1 | CTD_human |
| umls:C1112570 | Paraneoplastic pemphigus | 1 | BeFree |
| umls:C0028326 | Noonan Syndrome | 0 | ORPHANET |
|
Copyright 2016-Present - The University of Texas Health Science Center at Houston (UTHealth) Web File Viewing | How to Report, Fraud, Waste and Abuse | State of Texas | Statewide Search | Texas Homeland Security | Site Policies |