 |
| |
| |
| |
| |
| |
| |
|

| TissGeneSummary for RAD9B |
 Gene summary Gene summary |
| Basic gene information | Gene symbol | RAD9B |
| Gene name | RAD9 homolog B (S. pombe) | |
| Synonyms | - | |
| Cytomap | UCSC genome browser: 12q24.11 | |
| Type of gene | protein-coding | |
| RefGenes | NM_001286531.1, NM_001286532.1,NM_001286533.1,NM_001286534.1,NM_001286535.1, NM_001286536.1,NM_152442.3, | |
| Description | DNA repair exonuclease rad9 homolog Bcell cycle checkpoint control protein RAD9B | |
| Modification date | 20141207 | |
| dbXrefs | MIM : 608368 | |
| HGNC : HGNC | ||
| Ensembl : ENSG00000151164 | ||
| Vega : OTTHUMG00000152952 | ||
| Protein | UniProt: go to UniProt's Cross Reference DB Table | |
| Expression | CleanEX: HS_RAD9B | |
| BioGPS: 144715 | ||
| Pathway | NCI Pathway Interaction Database: RAD9B | |
| KEGG: RAD9B | ||
| REACTOME: RAD9B | ||
| Pathway Commons: RAD9B | ||
| Context | iHOP: RAD9B | |
| ligand binding site mutation search in PubMed: RAD9B | ||
| UCL Cancer Institute: RAD9B | ||
| Assigned class in TissGDB* | B | |
| Included tissue-specific gene expression resources | HPA,TiGER,GTEx | |
| Specific-tissues in normal samples (assigned by TissGDB using HPA, TiGER, and GTEx) | Testis | |
| Cancer types related to the specific-tissues in cancer samples (assigned by TissGDB using TCGA) | TGCT | |
| Reference showing the relevant tissue of RAD9B | ||
| Description by TissGene annotations | Cancer gene | |
| * Class A consists of genes with literature evidence and is part of the cTissGenes. Class B consists of only cTissGenes without additional evidence. The remaining genes belong to Class C. |
| Gene ontology having evidence of Inferred from Direct Assay (IDA) from Entrez |
| GO ID | GO term | PubMed ID |
| Top |
| TissGeneExp for RAD9B |
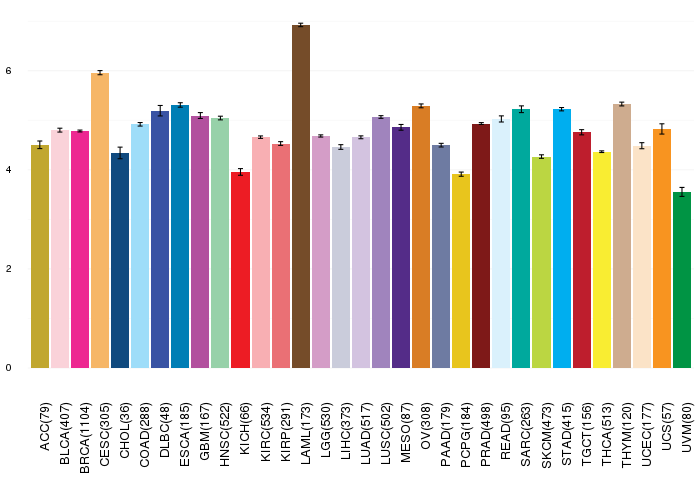
| Gene expressions across 28 cancer types (X-axis: cancer type and Y-axis: log2(norm_counts+1)) (TCGA IlluminaHiSeq_RNASeqV2, pan-cancer normalized log2(norm_counts+1) data, version 2016-08-16) |
 |
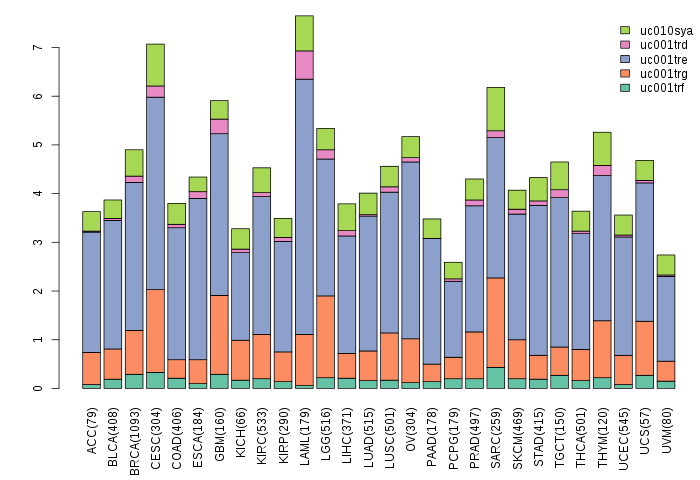
| Gene isoform expressions across 28 cancer types (X-axis: cancer type and Y-axis: log2(norm_counts+1)) (TCGA pan-cancer tcga_rsem_isoform_tpm, version 2016-09-01) |
 |
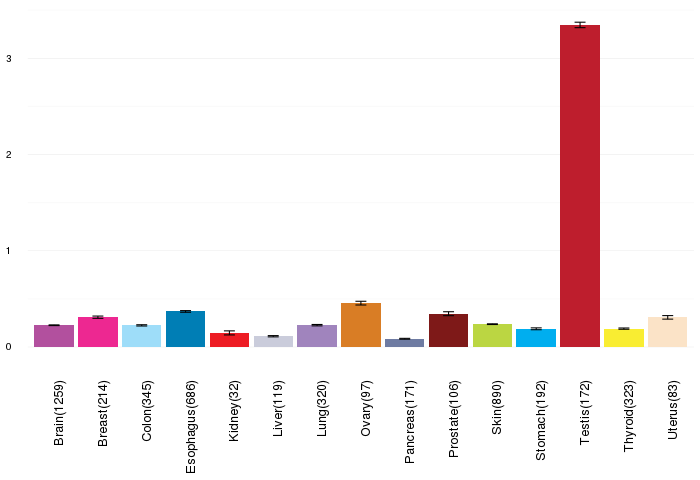
| Gene expressions across normal tissues of GTEx data (GTEx GTEx_Analysis_v6_RNA-seq_RNA-SeQCv1.1.8_gene_rpkm.gct) - Here, we shows the matched tissue types only among our 28 cancer types. |
 |
| Different expressions across 14 cancer types with more than 10 samples between matched tumors and normals (X-axis: cancer type and Y-axis: log2(norm_counts+1)) (TCGA IlluminaHiSeq_RNASeqV2, pan-cancer normalized log2(norm_counts+1) data, version 2016-08-16) |
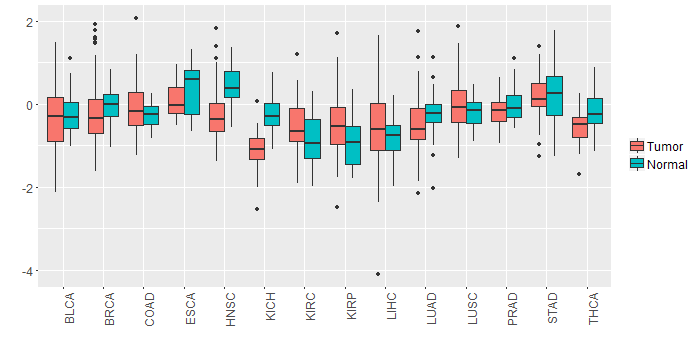 |
| - Significantly differentially expressed cancer types and information. (|Fold change|>1 and FDR<0.05) |
| Cancer type | Mean(exp) in tumor | Mean(exp) in matched normal | Log2FC | P-val. | FDR |
| Top |
| TissGene-miRNA for RAD9B |
| Significantly anti-correlated miRNAs of TissGene across 28 cancer types (Gene-miRNA relations from TargetScanHuman Relsease 7.1, Conserved_Site_Context_Scores.txt.zip, 06.01.2016) (TCGA IlluminaHiSeq_miRNASeq, log2(RPM+1) data, version 2016-11-21) (TCGA IlluminaHiSeq_RNASeqV2, log2(normalized_count+1) data, version 2016-08-16) (Spearman’s Rank Correlation (p-value<0.05 and coefficient<-0.25)) |
| Cancer type | miRNA id | miRNA accession | P-val. | Coeff. | # samples |
| Top |
| TissGeneMut for RAD9B |
| TissGeneSNV for RAD9B |
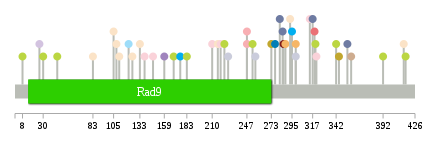
| nsSNV counts per each loci. Different colors of circles represent different cancer types. Circle size denotes number of samples. (TCGA somatic mutation (SNPs and small INDELs) data, version 2016-04-25) * Click on the image to enlarge it in a new window. |
 |
 |
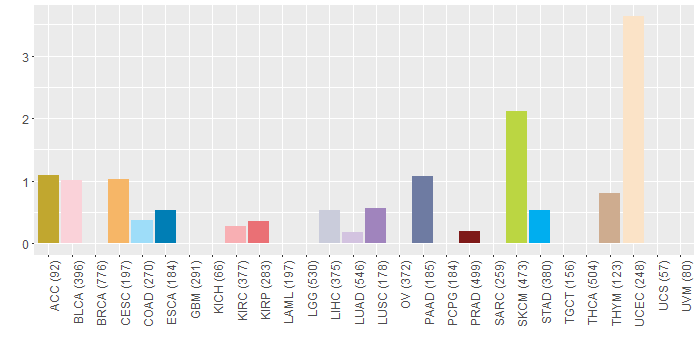
| Somatic nucleotide variants of TissGene across 28 cancer types (X-axis: cancer type and Y-axis: % of mutated samples) The numbers in parentheses are numbers of samples with mutation (nsSNVs). (TCGA somatic mutation (SNPs and small INDELs) data, version 2016-04-25) |
 |
| - nsSNVs sorted by frequency. |
| AAchange | Cancer type | # samples |
| p.Q219E | BLCA | 1 |
| p.R26G | LUAD | 1 |
| p.S282G | PAAD | 1 |
| p.R295* | STAD | 1 |
| p.A277S | ESCA | 1 |
| p.R105I | UCEC | 1 |
| p.Q176E | STAD | 1 |
| p.D45N | SKCM | 1 |
| p.D216H | UCEC | 1 |
| p.V210A | BLCA | 1 |
| p.Q293H | UCEC | 1 |
| p.F414L | UCEC | 1 |
| p.Q147E | BLCA | 1 |
| p.S30F | SKCM | 1 |
| p.F320L | SKCM | 1 |
| p.K256E | LIHC | 1 |
| p.H83Y | UCEC | 1 |
| p.S285G | PAAD | 1 |
| p.T8A | SKCM | 1 |
| p.F125L | UCEC | 1 |
| p.E358G | THYM | 1 |
| p.A273P | ACC | 1 |
| p.I317T | PAAD | 1 |
| p.G183E | SKCM | 1 |
| p.S354G | PAAD | 1 |
| p.K416R | SKCM | 1 |
| p.I247L | KIRC | 1 |
| p.I247R | KIRC | 1 |
| p.D299N | CESC | 1 |
| p.E286* | PRAD | 1 |
| p.A345P | ACC | 1 |
| p.D299N | LIHC | 1 |
| p.R223Q | SKCM | 1 |
| p.D227N | LIHC | 1 |
| p.M159I | LUSC | 1 |
| p.S314F | BLCA | 1 |
| p.V121L | COAD | 1 |
| p.P214R | HNSC | 1 |
| p.F392L | SKCM | 1 |
| p.S321F | BLCA | 1 |
| p.E169K | SKCM | 1 |
| p.E108* | UCEC | 1 |
| p.F342V | SKCM | 1 |
| p.R111I | UCEC | 1 |
| p.K319T | KIRP | 1 |
| p.V138A | BLCA | 1 |
| p.R133I | UCEC | 1 |
| p.S288L | CESC | 1 |
| p.R253K | SKCM | 1 |
| Top |
| TissGeneCNV for RAD9B |
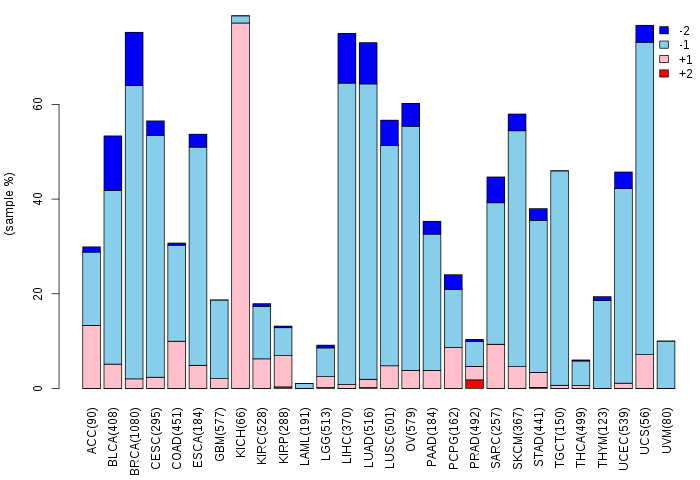
| Copy number variations of TissGene across 28 cancer types (X-axis: cancer type and Y-axis: % of CNV samples) (TCGA Gistic2_CopyNumber_Gistic2_all_data_by_genes, Gistic2 copy number data, version 2016-08-16) |
 |
| Top |
| TissGeneFusions for RAD9B |
| Fusion genes including TissGene (ChimerDB 3.0, 2016-12-01 and TCGA fusion Portal 2015-12-01) |
| Database | Src | Cancer type | Sample | Fusion gene | ORF | 5'-gene BP | 3'-gene BP |
| Chimerdb3.0 | ChiTaRs | NA | EL594131 | RAD9B-B2M | chr12:110954428 | chr15:45007661 |
| Top |
| TissGeneNet for RAD9B |
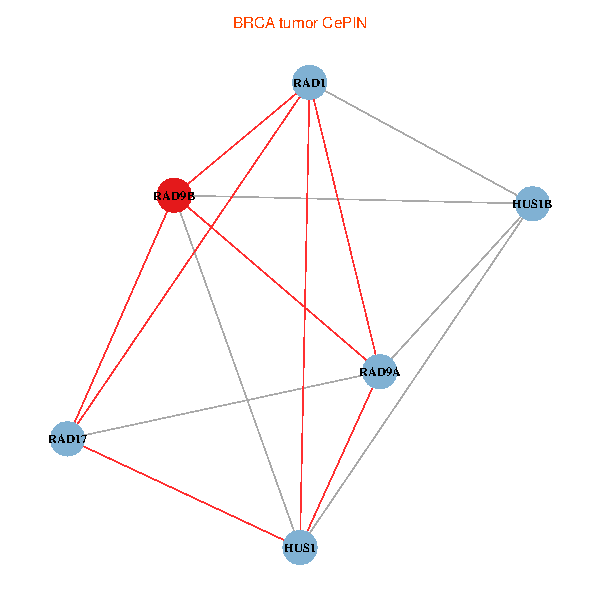
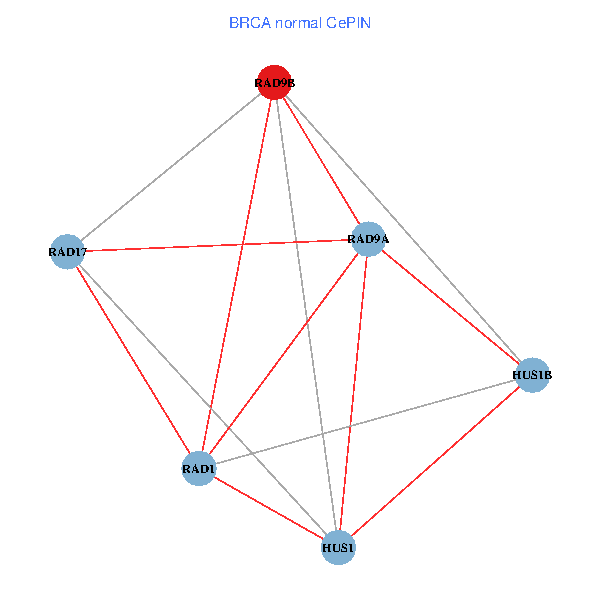
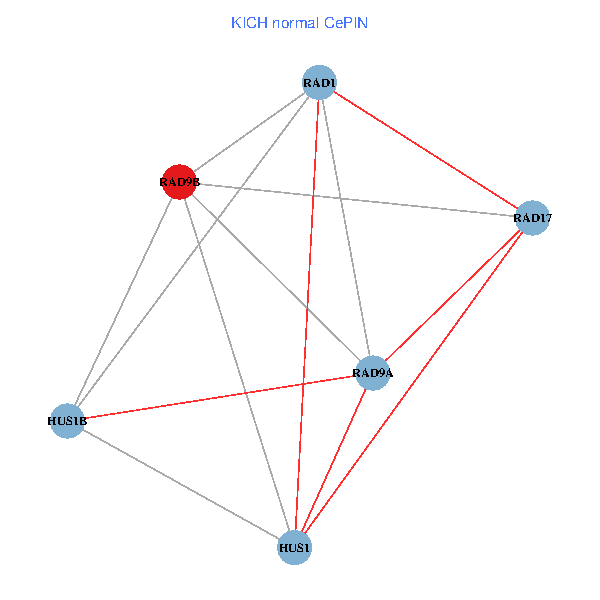
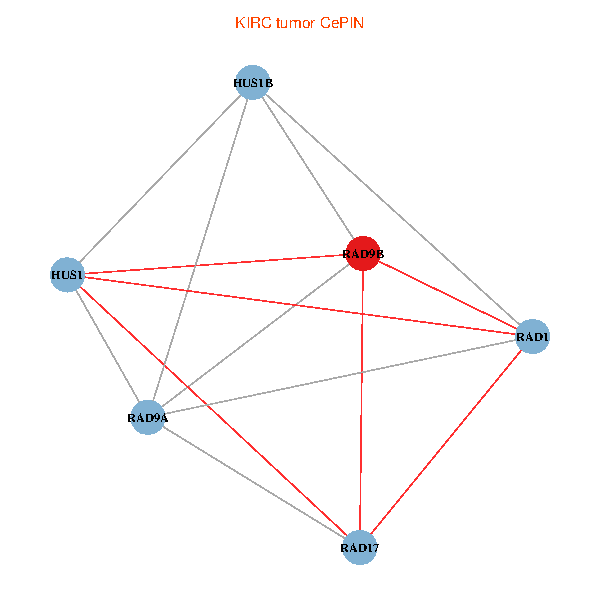
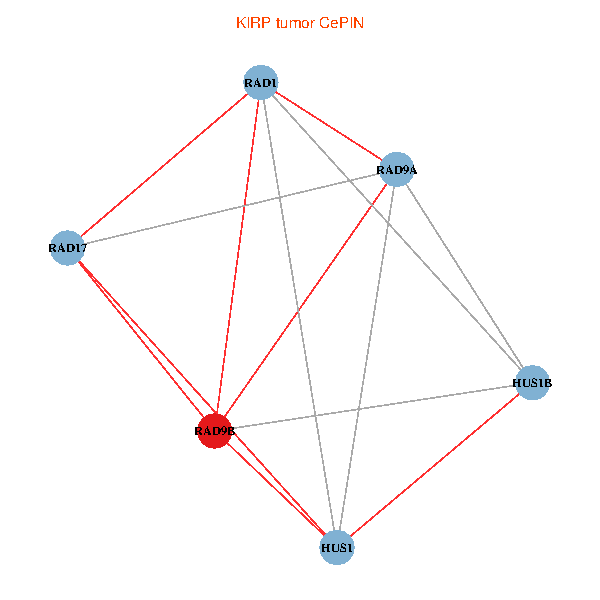
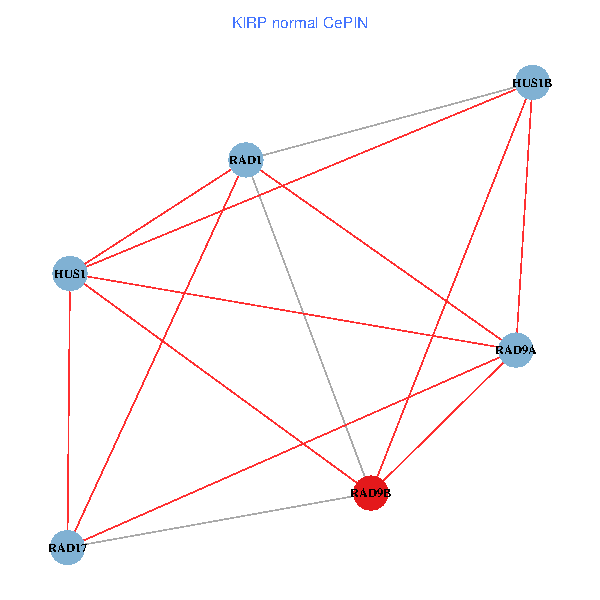
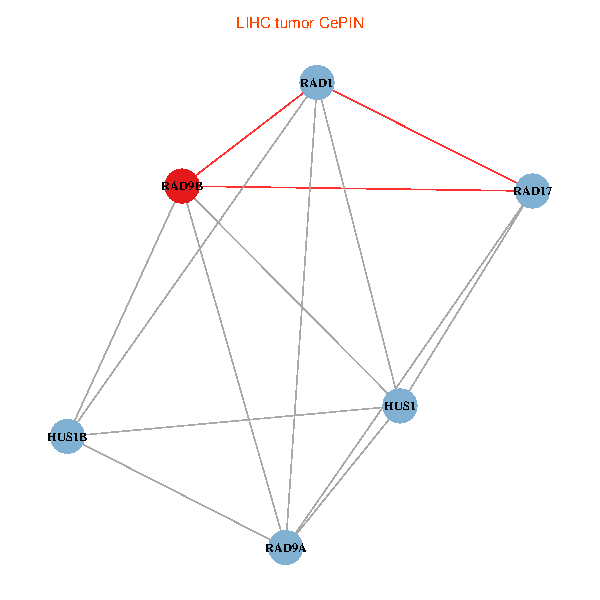
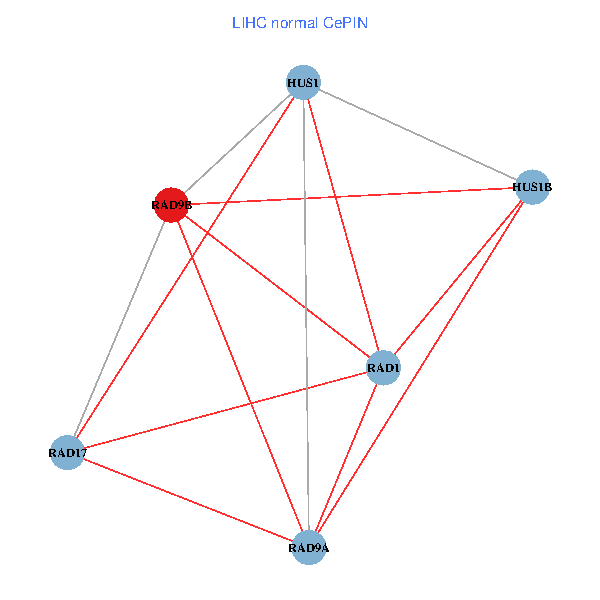
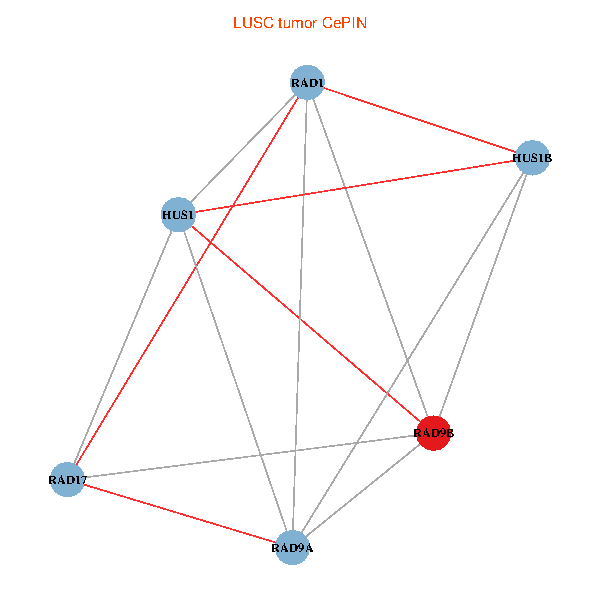
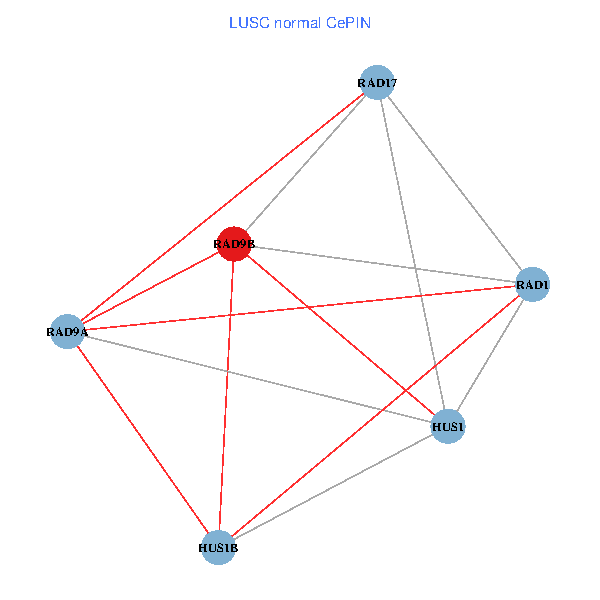
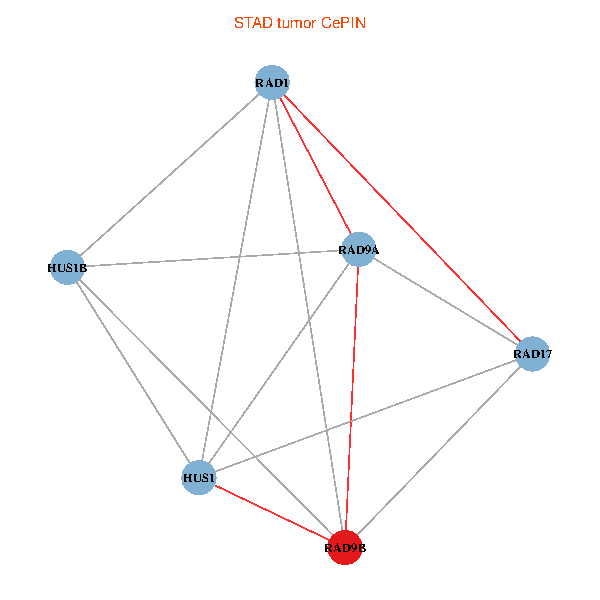
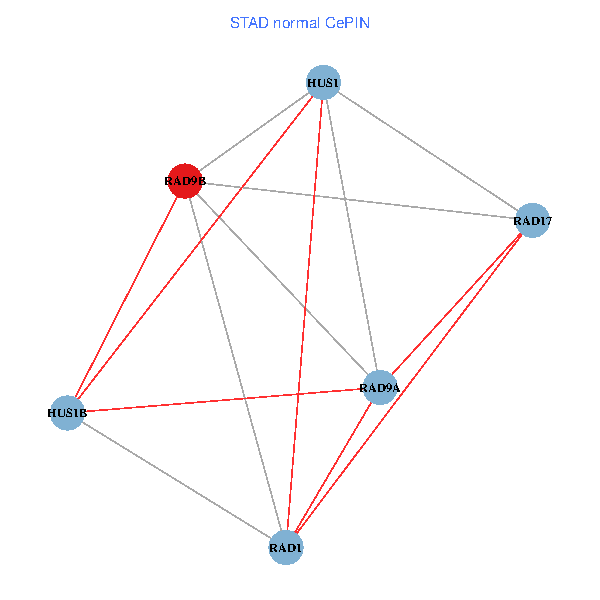
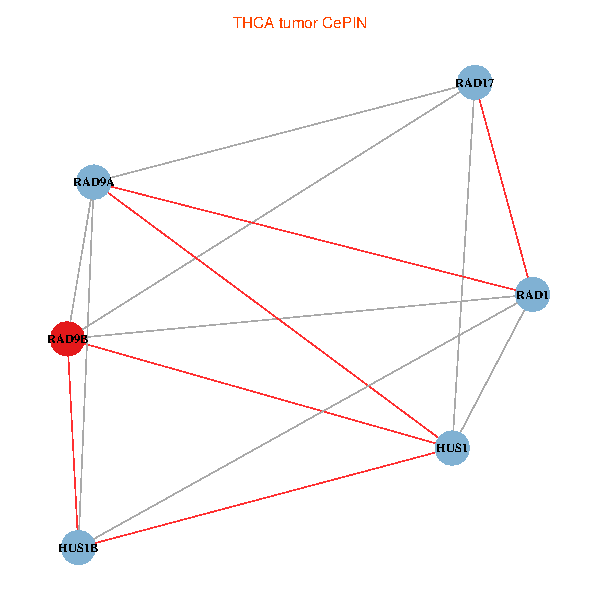
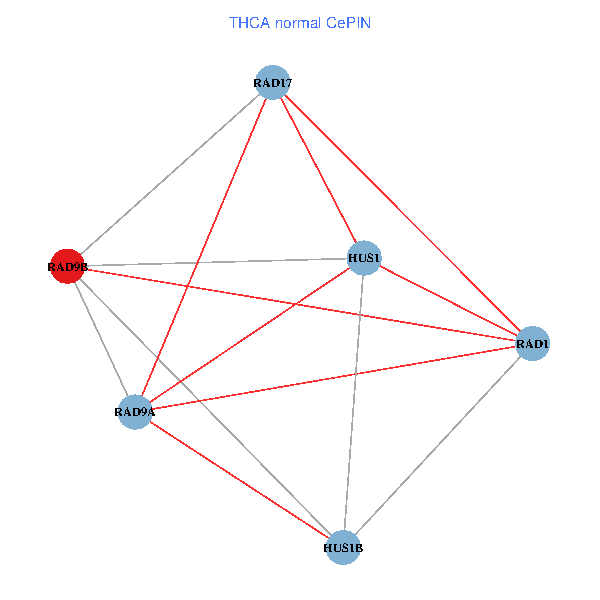
| Co-expressed gene networks based on protein-protein interaction data (CePIN) (TCGA IlluminaHiSeq_RNASeqV2, pan-cancer normalized log2(norm_counts+1) data, version 2016-08-16) (PINA2 ppi data) |
| BRCA (tumor) | BRCA (normal) |
| RAD9B, RAD17, RAD9A, HUS1, RAD1, HUS1B (tumor) | RAD9B, RAD17, RAD9A, HUS1, RAD1, HUS1B (normal) |
 |  |
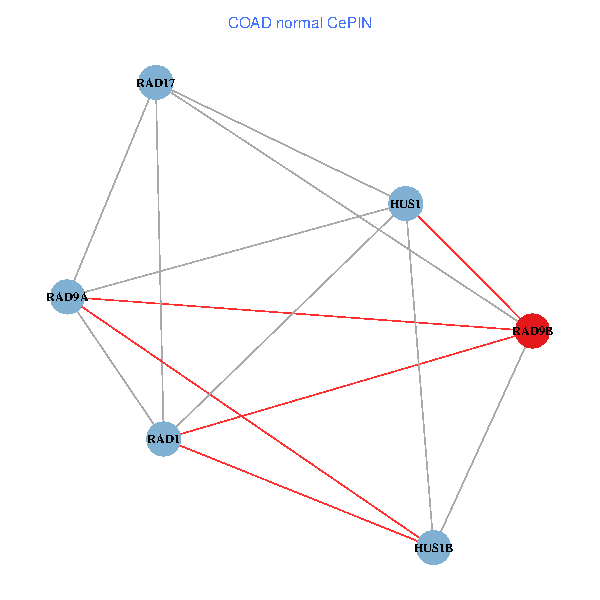
| COAD (tumor) | COAD (normal) |
| RAD9B, RAD17, RAD9A, HUS1, RAD1, HUS1B (tumor) | RAD9B, RAD17, RAD9A, HUS1, RAD1, HUS1B (normal) |
 |  |
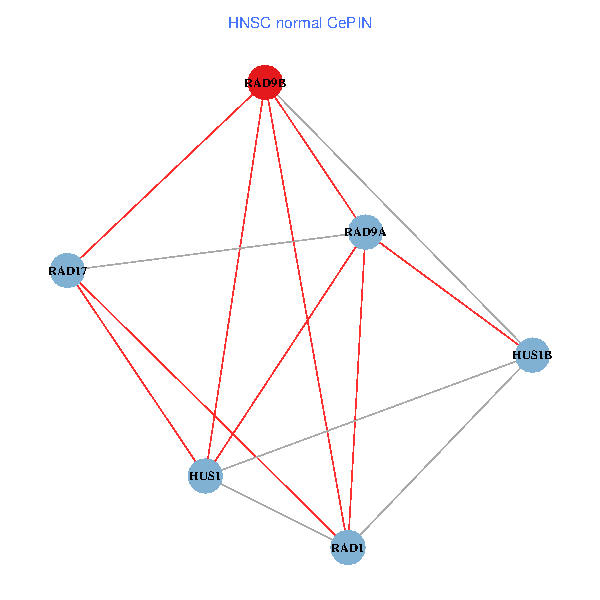
| HNSC (tumor) | HNSC (normal) |
| RAD9B, RAD17, RAD9A, HUS1, RAD1, HUS1B (tumor) | RAD9B, RAD17, RAD9A, HUS1, RAD1, HUS1B (normal) |
 |  |
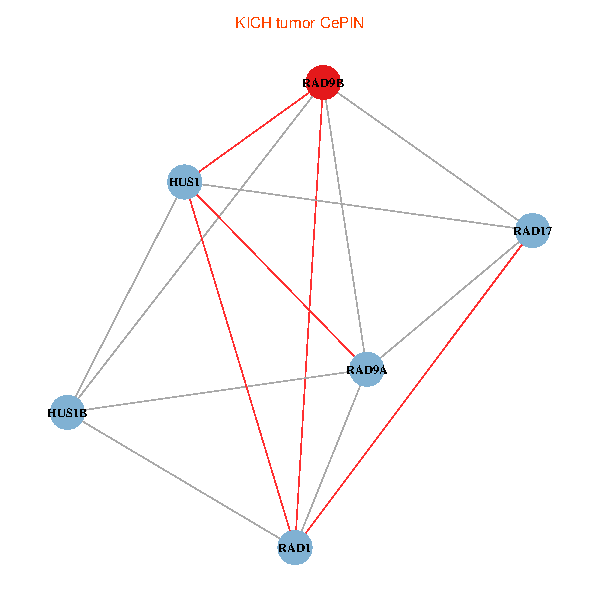
| KICH (tumor) | KICH (normal) |
| RAD9B, RAD17, RAD9A, HUS1, RAD1, HUS1B (tumor) | RAD9B, RAD17, RAD9A, HUS1, RAD1, HUS1B (normal) |
 |  |
| KIRC (tumor) | KIRC (normal) |
| RAD9B, RAD17, RAD9A, HUS1, RAD1, HUS1B (tumor) | RAD9B, RAD17, RAD9A, HUS1, RAD1, HUS1B (normal) |
 |  |
| KIRP (tumor) | KIRP (normal) |
| RAD9B, RAD17, RAD9A, HUS1, RAD1, HUS1B (tumor) | RAD9B, RAD17, RAD9A, HUS1, RAD1, HUS1B (normal) |
 |  |
| LIHC (tumor) | LIHC (normal) |
| RAD9B, RAD17, RAD9A, HUS1, RAD1, HUS1B (tumor) | RAD9B, RAD17, RAD9A, HUS1, RAD1, HUS1B (normal) |
 |  |
| LUAD (tumor) | LUAD (normal) |
| RAD9B, RAD17, RAD9A, HUS1, RAD1, HUS1B (tumor) | RAD9B, RAD17, RAD9A, HUS1, RAD1, HUS1B (normal) |
 |  |
| LUSC (tumor) | LUSC (normal) |
| RAD9B, RAD17, RAD9A, HUS1, RAD1, HUS1B (tumor) | RAD9B, RAD17, RAD9A, HUS1, RAD1, HUS1B (normal) |
 |  |
| PRAD (tumor) | PRAD (normal) |
| RAD9B, RAD17, RAD9A, HUS1, RAD1, HUS1B (tumor) | RAD9B, RAD17, RAD9A, HUS1, RAD1, HUS1B (normal) |
 |  |
| STAD (tumor) | STAD (normal) |
| RAD9B, RAD17, RAD9A, HUS1, RAD1, HUS1B (tumor) | RAD9B, RAD17, RAD9A, HUS1, RAD1, HUS1B (normal) |
 |  |
| THCA (tumor) | THCA (normal) |
| RAD9B, RAD17, RAD9A, HUS1, RAD1, HUS1B (tumor) | RAD9B, RAD17, RAD9A, HUS1, RAD1, HUS1B (normal) |
 |  |
| Top |
| TissGeneProg for RAD9B |
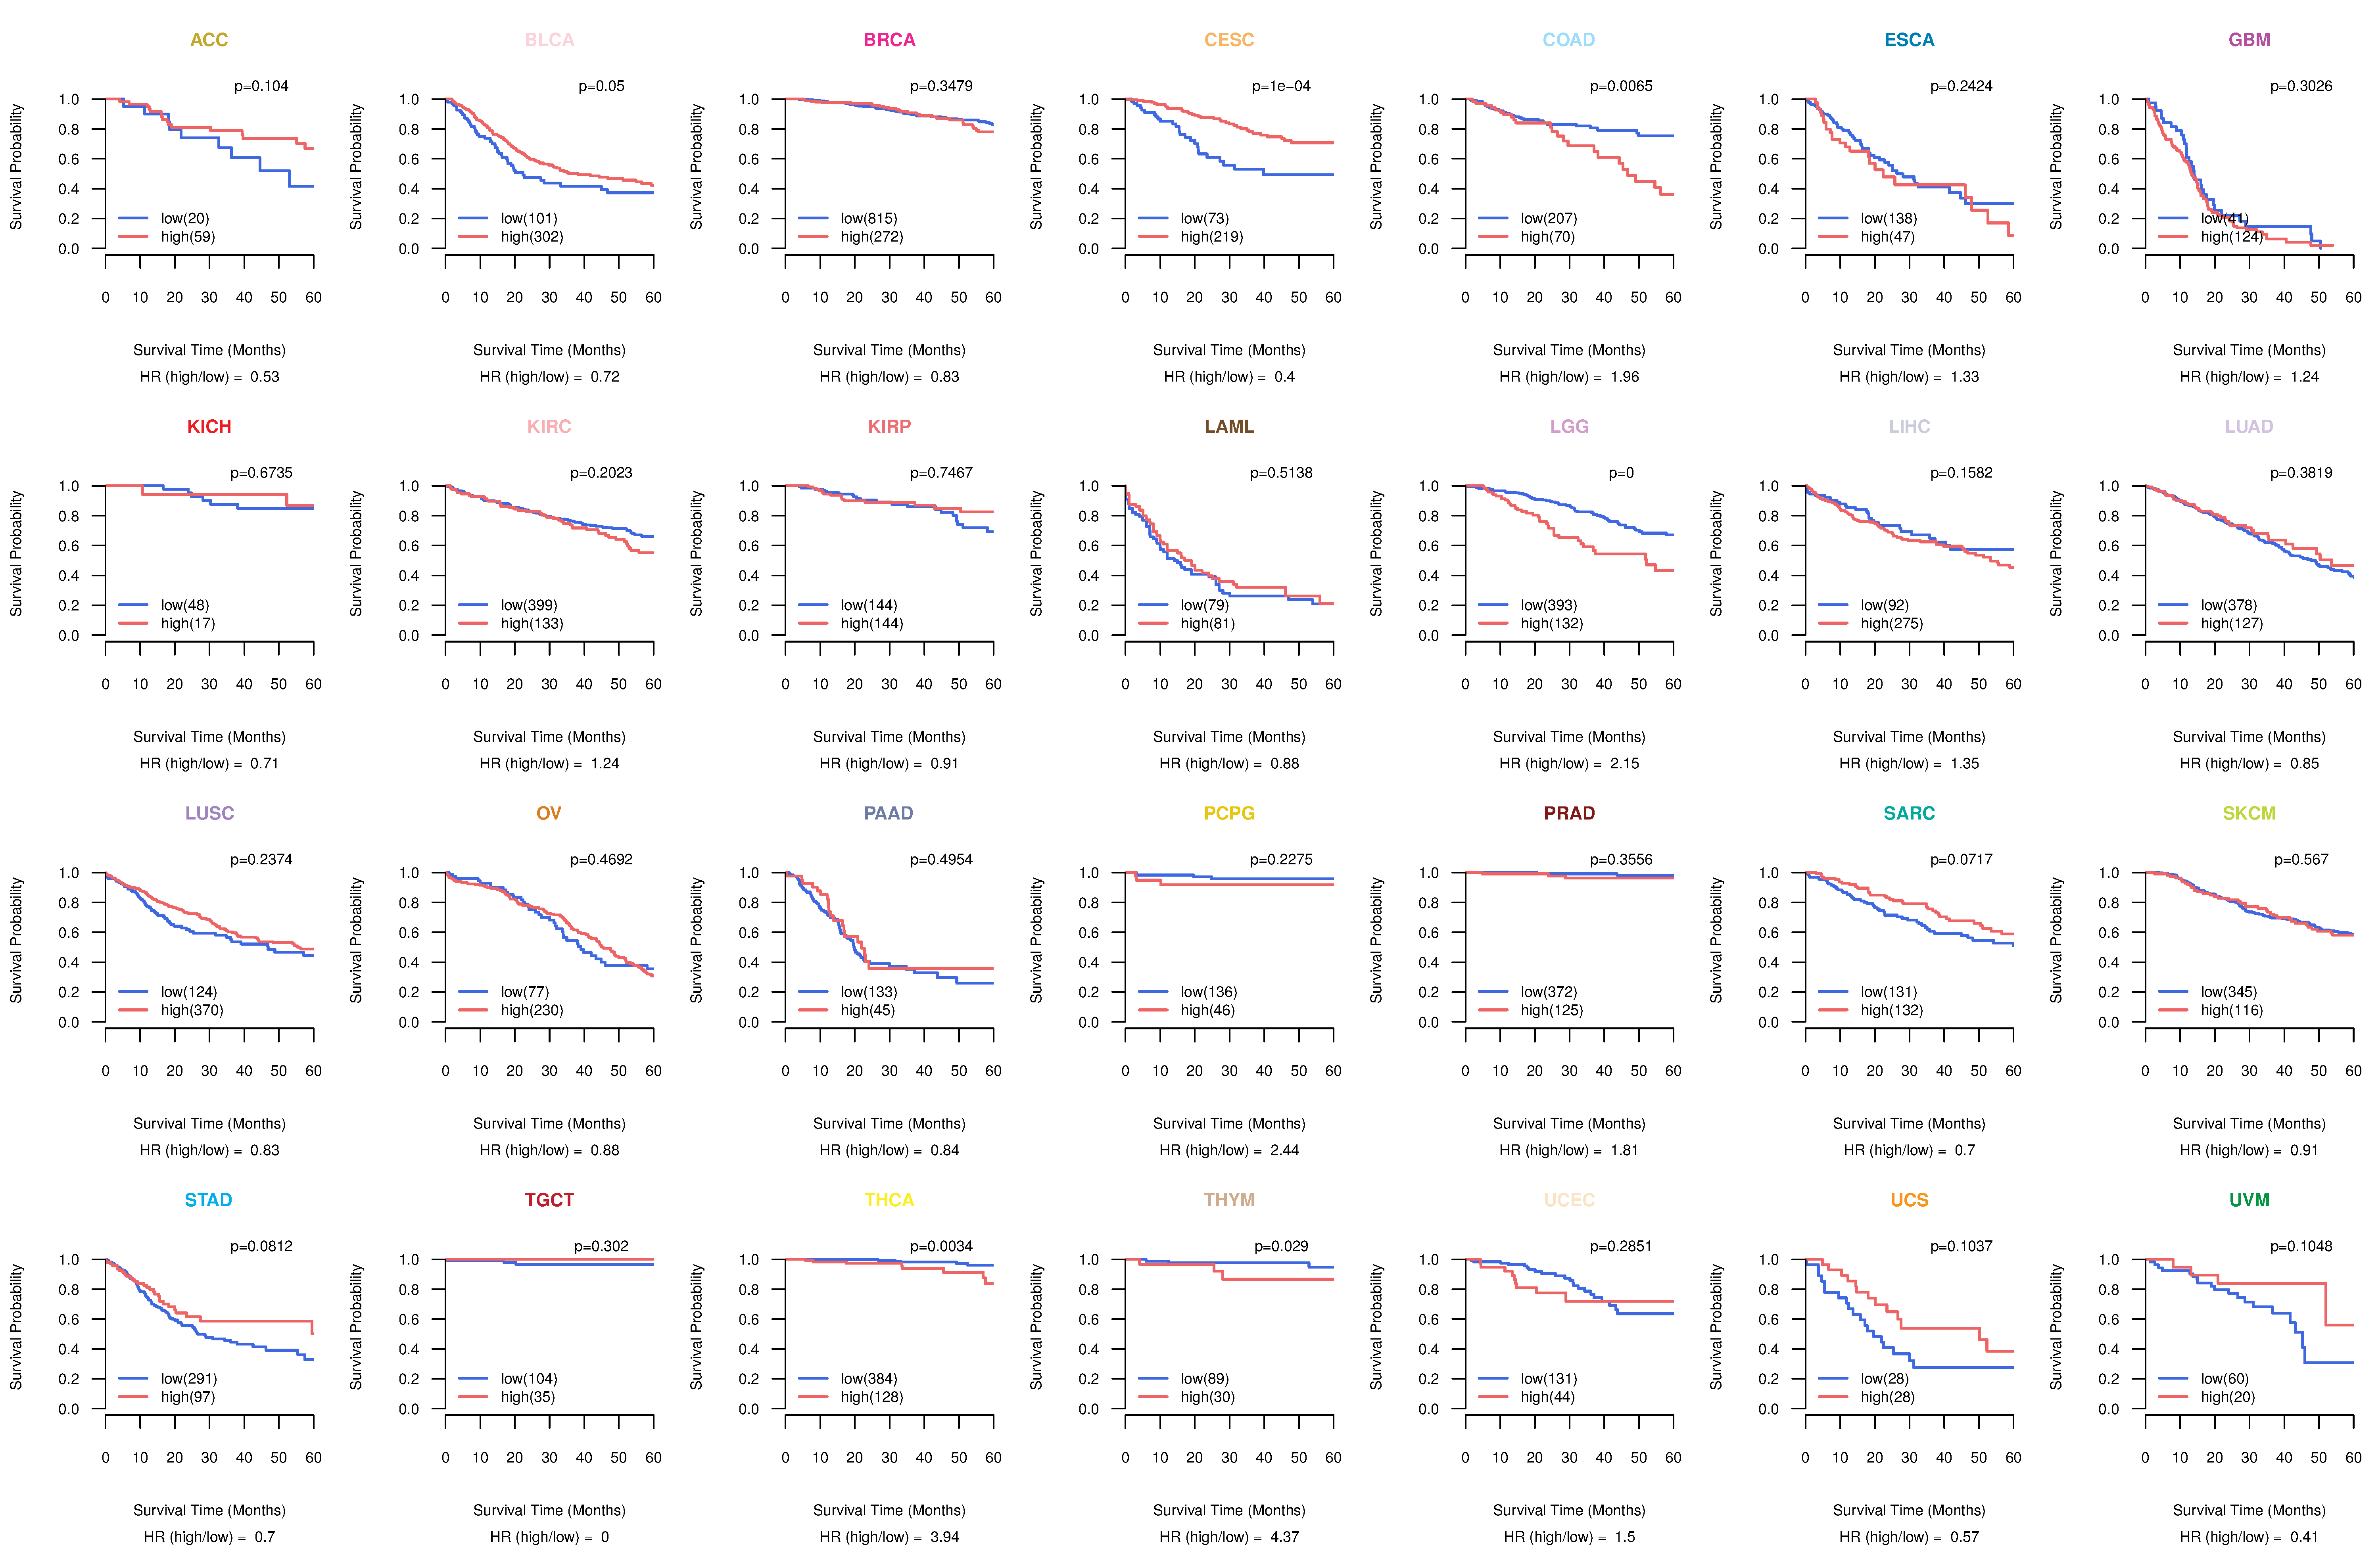
| Kaplan-Meier plots with logrank tests of overall survival (OS) using 28 cancer types (TCGA IlluminaHiSeq_RNASeqV2, pan-cancer normalized log2(norm_counts+1) data, version 2016-08-16) (TCGA clinicalMatrix, phenotype data, version 2016-04-27) * Click on the image to enlarge it in a new window. |
 |
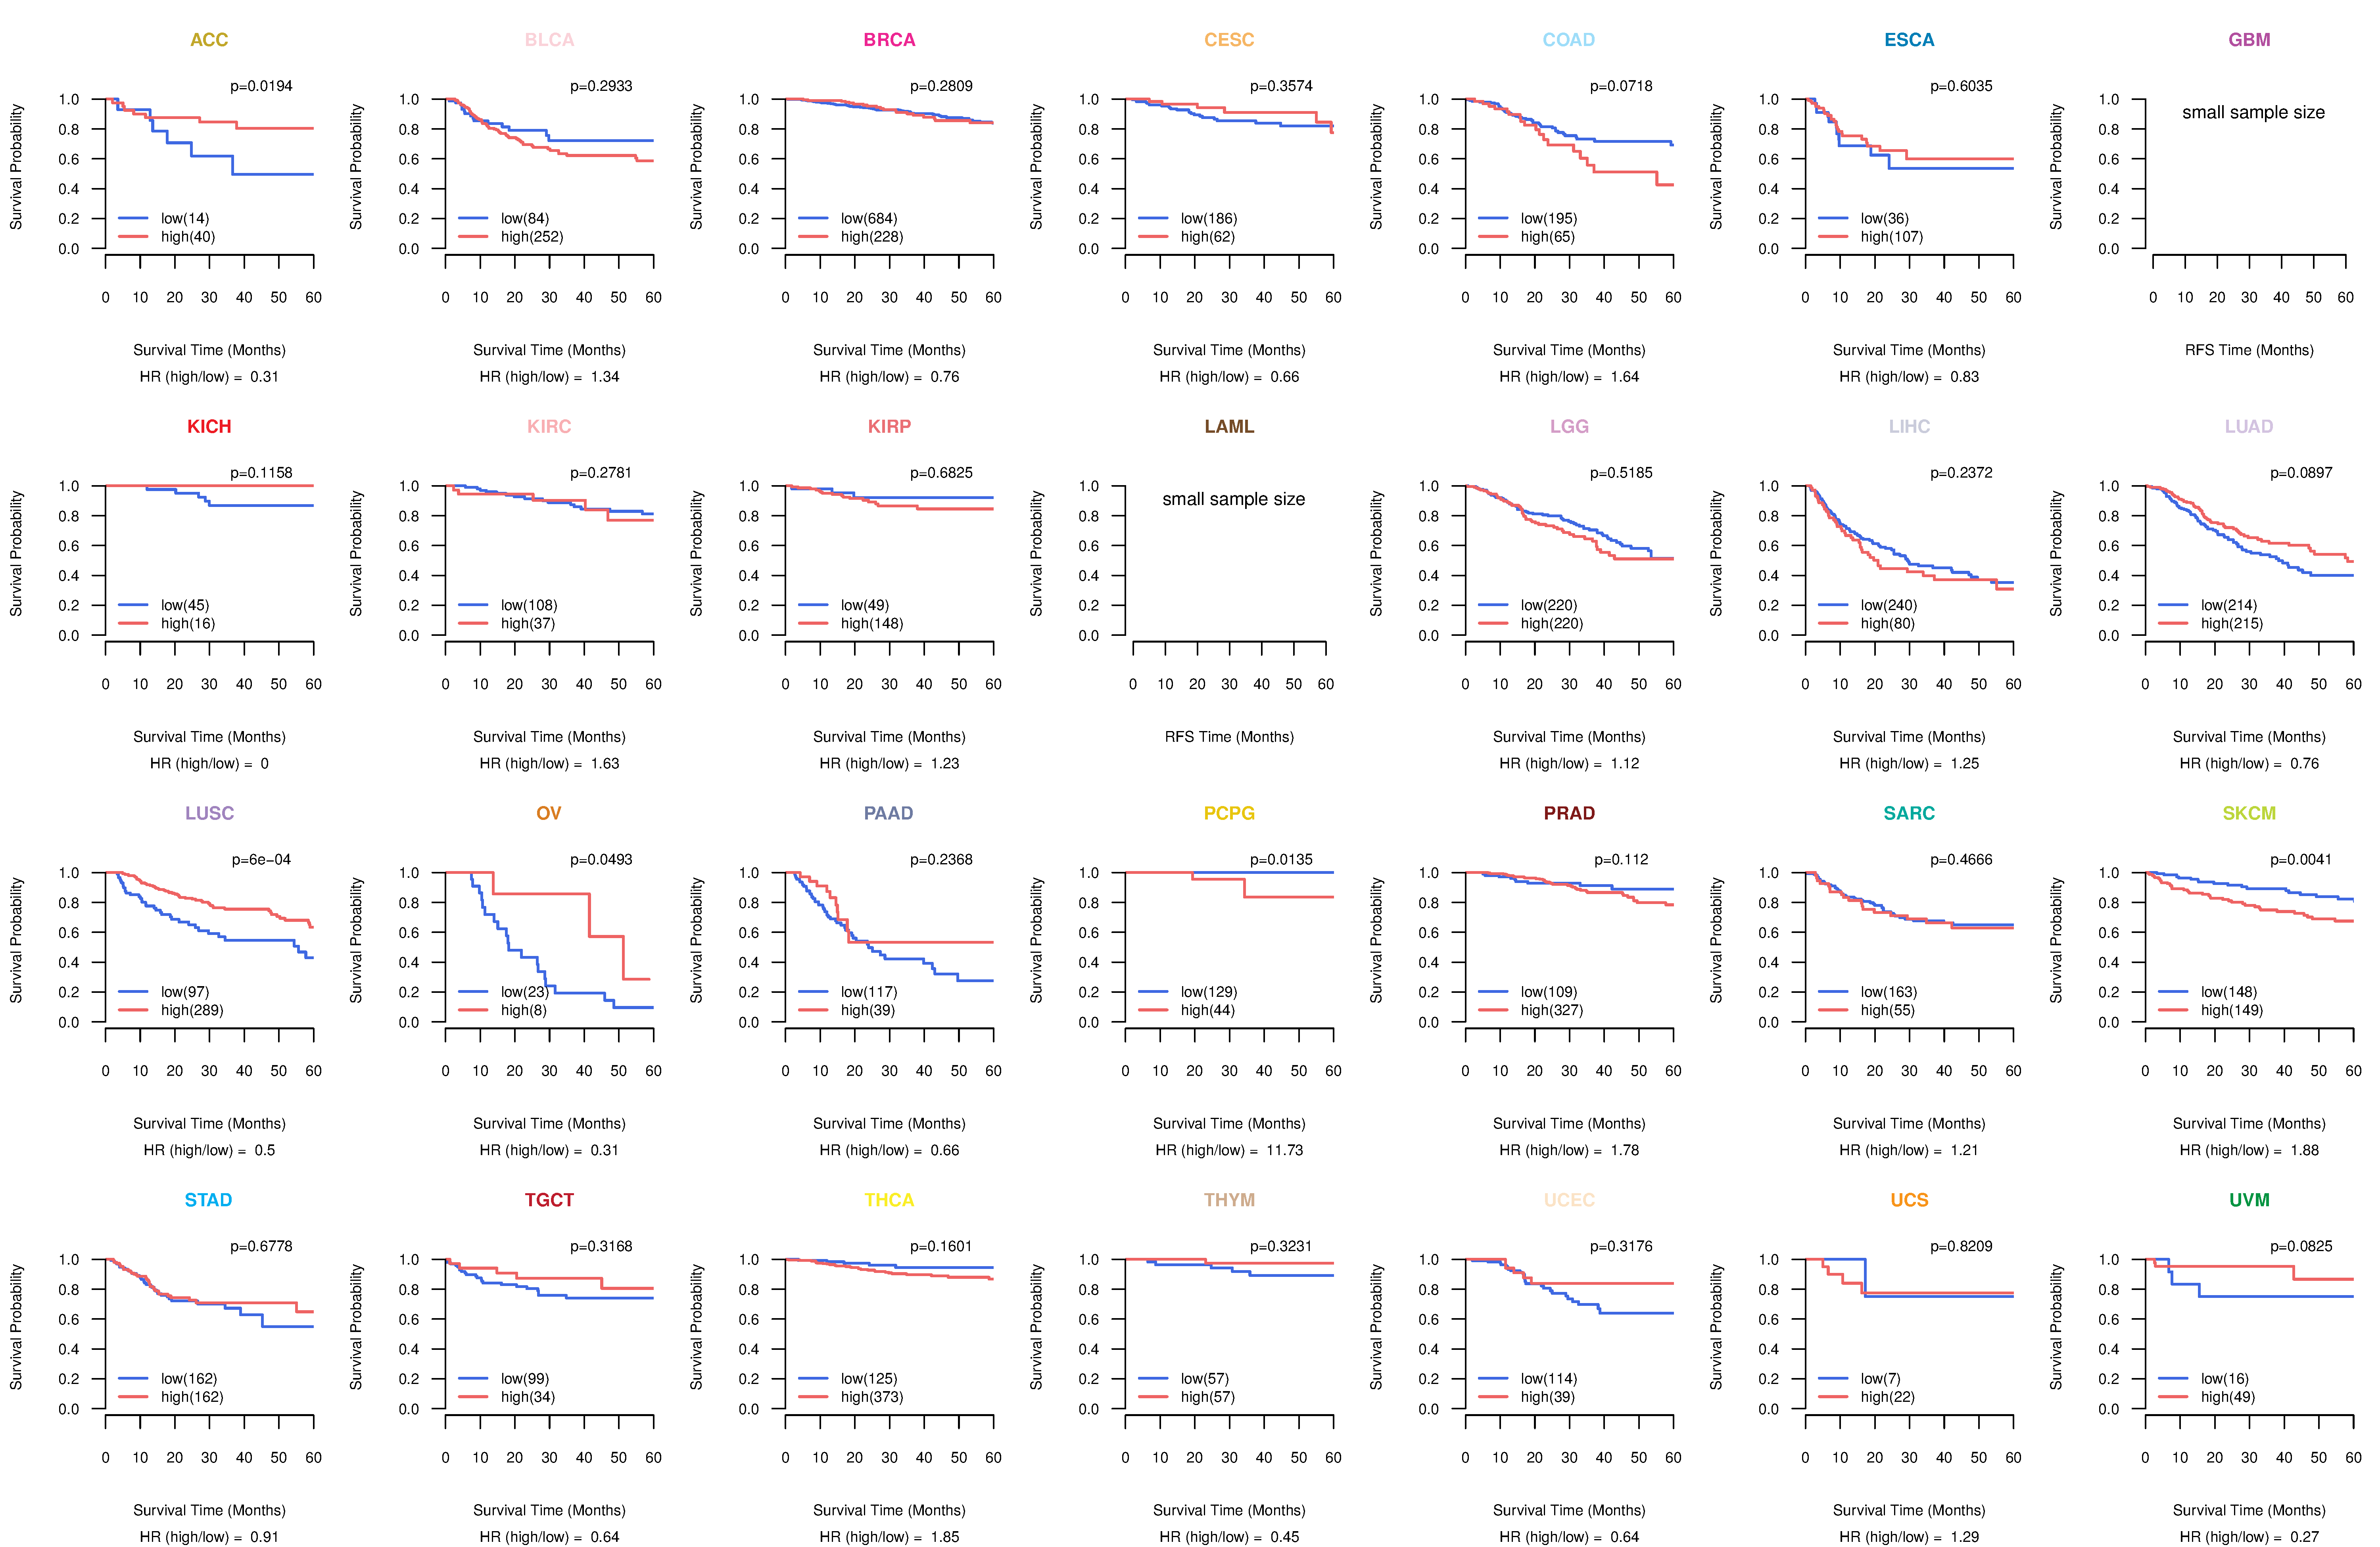
| Kaplan-Meier plots with logrank test of relapse free survival (RFS) using 28 cancer types (TCGA IlluminaHiSeq_RNASeqV2, pan-cancer normalized log2(norm_counts+1) data, version 2016-08-16) (TCGA clinicalMatrix, phenotype data, version 2016-04-27) * Click on the image enlarge it in a new window. |
 |
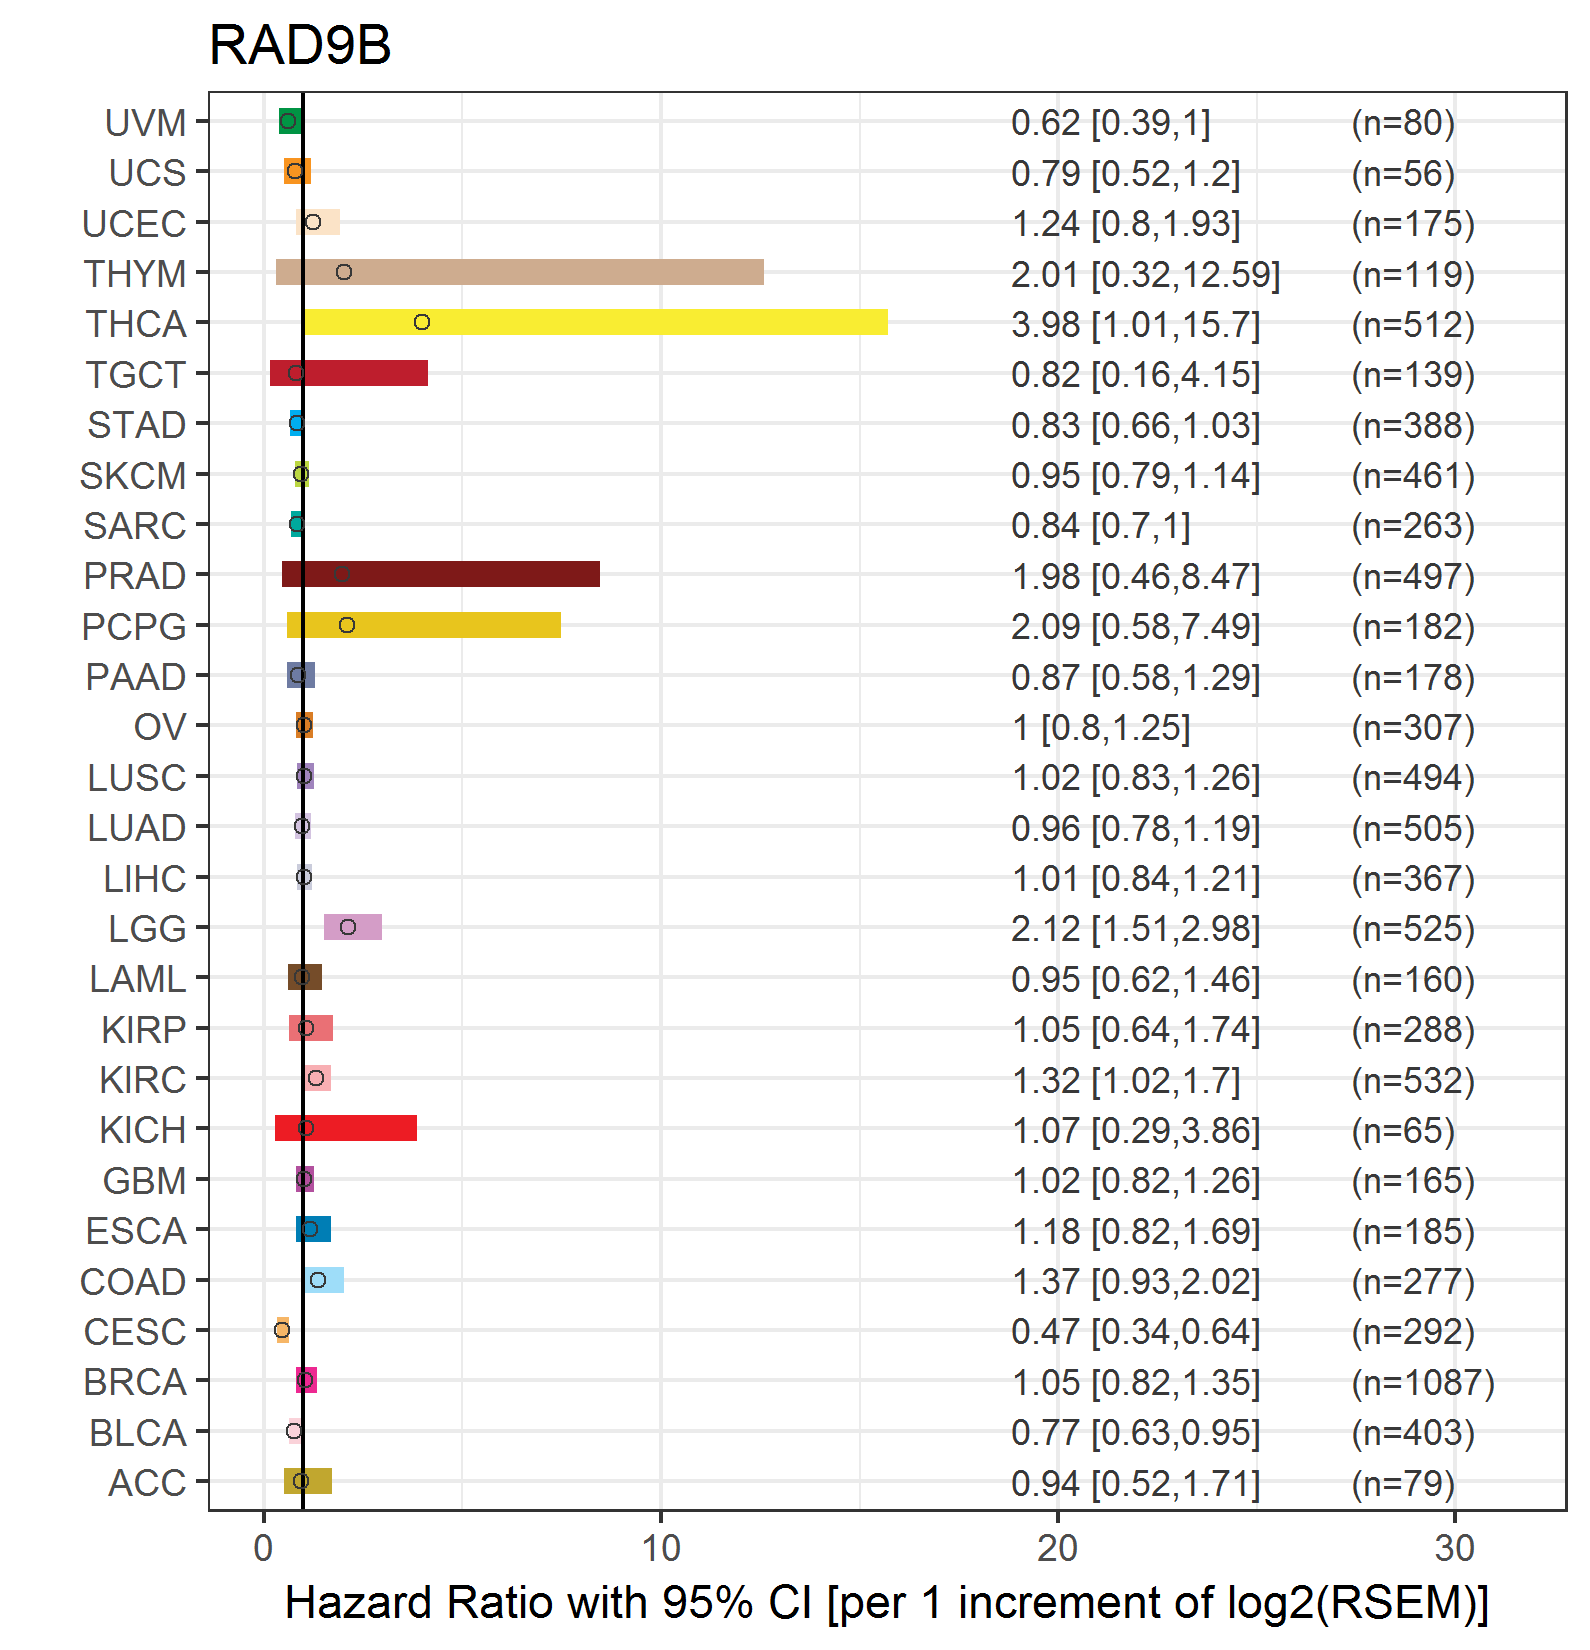
| Forest plot of Cox proportional hazard ratio (HR) and 95% CI of overall survival (OS) using 28 cancer types (TCGA IlluminaHiSeq_RNASeqV2, pan-cancer normalized log2(norm_counts+1) data, version 2016-08-16) (TCGA clinicalMatrix, phenotype data, version 2016-04-27) * Click on the image enlarge it in a new window. |
 |
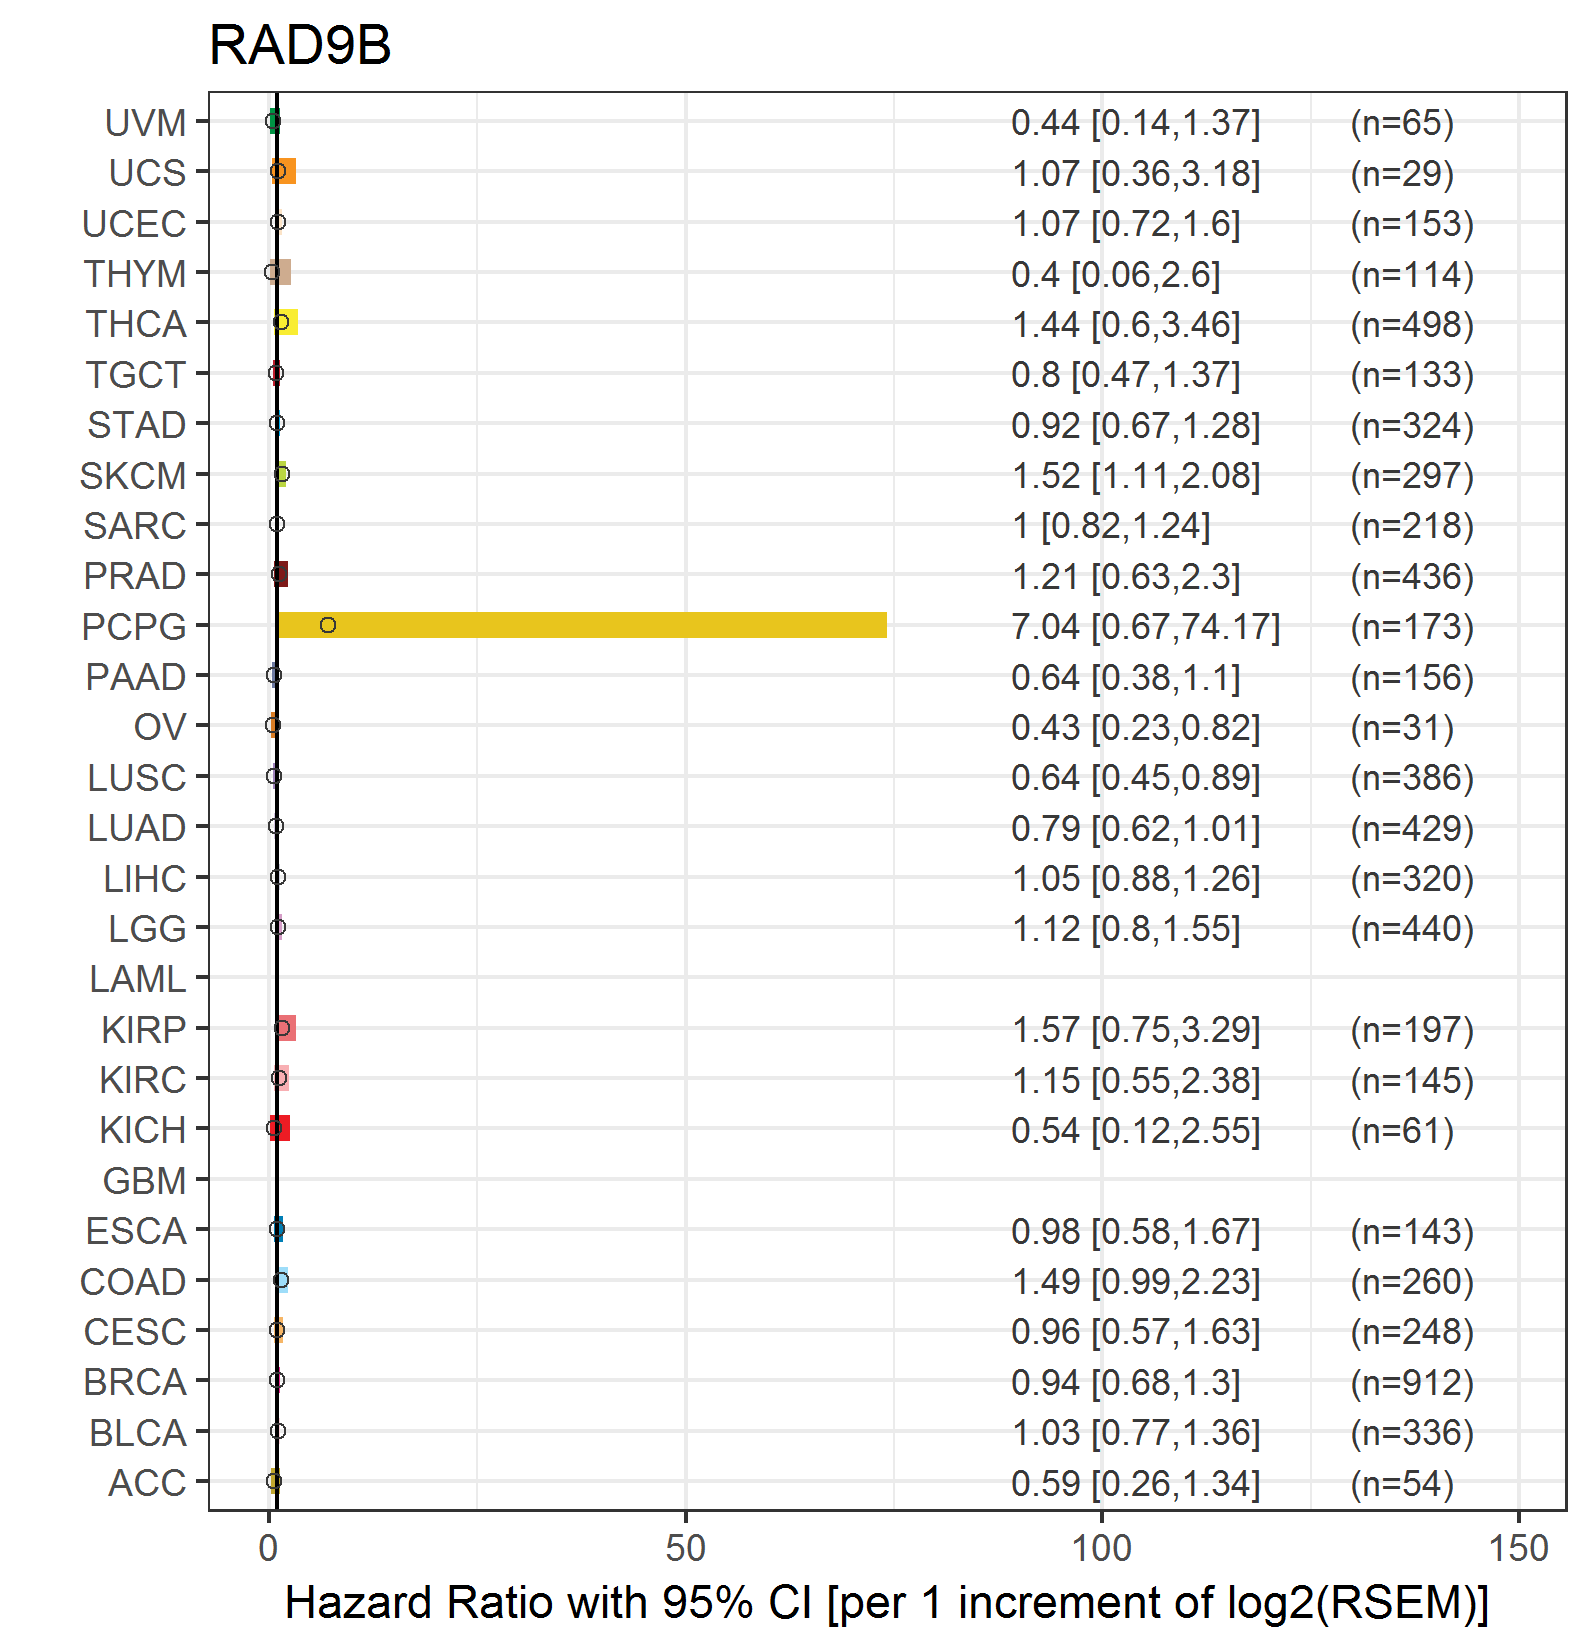
| Forest plot of Cox proportional hazard ratio (HR) and 95% CI of relapse free survival (RFS) using 28 cancer types (TCGA IlluminaHiSeq_RNASeqV2, pan-cancer normalized log2(norm_counts+1) data, version 2016-08-16) (TCGA clinicalMatrix, phenotype data, version 2016-04-27) * Click on the image enlarge it in a new window. |
 |
| Top |
| TissGeneClin for RAD9B |
| TissGeneDrug for RAD9B |
| Drug information targeting TissGene (DrugBank Version 5.0.6, 2017-04-01) |
| DrugBank ID | Drug name | Drug activity | Drug type | Drug status |
| Top |
| TissGeneDisease for RAD9B |
| Disease information associated with TissGene (DisGeNet, 2016-06-01) |
| Disease ID | Disease name | # pubmeds | Source |
| umls:C0036631 | Seminoma | 1 | BeFree |
|
Copyright 2016-Present - The University of Texas Health Science Center at Houston (UTHealth) Web File Viewing | How to Report, Fraud, Waste and Abuse | State of Texas | Statewide Search | Texas Homeland Security | Site Policies |