 |
| |
| |
| |
| |
| |
| |
|

| TissGeneSummary for CSN3 |
 Gene summary Gene summary |
| Basic gene information | Gene symbol | CSN3 |
| Gene name | casein kappa | |
| Synonyms | CSN10|CSNK|KCA | |
| Cytomap | UCSC genome browser: 4q21.1 | |
| Type of gene | protein-coding | |
| RefGenes | NM_005212.2, | |
| Description | kappa-casein | |
| Modification date | 20141207 | |
| dbXrefs | MIM : 601695 | |
| HGNC : HGNC | ||
| Ensembl : ENSG00000171209 | ||
| HPRD : 03411 | ||
| Vega : OTTHUMG00000129399 | ||
| Protein | UniProt: go to UniProt's Cross Reference DB Table | |
| Expression | CleanEX: HS_CSN3 | |
| BioGPS: 1448 | ||
| Pathway | NCI Pathway Interaction Database: CSN3 | |
| KEGG: CSN3 | ||
| REACTOME: CSN3 | ||
| Pathway Commons: CSN3 | ||
| Context | iHOP: CSN3 | |
| ligand binding site mutation search in PubMed: CSN3 | ||
| UCL Cancer Institute: CSN3 | ||
| Assigned class in TissGDB* | C | |
| Included tissue-specific gene expression resources | HPA,GTEx | |
| Specific-tissues in normal samples (assigned by TissGDB using HPA, TiGER, and GTEx) | Breast | |
| Cancer types related to the specific-tissues in cancer samples (assigned by TissGDB using TCGA) | BRCA | |
| Reference showing the relevant tissue of CSN3 | ||
| Description by TissGene annotations | ||
| * Class A consists of genes with literature evidence and is part of the cTissGenes. Class B consists of only cTissGenes without additional evidence. The remaining genes belong to Class C. |
| Gene ontology having evidence of Inferred from Direct Assay (IDA) from Entrez |
| GO ID | GO term | PubMed ID | GO:0007595 | lactation | 7979373 | GO:0050821 | protein stabilization | 7979373 | GO:0007595 | lactation | 7979373 | GO:0050821 | protein stabilization | 7979373 |
| Top |
| TissGeneExp for CSN3 |
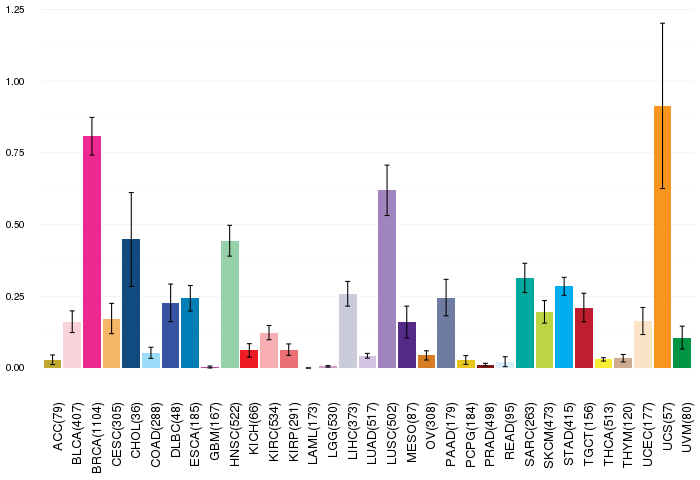
| Gene expressions across 28 cancer types (X-axis: cancer type and Y-axis: log2(norm_counts+1)) (TCGA IlluminaHiSeq_RNASeqV2, pan-cancer normalized log2(norm_counts+1) data, version 2016-08-16) |
 |
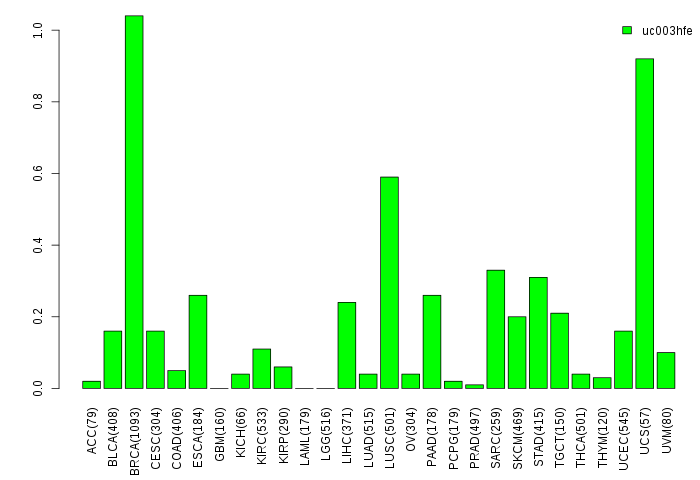
| Gene isoform expressions across 28 cancer types (X-axis: cancer type and Y-axis: log2(norm_counts+1)) (TCGA pan-cancer tcga_rsem_isoform_tpm, version 2016-09-01) |
 |
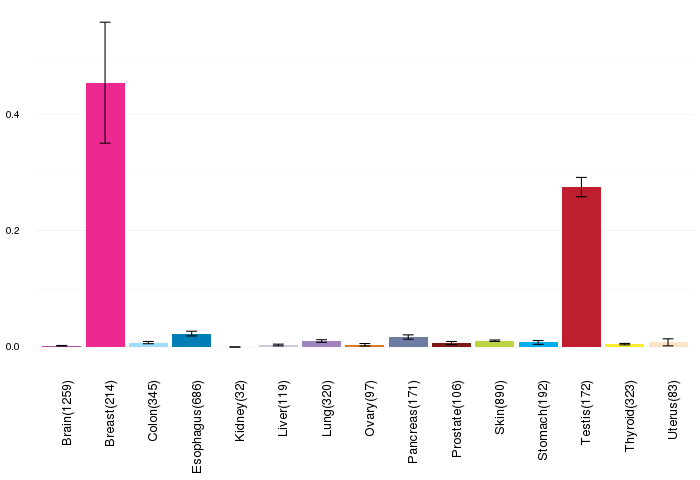
| Gene expressions across normal tissues of GTEx data (GTEx GTEx_Analysis_v6_RNA-seq_RNA-SeQCv1.1.8_gene_rpkm.gct) - Here, we shows the matched tissue types only among our 28 cancer types. |
 |
| Different expressions across 14 cancer types with more than 10 samples between matched tumors and normals (X-axis: cancer type and Y-axis: log2(norm_counts+1)) (TCGA IlluminaHiSeq_RNASeqV2, pan-cancer normalized log2(norm_counts+1) data, version 2016-08-16) |
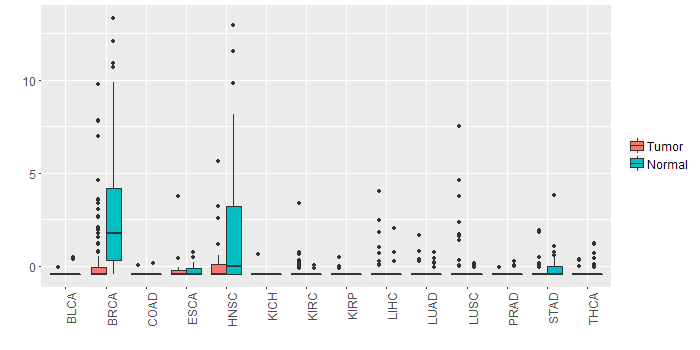 |
| - Significantly differentially expressed cancer types and information. (|Fold change|>1 and FDR<0.05) |
| Cancer type | Mean(exp) in tumor | Mean(exp) in matched normal | Log2FC | P-val. | FDR |
| BRCA | 0.308846312 | 2.709446312 | -2.4006 | 4.80E-11 | 1.93E-10 |
| HNSC | 0.059814325 | 1.917911999 | -1.858097674 | 0.00214 | 0.00655102 |
| Top |
| TissGene-miRNA for CSN3 |
| Significantly anti-correlated miRNAs of TissGene across 28 cancer types (Gene-miRNA relations from TargetScanHuman Relsease 7.1, Conserved_Site_Context_Scores.txt.zip, 06.01.2016) (TCGA IlluminaHiSeq_miRNASeq, log2(RPM+1) data, version 2016-11-21) (TCGA IlluminaHiSeq_RNASeqV2, log2(normalized_count+1) data, version 2016-08-16) (Spearman’s Rank Correlation (p-value<0.05 and coefficient<-0.25)) |
| Cancer type | miRNA id | miRNA accession | P-val. | Coeff. | # samples |
| Top |
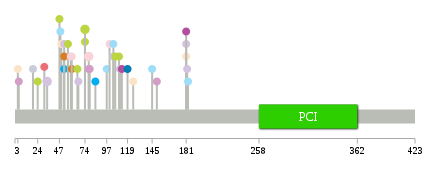
| TissGeneMut for CSN3 |
| TissGeneSNV for CSN3 |
| nsSNV counts per each loci. Different colors of circles represent different cancer types. Circle size denotes number of samples. (TCGA somatic mutation (SNPs and small INDELs) data, version 2016-04-25) * Click on the image to enlarge it in a new window. |
 |
 |
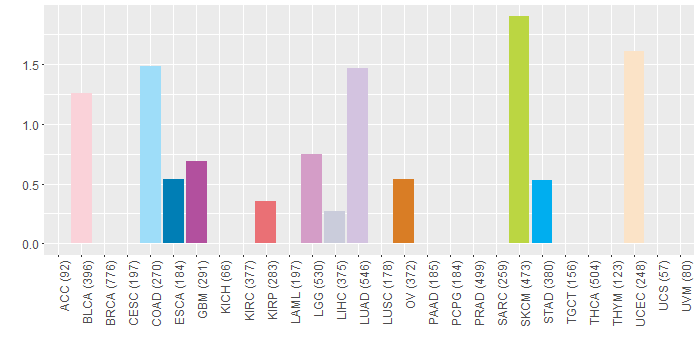
| Somatic nucleotide variants of TissGene across 28 cancer types (X-axis: cancer type and Y-axis: % of mutated samples) The numbers in parentheses are numbers of samples with mutation (nsSNVs). (TCGA somatic mutation (SNPs and small INDELs) data, version 2016-04-25) |
 |
| - nsSNVs sorted by frequency. |
| AAchange | Cancer type | # samples |
| p.R78C | BLCA | 2 |
| p.P74S | SKCM | 2 |
| p.D34H | LUAD | 2 |
| p.L113M | GBM | 1 |
| p.F4Y | LGG | 1 |
| p.T181R | LUAD | 1 |
| p.T181M | UCEC | 1 |
| p.Q97X | COAD | 1 |
| p.T106I | SKCM | 1 |
| p.N24K | SKCM | 1 |
| p.G59R | BLCA | 1 |
| p.A19S | LIHC | 1 |
| p.X183K | COAD | 1 |
| p.T60N | OV | 1 |
| p.P104T | LUAD | 1 |
| p.P52Q | LUAD | 1 |
| p.P100T | BLCA | 1 |
| p.R110C | SKCM | 1 |
| p.I125S | UCEC | 1 |
| p.P47S | SKCM | 1 |
| p.T79A | LGG | 1 |
| p.P104T | COAD | 1 |
| p.T181M | GBM | 1 |
| p.R66S | SKCM | 1 |
| p.P52S | STAD | 1 |
| p.P74A | HNSC | 1 |
| p.A182S | LUAD | 1 |
| p.Y49* | UCEC | 1 |
| p.M48I | COAD | 1 |
| p.A85V | STAD | 1 |
| p.P74L | SKCM | 1 |
| p.A119S | ESCA | 1 |
| p.S3I | UCEC | 1 |
| p.H31Q | KIRP | 1 |
| p.P150Q | LGG | 1 |
| p.P52A | OV | 1 |
| p.P56S | SKCM | 1 |
| p.P111A | LUAD | 1 |
| p.R78H | LGG | 1 |
| p.P67S | LUAD | 1 |
| p.A145T | COAD | 1 |
| p.V8A | DLBC | 1 |
| p.T60N | BLCA | 1 |
| Top |
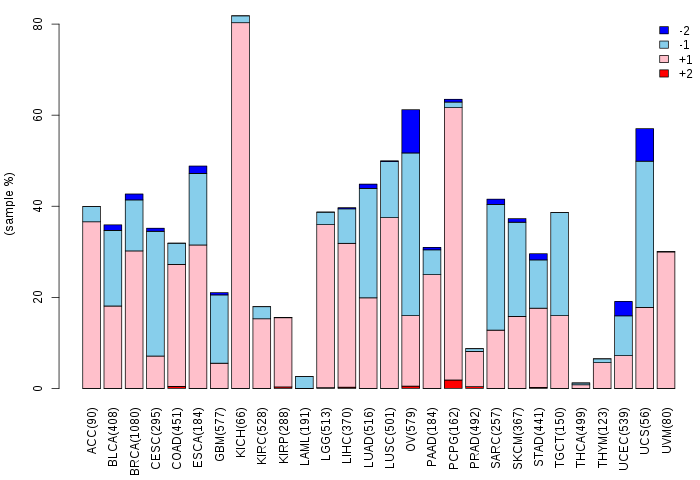
| TissGeneCNV for CSN3 |
| Copy number variations of TissGene across 28 cancer types (X-axis: cancer type and Y-axis: % of CNV samples) (TCGA Gistic2_CopyNumber_Gistic2_all_data_by_genes, Gistic2 copy number data, version 2016-08-16) |
 |
| Top |
| TissGeneFusions for CSN3 |
| Fusion genes including TissGene (ChimerDB 3.0, 2016-12-01 and TCGA fusion Portal 2015-12-01) |
| Database | Src | Cancer type | Sample | Fusion gene | ORF | 5'-gene BP | 3'-gene BP |
| Top |
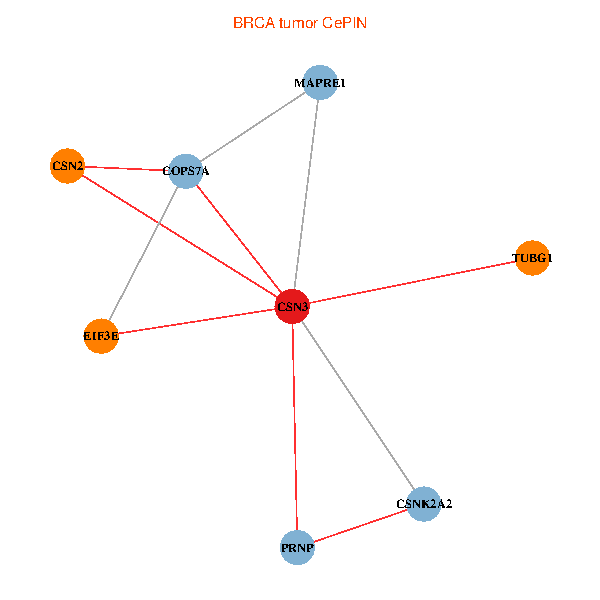
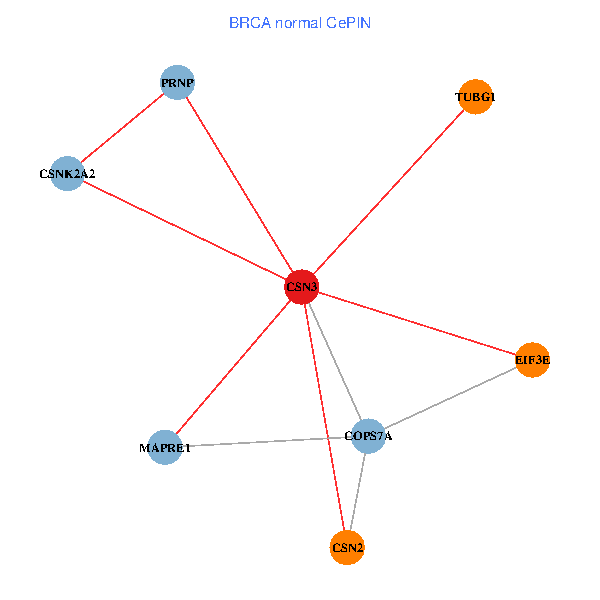
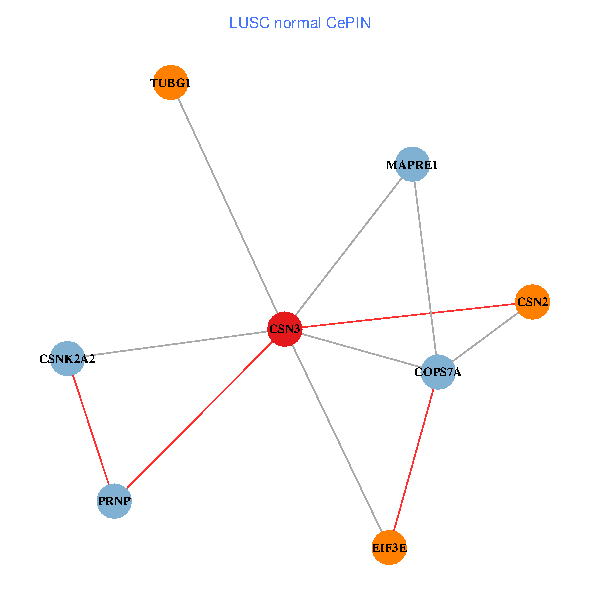
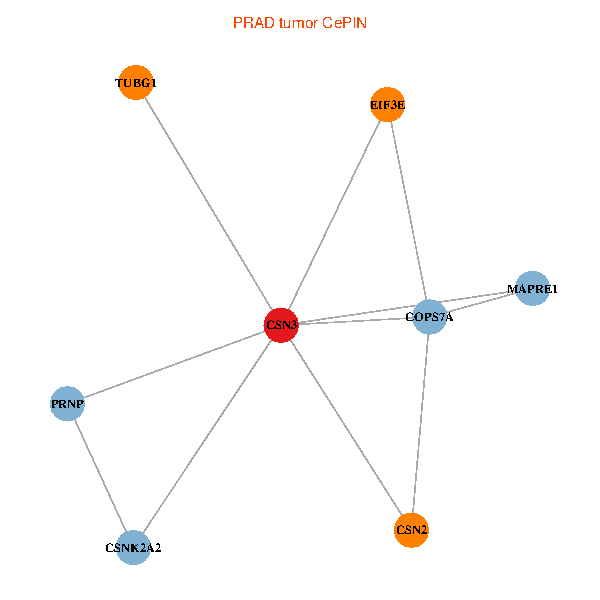
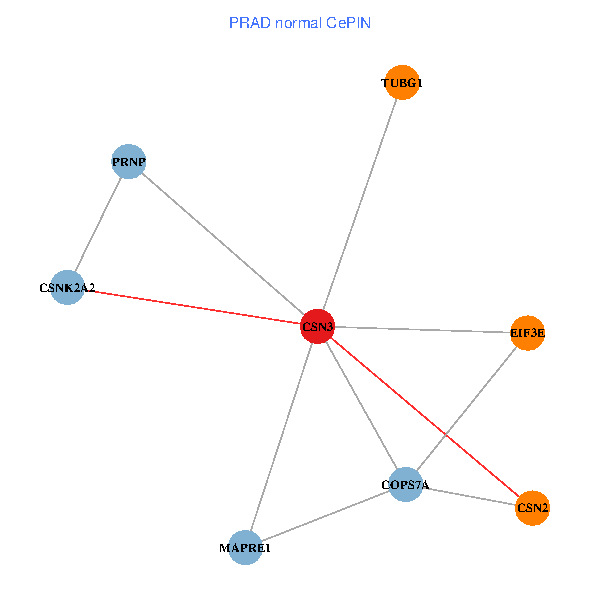
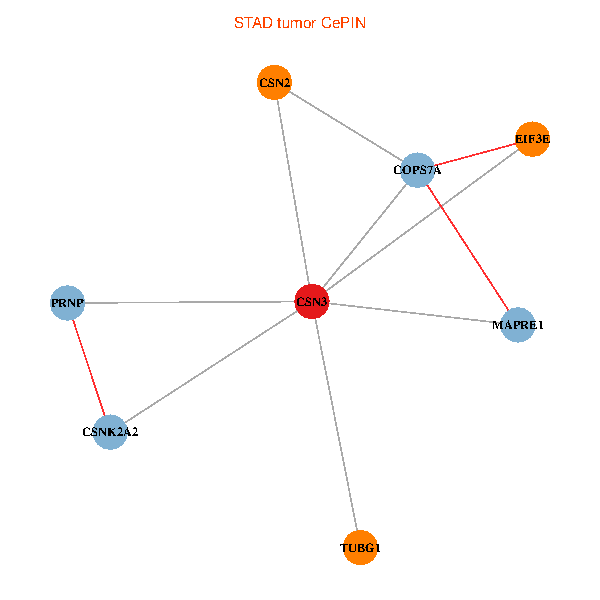
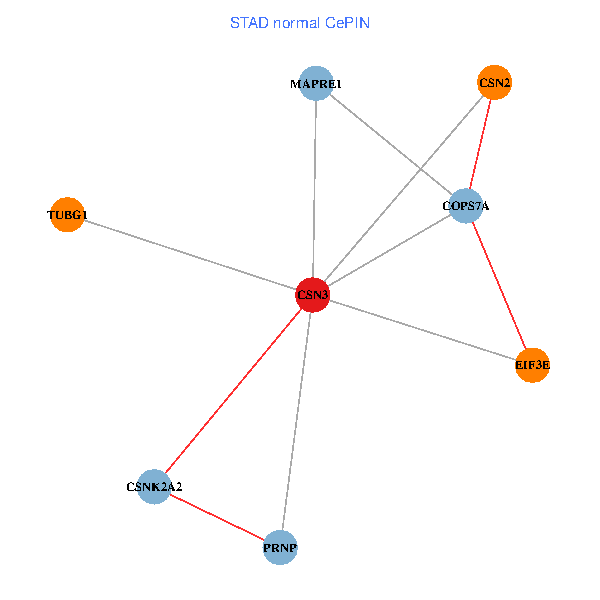
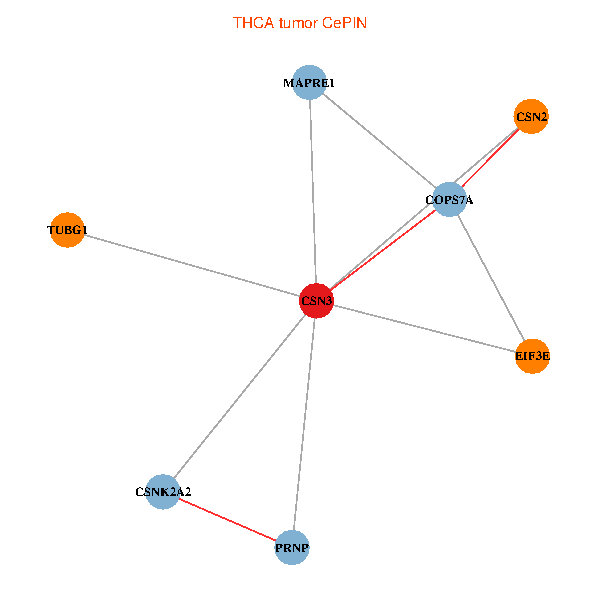
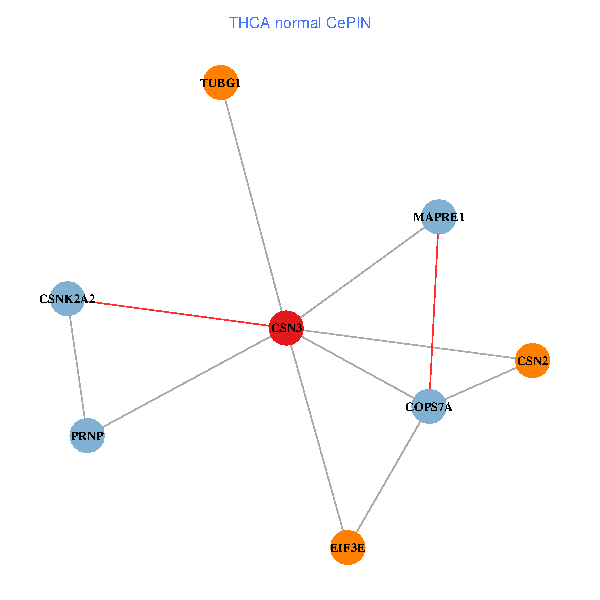
| TissGeneNet for CSN3 |
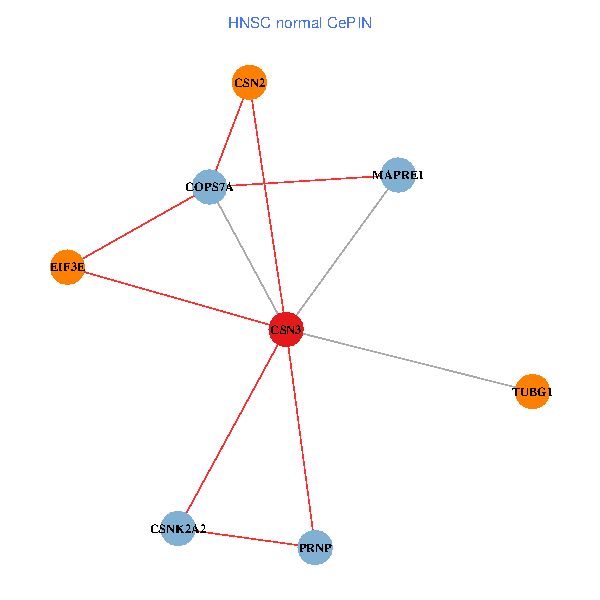
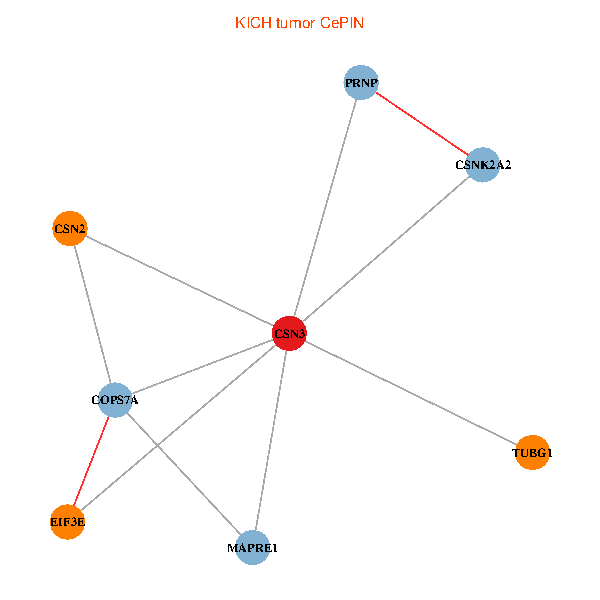
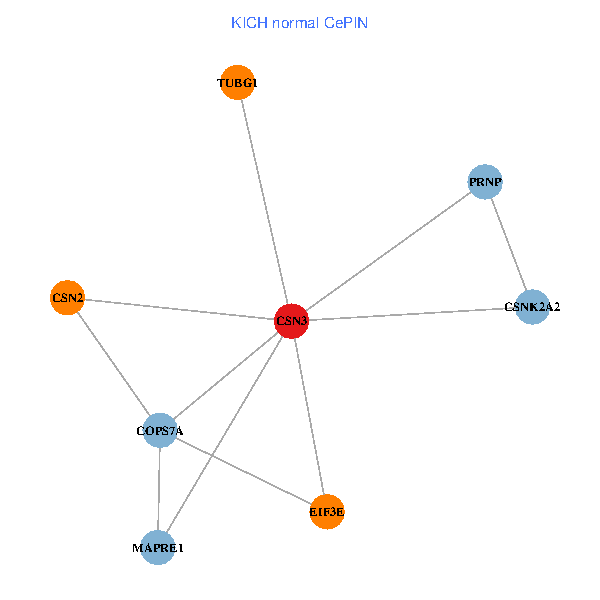
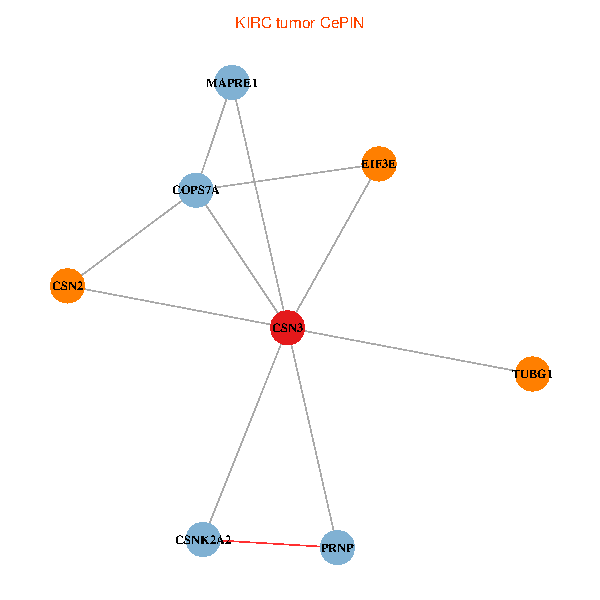
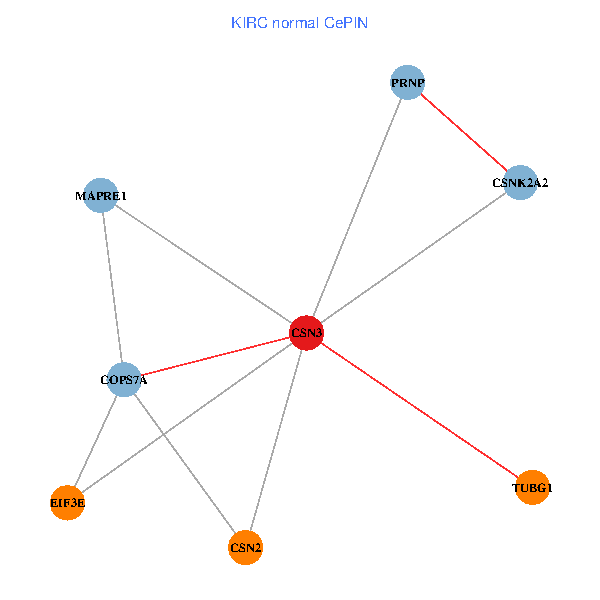
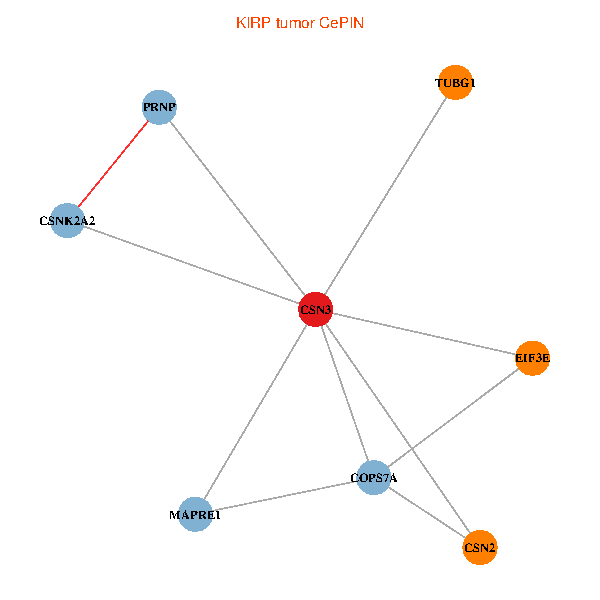
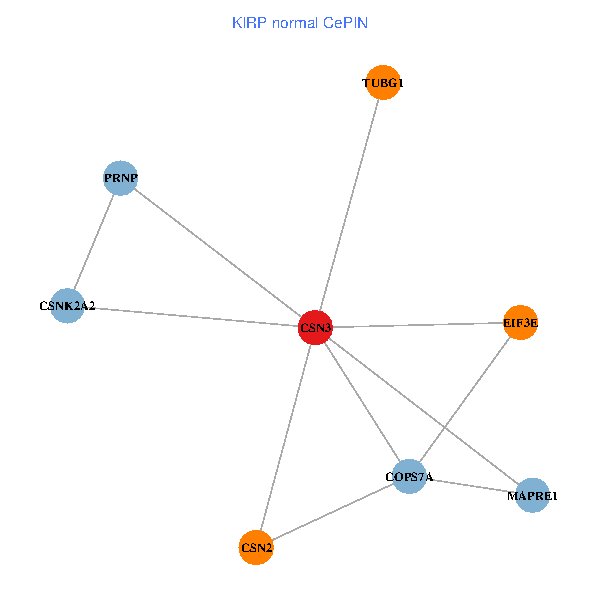
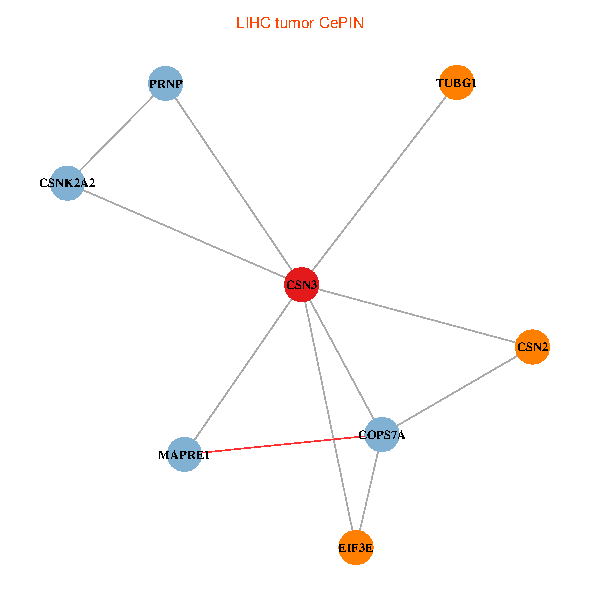
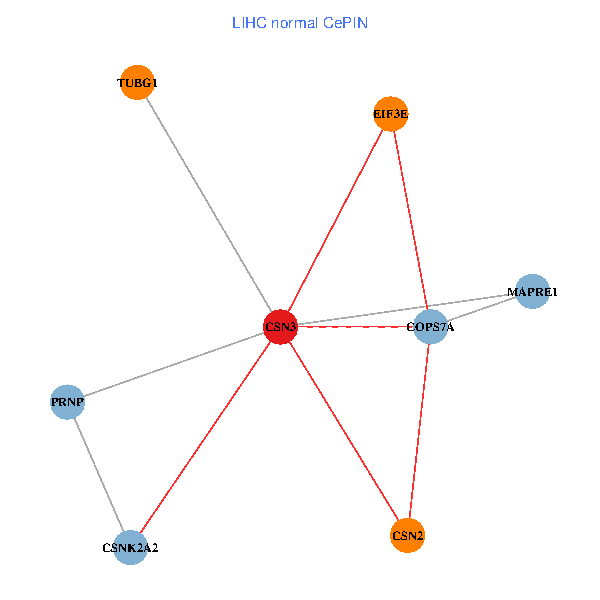
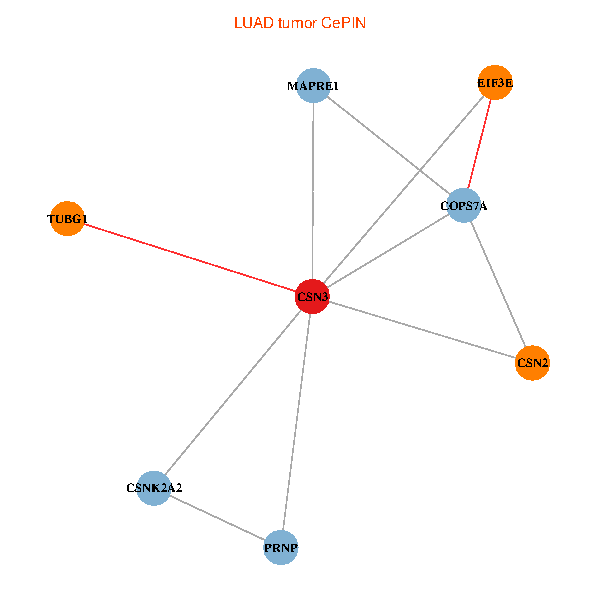
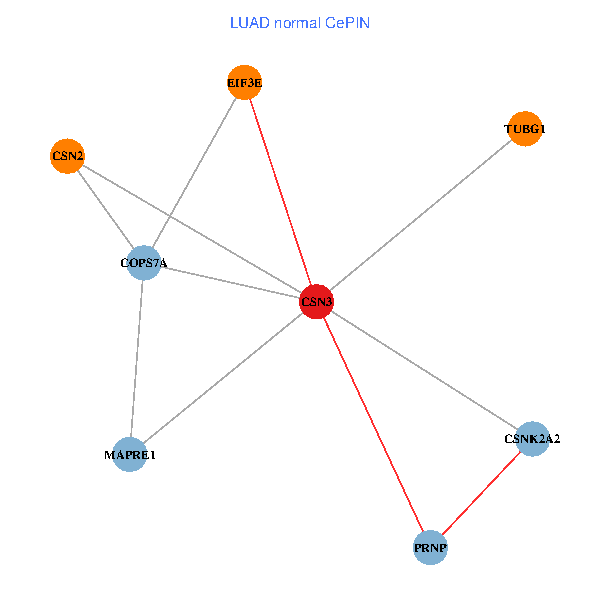
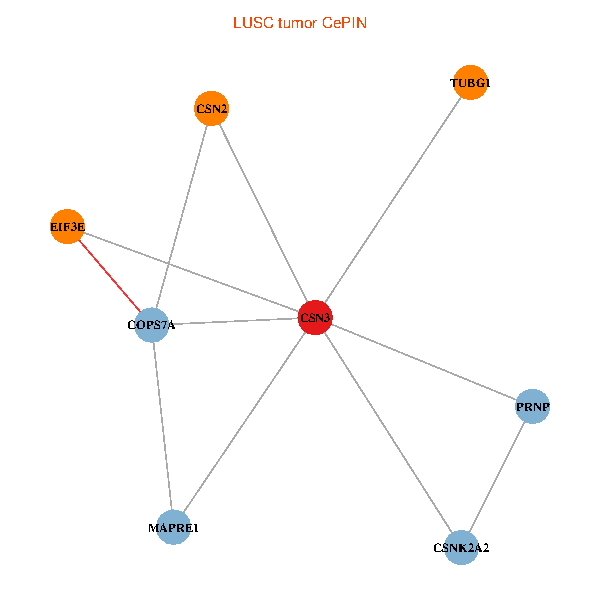
| Co-expressed gene networks based on protein-protein interaction data (CePIN) (TCGA IlluminaHiSeq_RNASeqV2, pan-cancer normalized log2(norm_counts+1) data, version 2016-08-16) (PINA2 ppi data) |
| BRCA (tumor) | BRCA (normal) |
| CSN3, CSNK2A2, CSN2, EIF3E, PRNP, TUBG1, MAPRE1, COPS7A (tumor) | CSN3, CSNK2A2, CSN2, EIF3E, PRNP, TUBG1, MAPRE1, COPS7A (normal) |
 |  |
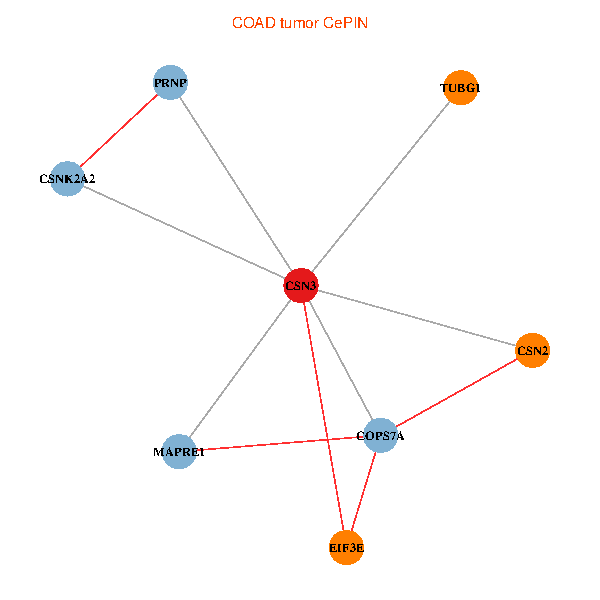
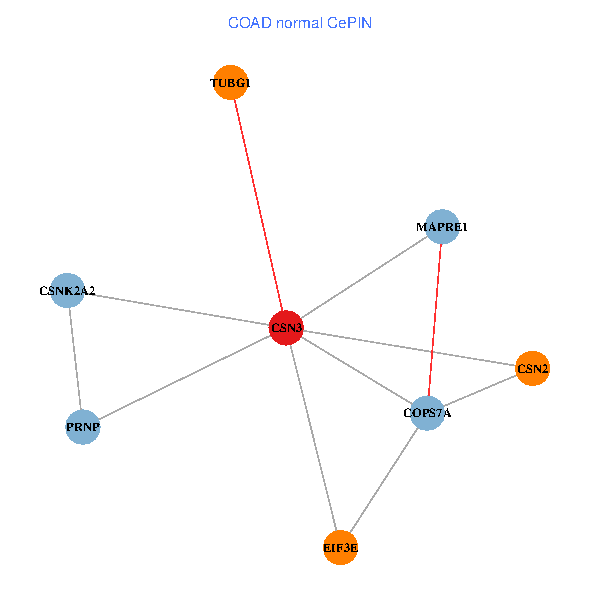
| COAD (tumor) | COAD (normal) |
| CSN3, CSNK2A2, CSN2, EIF3E, PRNP, TUBG1, MAPRE1, COPS7A (tumor) | CSN3, CSNK2A2, CSN2, EIF3E, PRNP, TUBG1, MAPRE1, COPS7A (normal) |
 |  |
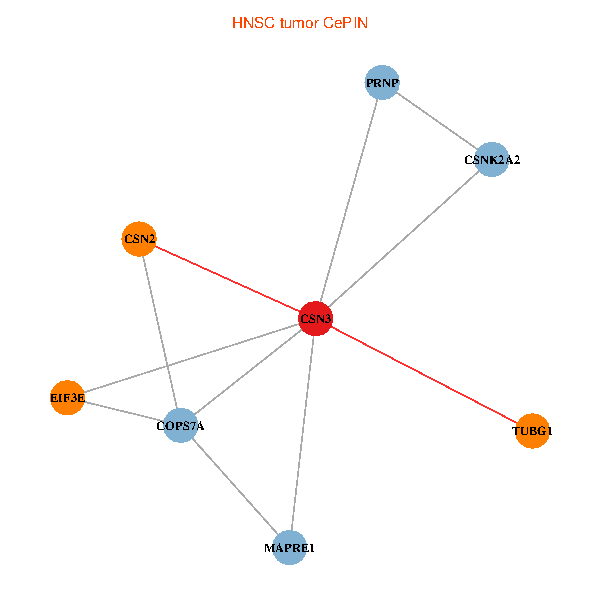
| HNSC (tumor) | HNSC (normal) |
| CSN3, CSNK2A2, CSN2, EIF3E, PRNP, TUBG1, MAPRE1, COPS7A (tumor) | CSN3, CSNK2A2, CSN2, EIF3E, PRNP, TUBG1, MAPRE1, COPS7A (normal) |
 |  |
| KICH (tumor) | KICH (normal) |
| CSN3, CSNK2A2, CSN2, EIF3E, PRNP, TUBG1, MAPRE1, COPS7A (tumor) | CSN3, CSNK2A2, CSN2, EIF3E, PRNP, TUBG1, MAPRE1, COPS7A (normal) |
 |  |
| KIRC (tumor) | KIRC (normal) |
| CSN3, CSNK2A2, CSN2, EIF3E, PRNP, TUBG1, MAPRE1, COPS7A (tumor) | CSN3, CSNK2A2, CSN2, EIF3E, PRNP, TUBG1, MAPRE1, COPS7A (normal) |
 |  |
| KIRP (tumor) | KIRP (normal) |
| CSN3, CSNK2A2, CSN2, EIF3E, PRNP, TUBG1, MAPRE1, COPS7A (tumor) | CSN3, CSNK2A2, CSN2, EIF3E, PRNP, TUBG1, MAPRE1, COPS7A (normal) |
 |  |
| LIHC (tumor) | LIHC (normal) |
| CSN3, CSNK2A2, CSN2, EIF3E, PRNP, TUBG1, MAPRE1, COPS7A (tumor) | CSN3, CSNK2A2, CSN2, EIF3E, PRNP, TUBG1, MAPRE1, COPS7A (normal) |
 |  |
| LUAD (tumor) | LUAD (normal) |
| CSN3, CSNK2A2, CSN2, EIF3E, PRNP, TUBG1, MAPRE1, COPS7A (tumor) | CSN3, CSNK2A2, CSN2, EIF3E, PRNP, TUBG1, MAPRE1, COPS7A (normal) |
 |  |
| LUSC (tumor) | LUSC (normal) |
| CSN3, CSNK2A2, CSN2, EIF3E, PRNP, TUBG1, MAPRE1, COPS7A (tumor) | CSN3, CSNK2A2, CSN2, EIF3E, PRNP, TUBG1, MAPRE1, COPS7A (normal) |
 |  |
| PRAD (tumor) | PRAD (normal) |
| CSN3, CSNK2A2, CSN2, EIF3E, PRNP, TUBG1, MAPRE1, COPS7A (tumor) | CSN3, CSNK2A2, CSN2, EIF3E, PRNP, TUBG1, MAPRE1, COPS7A (normal) |
 |  |
| STAD (tumor) | STAD (normal) |
| CSN3, CSNK2A2, CSN2, EIF3E, PRNP, TUBG1, MAPRE1, COPS7A (tumor) | CSN3, CSNK2A2, CSN2, EIF3E, PRNP, TUBG1, MAPRE1, COPS7A (normal) |
 |  |
| THCA (tumor) | THCA (normal) |
| CSN3, CSNK2A2, CSN2, EIF3E, PRNP, TUBG1, MAPRE1, COPS7A (tumor) | CSN3, CSNK2A2, CSN2, EIF3E, PRNP, TUBG1, MAPRE1, COPS7A (normal) |
 |  |
| Top |
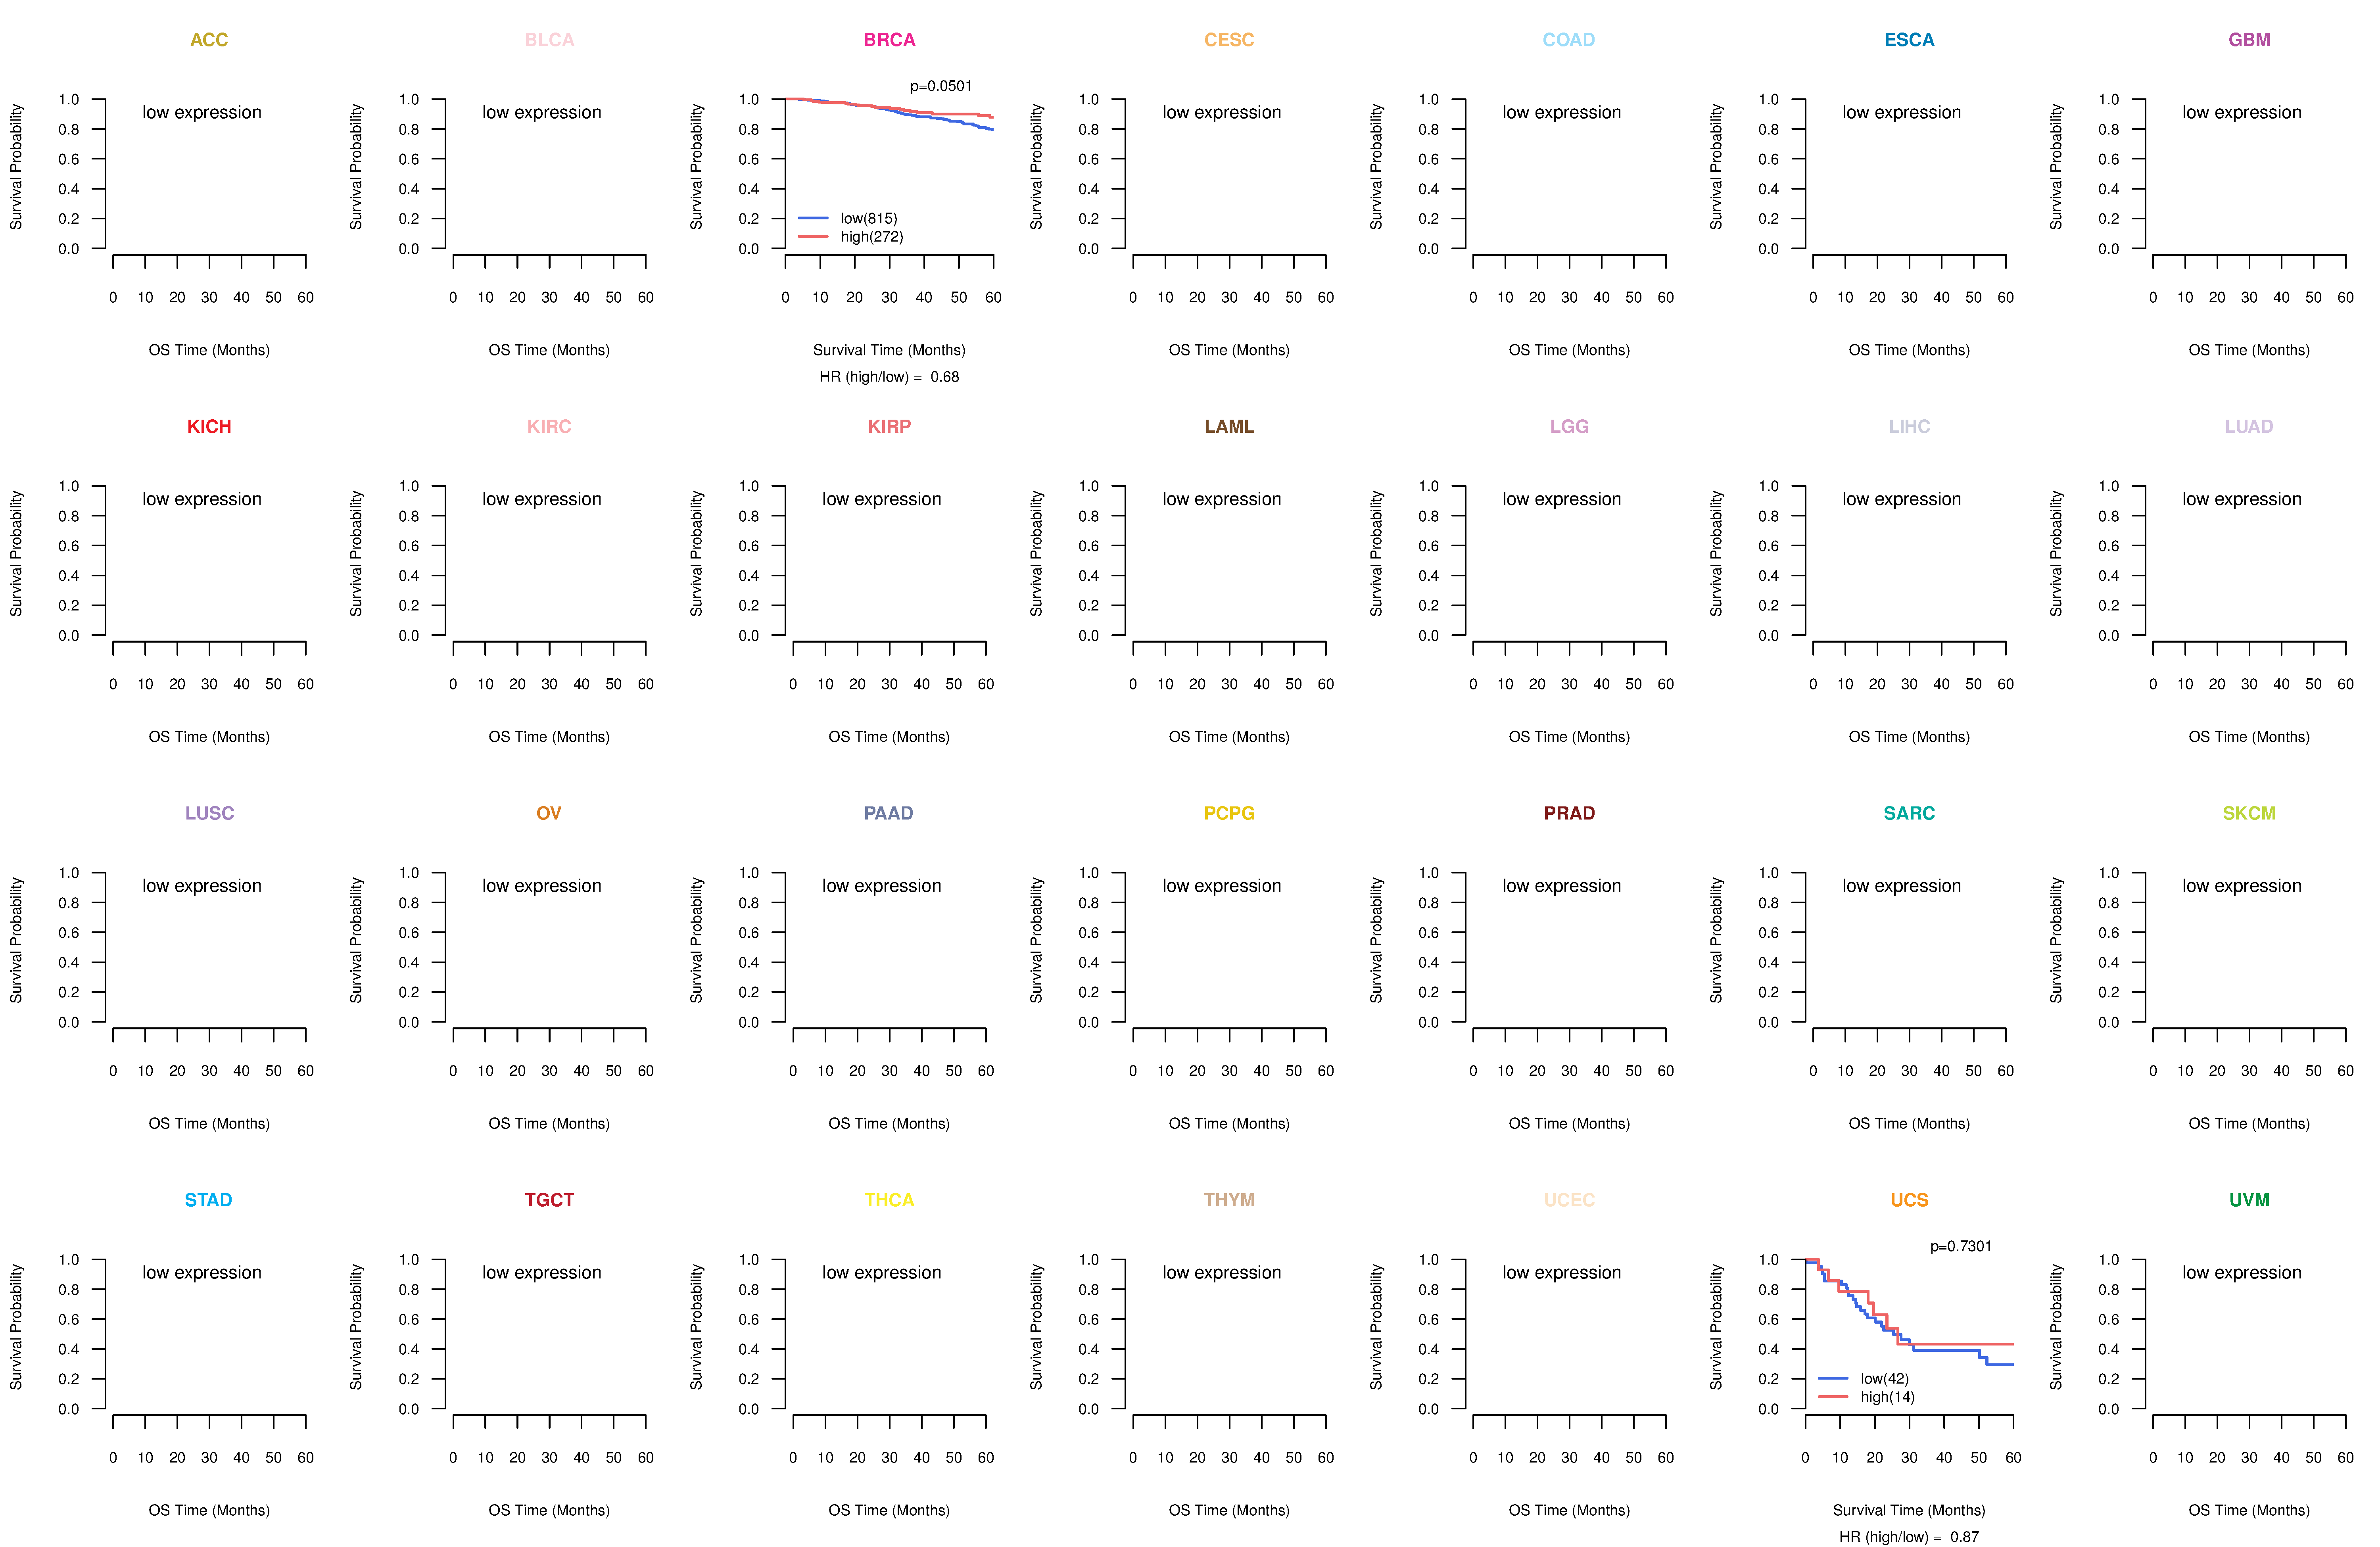
| TissGeneProg for CSN3 |
| Kaplan-Meier plots with logrank tests of overall survival (OS) using 28 cancer types (TCGA IlluminaHiSeq_RNASeqV2, pan-cancer normalized log2(norm_counts+1) data, version 2016-08-16) (TCGA clinicalMatrix, phenotype data, version 2016-04-27) * Click on the image to enlarge it in a new window. |
 |
| Kaplan-Meier plots with logrank test of relapse free survival (RFS) using 28 cancer types (TCGA IlluminaHiSeq_RNASeqV2, pan-cancer normalized log2(norm_counts+1) data, version 2016-08-16) (TCGA clinicalMatrix, phenotype data, version 2016-04-27) * Click on the image enlarge it in a new window. |
 |
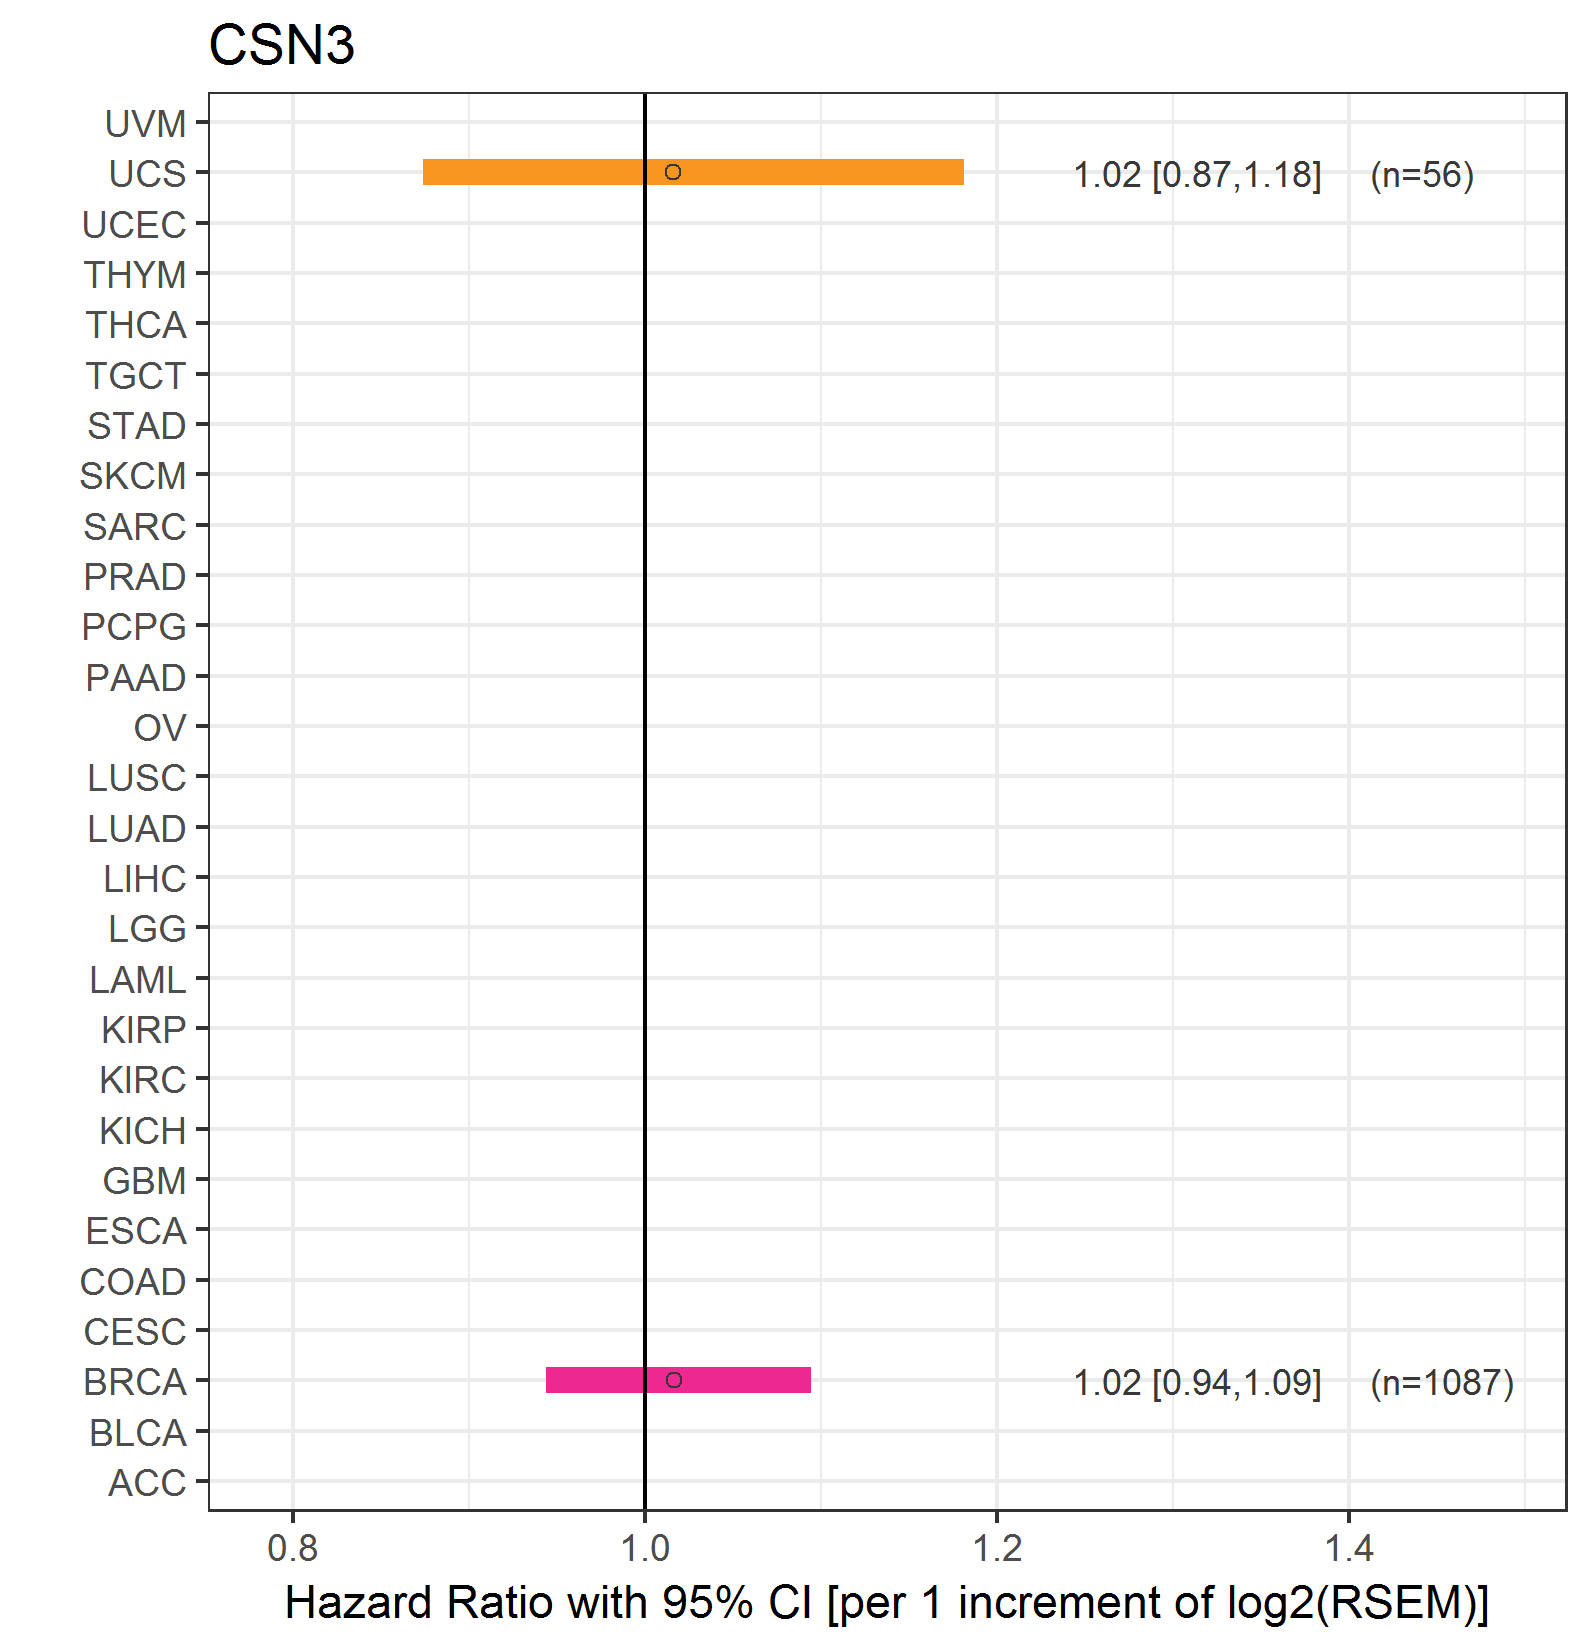
| Forest plot of Cox proportional hazard ratio (HR) and 95% CI of overall survival (OS) using 28 cancer types (TCGA IlluminaHiSeq_RNASeqV2, pan-cancer normalized log2(norm_counts+1) data, version 2016-08-16) (TCGA clinicalMatrix, phenotype data, version 2016-04-27) * Click on the image enlarge it in a new window. |
 |
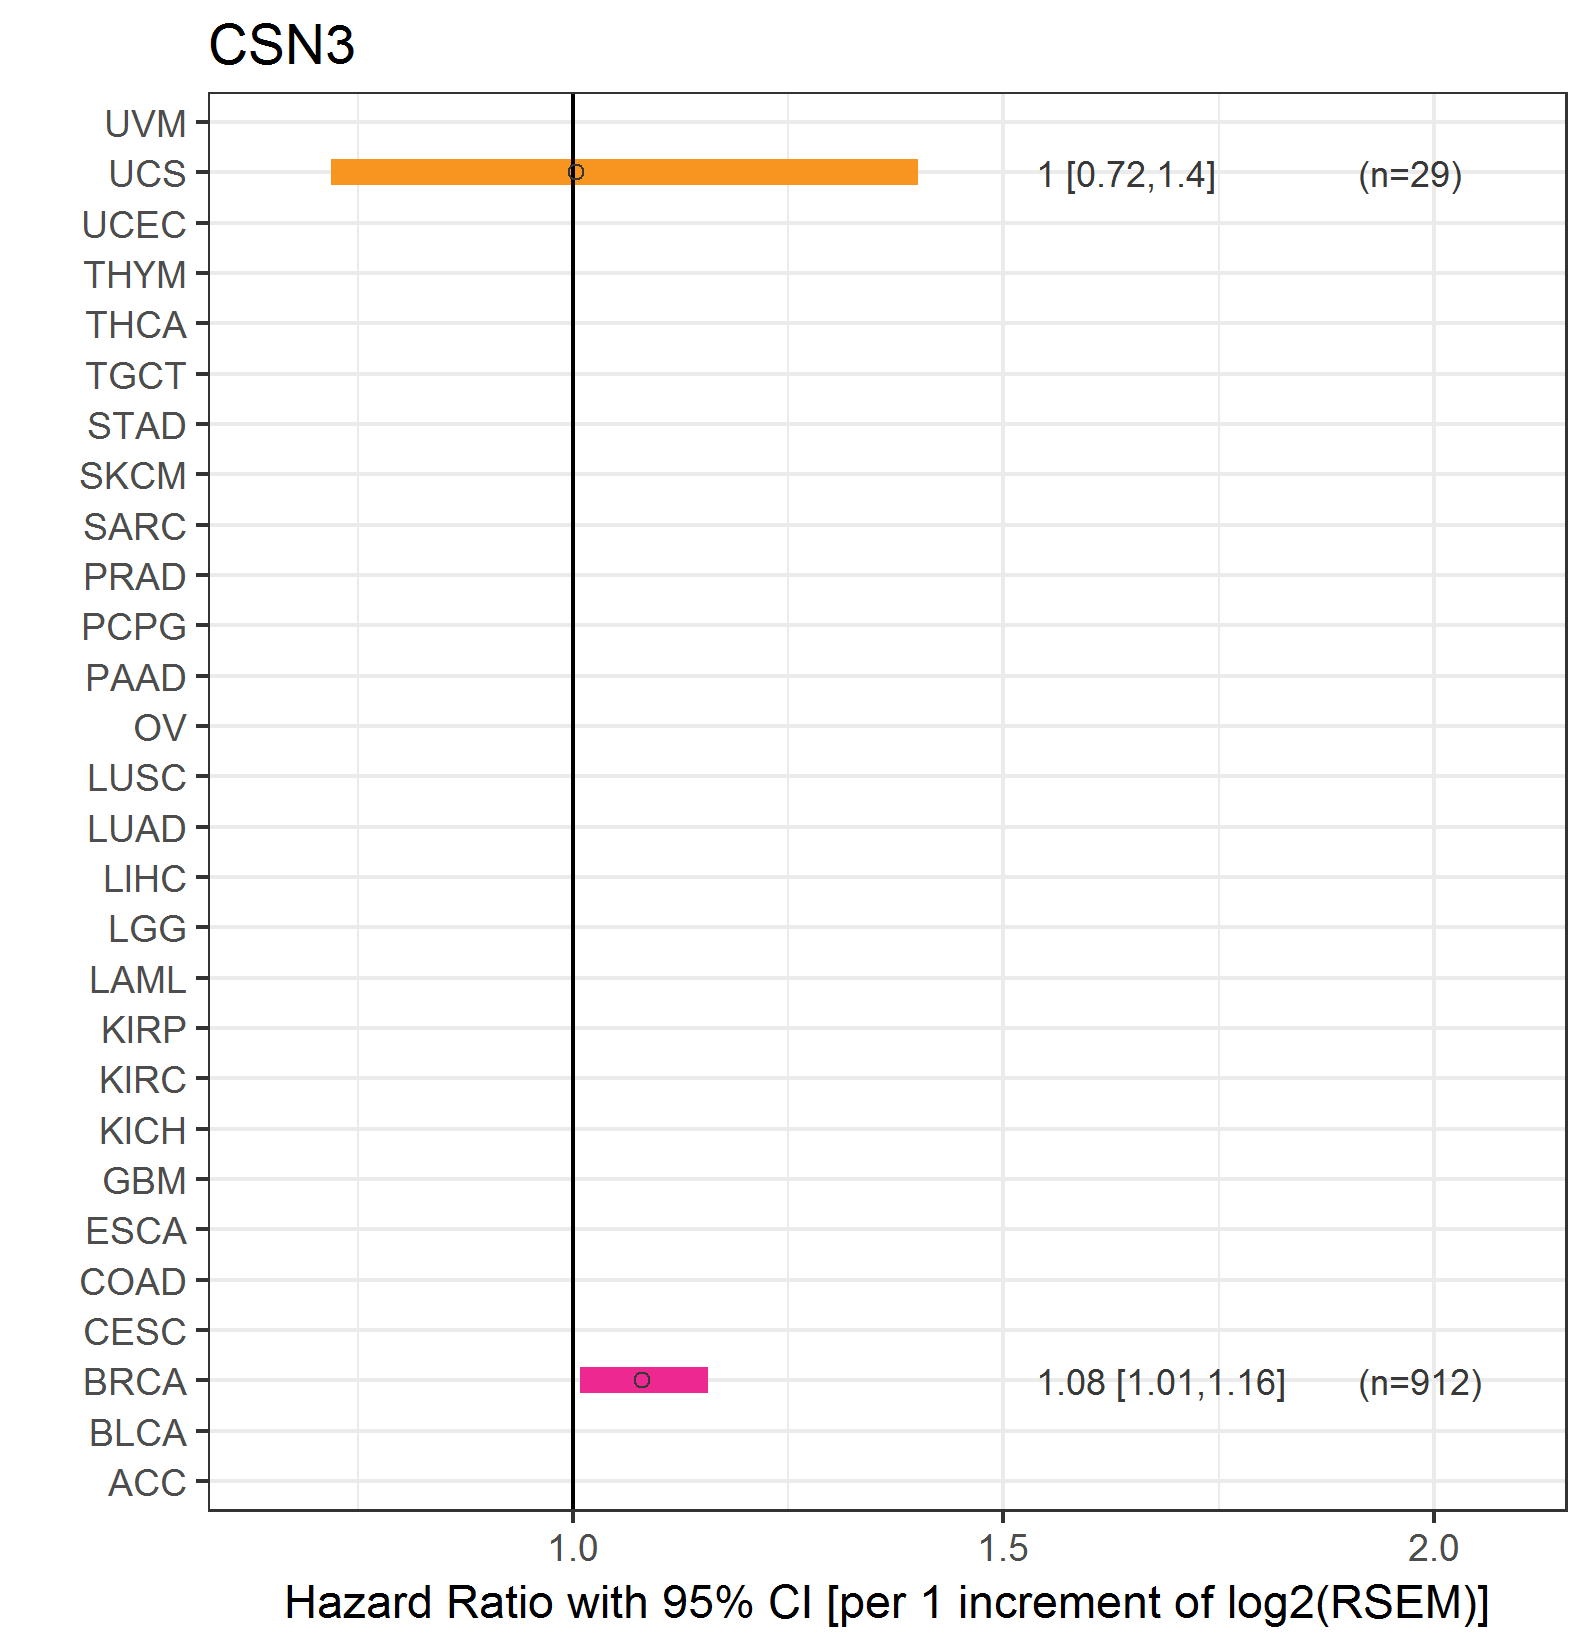
| Forest plot of Cox proportional hazard ratio (HR) and 95% CI of relapse free survival (RFS) using 28 cancer types (TCGA IlluminaHiSeq_RNASeqV2, pan-cancer normalized log2(norm_counts+1) data, version 2016-08-16) (TCGA clinicalMatrix, phenotype data, version 2016-04-27) * Click on the image enlarge it in a new window. |
 |
| Top |
| TissGeneClin for CSN3 |
| TissGeneDrug for CSN3 |
| Drug information targeting TissGene (DrugBank Version 5.0.6, 2017-04-01) |
| DrugBank ID | Drug name | Drug activity | Drug type | Drug status |
| Top |
| TissGeneDisease for CSN3 |
| Disease information associated with TissGene (DisGeNet, 2016-06-01) |
| Disease ID | Disease name | # pubmeds | Source |
| umls:C0025958 | Microcephaly | 4 | BeFree |
| umls:C0266470 | Cerebellar Hypoplasia | 3 | BeFree |
| umls:C1136249 | Mental Retardation, X-Linked | 3 | BeFree |
| umls:C0028738 | Nystagmus | 2 | BeFree |
| umls:C0036857 | Severe mental retardation (I.Q. 20-34) | 2 | BeFree |
| umls:C0220769 | FG syndrome | 2 | BeFree |
| umls:C0266449 | Congenital anomaly of brain | 2 | BeFree |
| umls:C0266468 | Congenital pontocerebellar hypoplasia | 2 | BeFree |
| umls:C1261175 | Pontoneocerebellar hypoplasia | 2 | BeFree |
| umls:C3714756 | Intellectual Disability | 2 | BeFree |
| umls:C0006111 | Brain Diseases | 1 | BeFree |
| umls:C0023890 | Liver Cirrhosis | 1 | BeFree |
| umls:C0024667 | Animal Mammary Neoplasms | 1 | CTD_human |
| umls:C0024668 | Mammary Neoplasms, Experimental | 1 | CTD_human |
| umls:C0026769 | Multiple Sclerosis | 1 | BeFree |
| umls:C0029463 | Osteosarcoma | 1 | BeFree |
| umls:C0152018 | Esophageal carcinoma | 1 | BeFree |
| umls:C0266617 | Congenital anomaly of face | 1 | BeFree |
| umls:C0454651 | Specific language impairment | 1 | BeFree |
| umls:C0585442 | Osteosarcoma of bone | 1 | BeFree |
| umls:C0585539 | X-Linked Infantile Nystagmus | 1 | BeFree |
| umls:C0596263 | Carcinogenesis | 1 | BeFree |
| umls:C1510586 | Autism Spectrum Disorders | 1 | BeFree |
| umls:C1623038 | Cirrhosis | 1 | BeFree |
| umls:C2239176 | Liver carcinoma | 1 | BeFree |
|
Copyright 2016-Present - The University of Texas Health Science Center at Houston (UTHealth) Web File Viewing | How to Report, Fraud, Waste and Abuse | State of Texas | Statewide Search | Texas Homeland Security | Site Policies |