 |
| |
| |
| |
| |
| |
| |
|

| TissGeneSummary for SLC47A2 |
 Gene summary Gene summary |
| Basic gene information | Gene symbol | SLC47A2 |
| Gene name | solute carrier family 47 (multidrug and toxin extrusion), member 2 | |
| Synonyms | MATE2|MATE2-B|MATE2-K|MATE2K | |
| Cytomap | UCSC genome browser: 17p11.2 | |
| Type of gene | protein-coding | |
| RefGenes | NM_001099646.1, NM_001256663.1,NM_152908.3, | |
| Description | H+/organic cation antiporterMATE-2hMATE-2kidney-specific H(+)/organic cation antiportermultidrug and toxin extrusion 2multidrug and toxin extrusion protein 2solute carrier family 47, member 2 | |
| Modification date | 20141207 | |
| dbXrefs | MIM : 609833 | |
| HGNC : HGNC | ||
| Ensembl : ENSG00000180638 | ||
| HPRD : 08710 | ||
| Vega : OTTHUMG00000059464 | ||
| Protein | UniProt: go to UniProt's Cross Reference DB Table | |
| Expression | CleanEX: HS_SLC47A2 | |
| BioGPS: 146802 | ||
| Pathway | NCI Pathway Interaction Database: SLC47A2 | |
| KEGG: SLC47A2 | ||
| REACTOME: SLC47A2 | ||
| Pathway Commons: SLC47A2 | ||
| Context | iHOP: SLC47A2 | |
| ligand binding site mutation search in PubMed: SLC47A2 | ||
| UCL Cancer Institute: SLC47A2 | ||
| Assigned class in TissGDB* | C | |
| Included tissue-specific gene expression resources | TiGER,GTEx | |
| Specific-tissues in normal samples (assigned by TissGDB using HPA, TiGER, and GTEx) | Kidney | |
| Cancer types related to the specific-tissues in cancer samples (assigned by TissGDB using TCGA) | KIRC,KIRP,KICH | |
| Reference showing the relevant tissue of SLC47A2 | ||
| Description by TissGene annotations | Fused withTSGene | |
| * Class A consists of genes with literature evidence and is part of the cTissGenes. Class B consists of only cTissGenes without additional evidence. The remaining genes belong to Class C. |
| Gene ontology having evidence of Inferred from Direct Assay (IDA) from Entrez |
| GO ID | GO term | PubMed ID |
| Top |
| TissGeneExp for SLC47A2 |
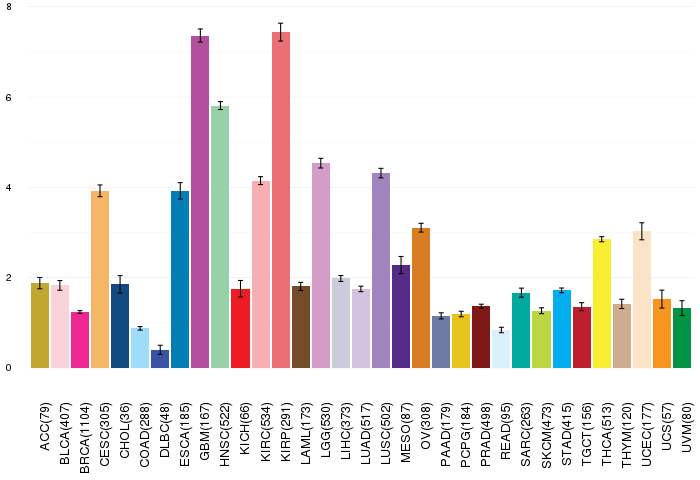
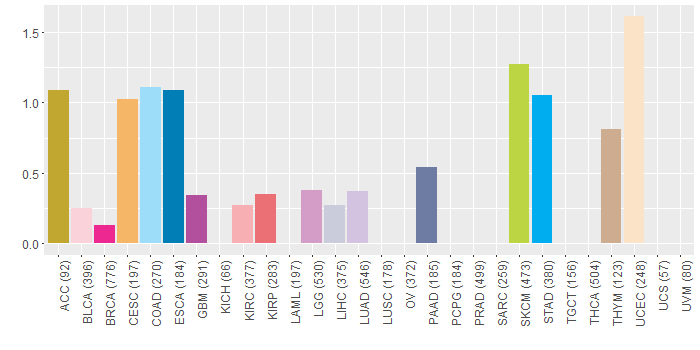
| Gene expressions across 28 cancer types (X-axis: cancer type and Y-axis: log2(norm_counts+1)) (TCGA IlluminaHiSeq_RNASeqV2, pan-cancer normalized log2(norm_counts+1) data, version 2016-08-16) |
 |
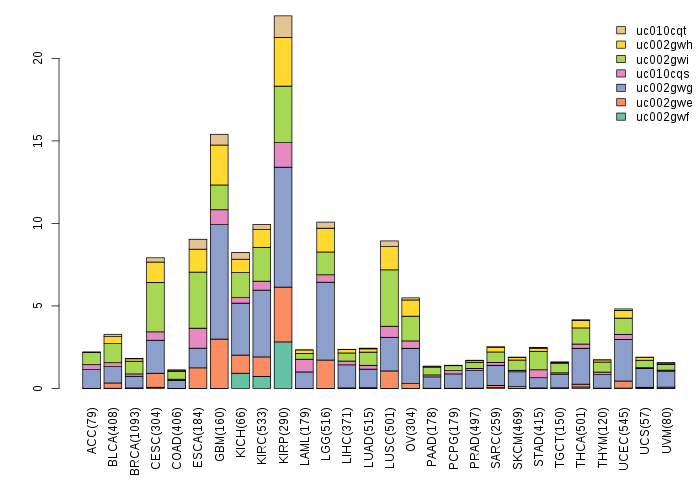
| Gene isoform expressions across 28 cancer types (X-axis: cancer type and Y-axis: log2(norm_counts+1)) (TCGA pan-cancer tcga_rsem_isoform_tpm, version 2016-09-01) |
 |
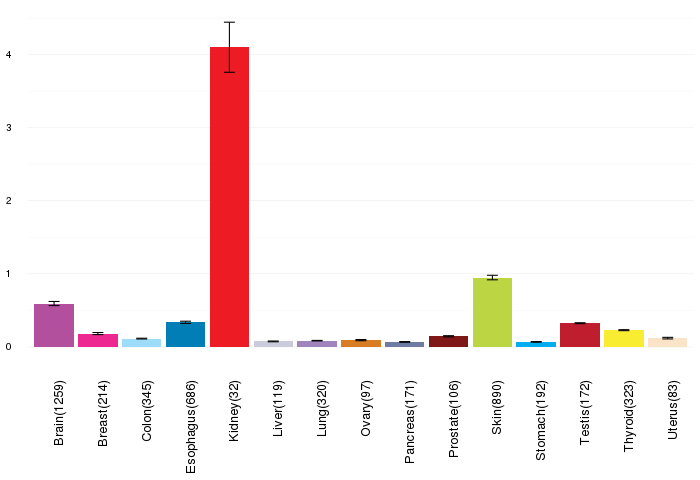
| Gene expressions across normal tissues of GTEx data (GTEx GTEx_Analysis_v6_RNA-seq_RNA-SeQCv1.1.8_gene_rpkm.gct) - Here, we shows the matched tissue types only among our 28 cancer types. |
 |
| Different expressions across 14 cancer types with more than 10 samples between matched tumors and normals (X-axis: cancer type and Y-axis: log2(norm_counts+1)) (TCGA IlluminaHiSeq_RNASeqV2, pan-cancer normalized log2(norm_counts+1) data, version 2016-08-16) |
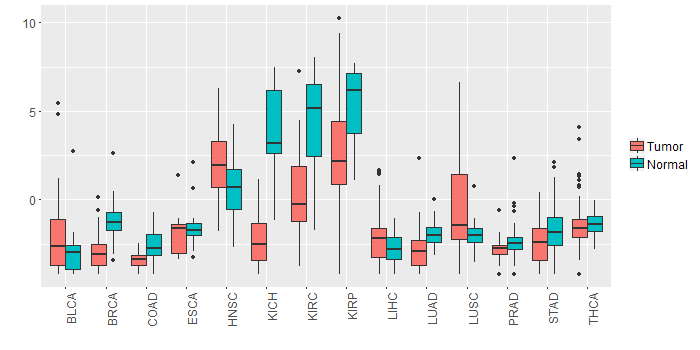 |
| - Significantly differentially expressed cancer types and information. (|Fold change|>1 and FDR<0.05) |
| Cancer type | Mean(exp) in tumor | Mean(exp) in matched normal | Log2FC | P-val. | FDR |
| BRCA | -3.017317971 | -1.241526743 | -1.775791228 | 2.17E-37 | 4.94E-36 |
| KIRC | 0.166492117 | 4.537532394 | -4.371040278 | 1.29E-21 | 1.13E-20 |
| KICH | -2.216068883 | 3.917043117 | -6.133112 | 7.42E-14 | 1.11E-12 |
| KIRP | 2.704917117 | 5.304204617 | -2.5992875 | 0.000897 | 0.002504451 |
| HNSC | 2.062797349 | 0.675678745 | 1.387118605 | 0.000465 | 0.001752513 |
| LUSC | -0.351266217 | -2.002152491 | 1.650886275 | 5.17E-05 | 0.00011015 |
| Top |
| TissGene-miRNA for SLC47A2 |
| Significantly anti-correlated miRNAs of TissGene across 28 cancer types (Gene-miRNA relations from TargetScanHuman Relsease 7.1, Conserved_Site_Context_Scores.txt.zip, 06.01.2016) (TCGA IlluminaHiSeq_miRNASeq, log2(RPM+1) data, version 2016-11-21) (TCGA IlluminaHiSeq_RNASeqV2, log2(normalized_count+1) data, version 2016-08-16) (Spearman’s Rank Correlation (p-value<0.05 and coefficient<-0.25)) |
| Cancer type | miRNA id | miRNA accession | P-val. | Coeff. | # samples |
| Top |
| TissGeneMut for SLC47A2 |
| TissGeneSNV for SLC47A2 |
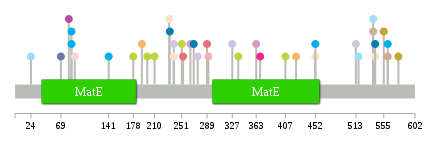
| nsSNV counts per each loci. Different colors of circles represent different cancer types. Circle size denotes number of samples. (TCGA somatic mutation (SNPs and small INDELs) data, version 2016-04-25) * Click on the image to enlarge it in a new window. |
 |
 |
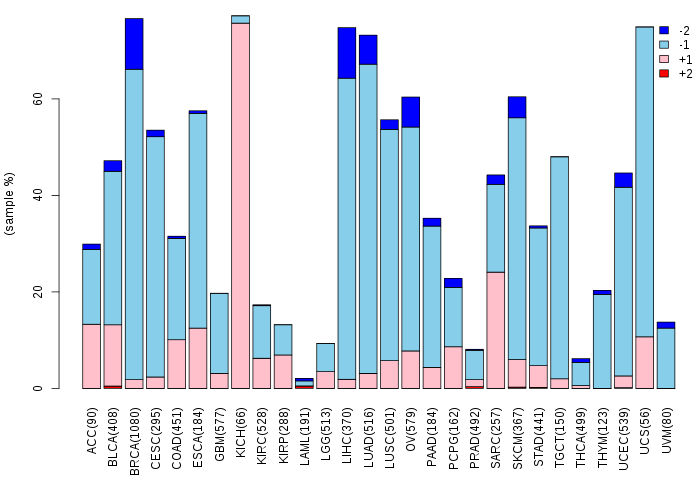
| Somatic nucleotide variants of TissGene across 28 cancer types (X-axis: cancer type and Y-axis: % of mutated samples) The numbers in parentheses are numbers of samples with mutation (nsSNVs). (TCGA somatic mutation (SNPs and small INDELs) data, version 2016-04-25) |
 |
| - nsSNVs sorted by frequency. |
| AAchange | Cancer type | # samples |
| p.A539T | COAD | 1 |
| p.G407E | SKCM | 1 |
| p.R141Q | STAD | 1 |
| p.L269Q | ESCA | 1 |
| p.A336V | SKCM | 1 |
| p.G85X | STAD | 1 |
| p.P24H | COAD | 1 |
| p.G289R | KIRP | 1 |
| p.I364R | CHOL | 1 |
| p.L363P | LGG | 1 |
| p.V369I | BRCA | 1 |
| p.R555C | ACC | 1 |
| p.E275D | LUAD | 1 |
| p.V232A | UCEC | 1 |
| p.S90L | BLCA | 1 |
| p.F517I | COAD | 1 |
| p.I423M | CESC | 1 |
| p.D251N | SKCM | 1 |
| p.I386R | CHOL | 1 |
| p.S191* | CESC | 1 |
| p.H210Y | SKCM | 1 |
| p.F291L | KIRC | 1 |
| p.L264I | LGG | 1 |
| p.G81R | GBM | 1 |
| p.G253R | KIRP | 1 |
| p.T542M | UCEC | 1 |
| p.A539T | THYM | 1 |
| p.G85* | STAD | 1 |
| p.S239Y | UCEC | 1 |
| p.T542K | ESCA | 1 |
| p.P199S | SKCM | 1 |
| p.G452C | UCEC | 1 |
| p.A561T | THYM | 1 |
| p.G178V | SKCM | 1 |
| p.E239D | LUAD | 1 |
| p.R577C | ACC | 1 |
| p.A561T | STAD | 1 |
| p.S69L | PAAD | 1 |
| p.C327S | LUAD | 1 |
| p.G452S | STAD | 1 |
| p.L233Q | ESCA | 1 |
| p.A513S | LIHC | 1 |
| Top |
| TissGeneCNV for SLC47A2 |
| Copy number variations of TissGene across 28 cancer types (X-axis: cancer type and Y-axis: % of CNV samples) (TCGA Gistic2_CopyNumber_Gistic2_all_data_by_genes, Gistic2 copy number data, version 2016-08-16) |
 |
| Top |
| TissGeneFusions for SLC47A2 |
| Fusion genes including TissGene (ChimerDB 3.0, 2016-12-01 and TCGA fusion Portal 2015-12-01) |
| Database | Src | Cancer type | Sample | Fusion gene | ORF | 5'-gene BP | 3'-gene BP |
| TCGAfusionPortal | PRADA | BRCA | TCGA-OL-A5RZ-01A | RASSF8-SLC47A2 | 5UTR-CDS | Chr12:26112081 | Chr17:19584983 |
| Top |
| TissGeneNet for SLC47A2 |
| Co-expressed gene networks based on protein-protein interaction data (CePIN) (TCGA IlluminaHiSeq_RNASeqV2, pan-cancer normalized log2(norm_counts+1) data, version 2016-08-16) (PINA2 ppi data) |
| Top |
| TissGeneProg for SLC47A2 |
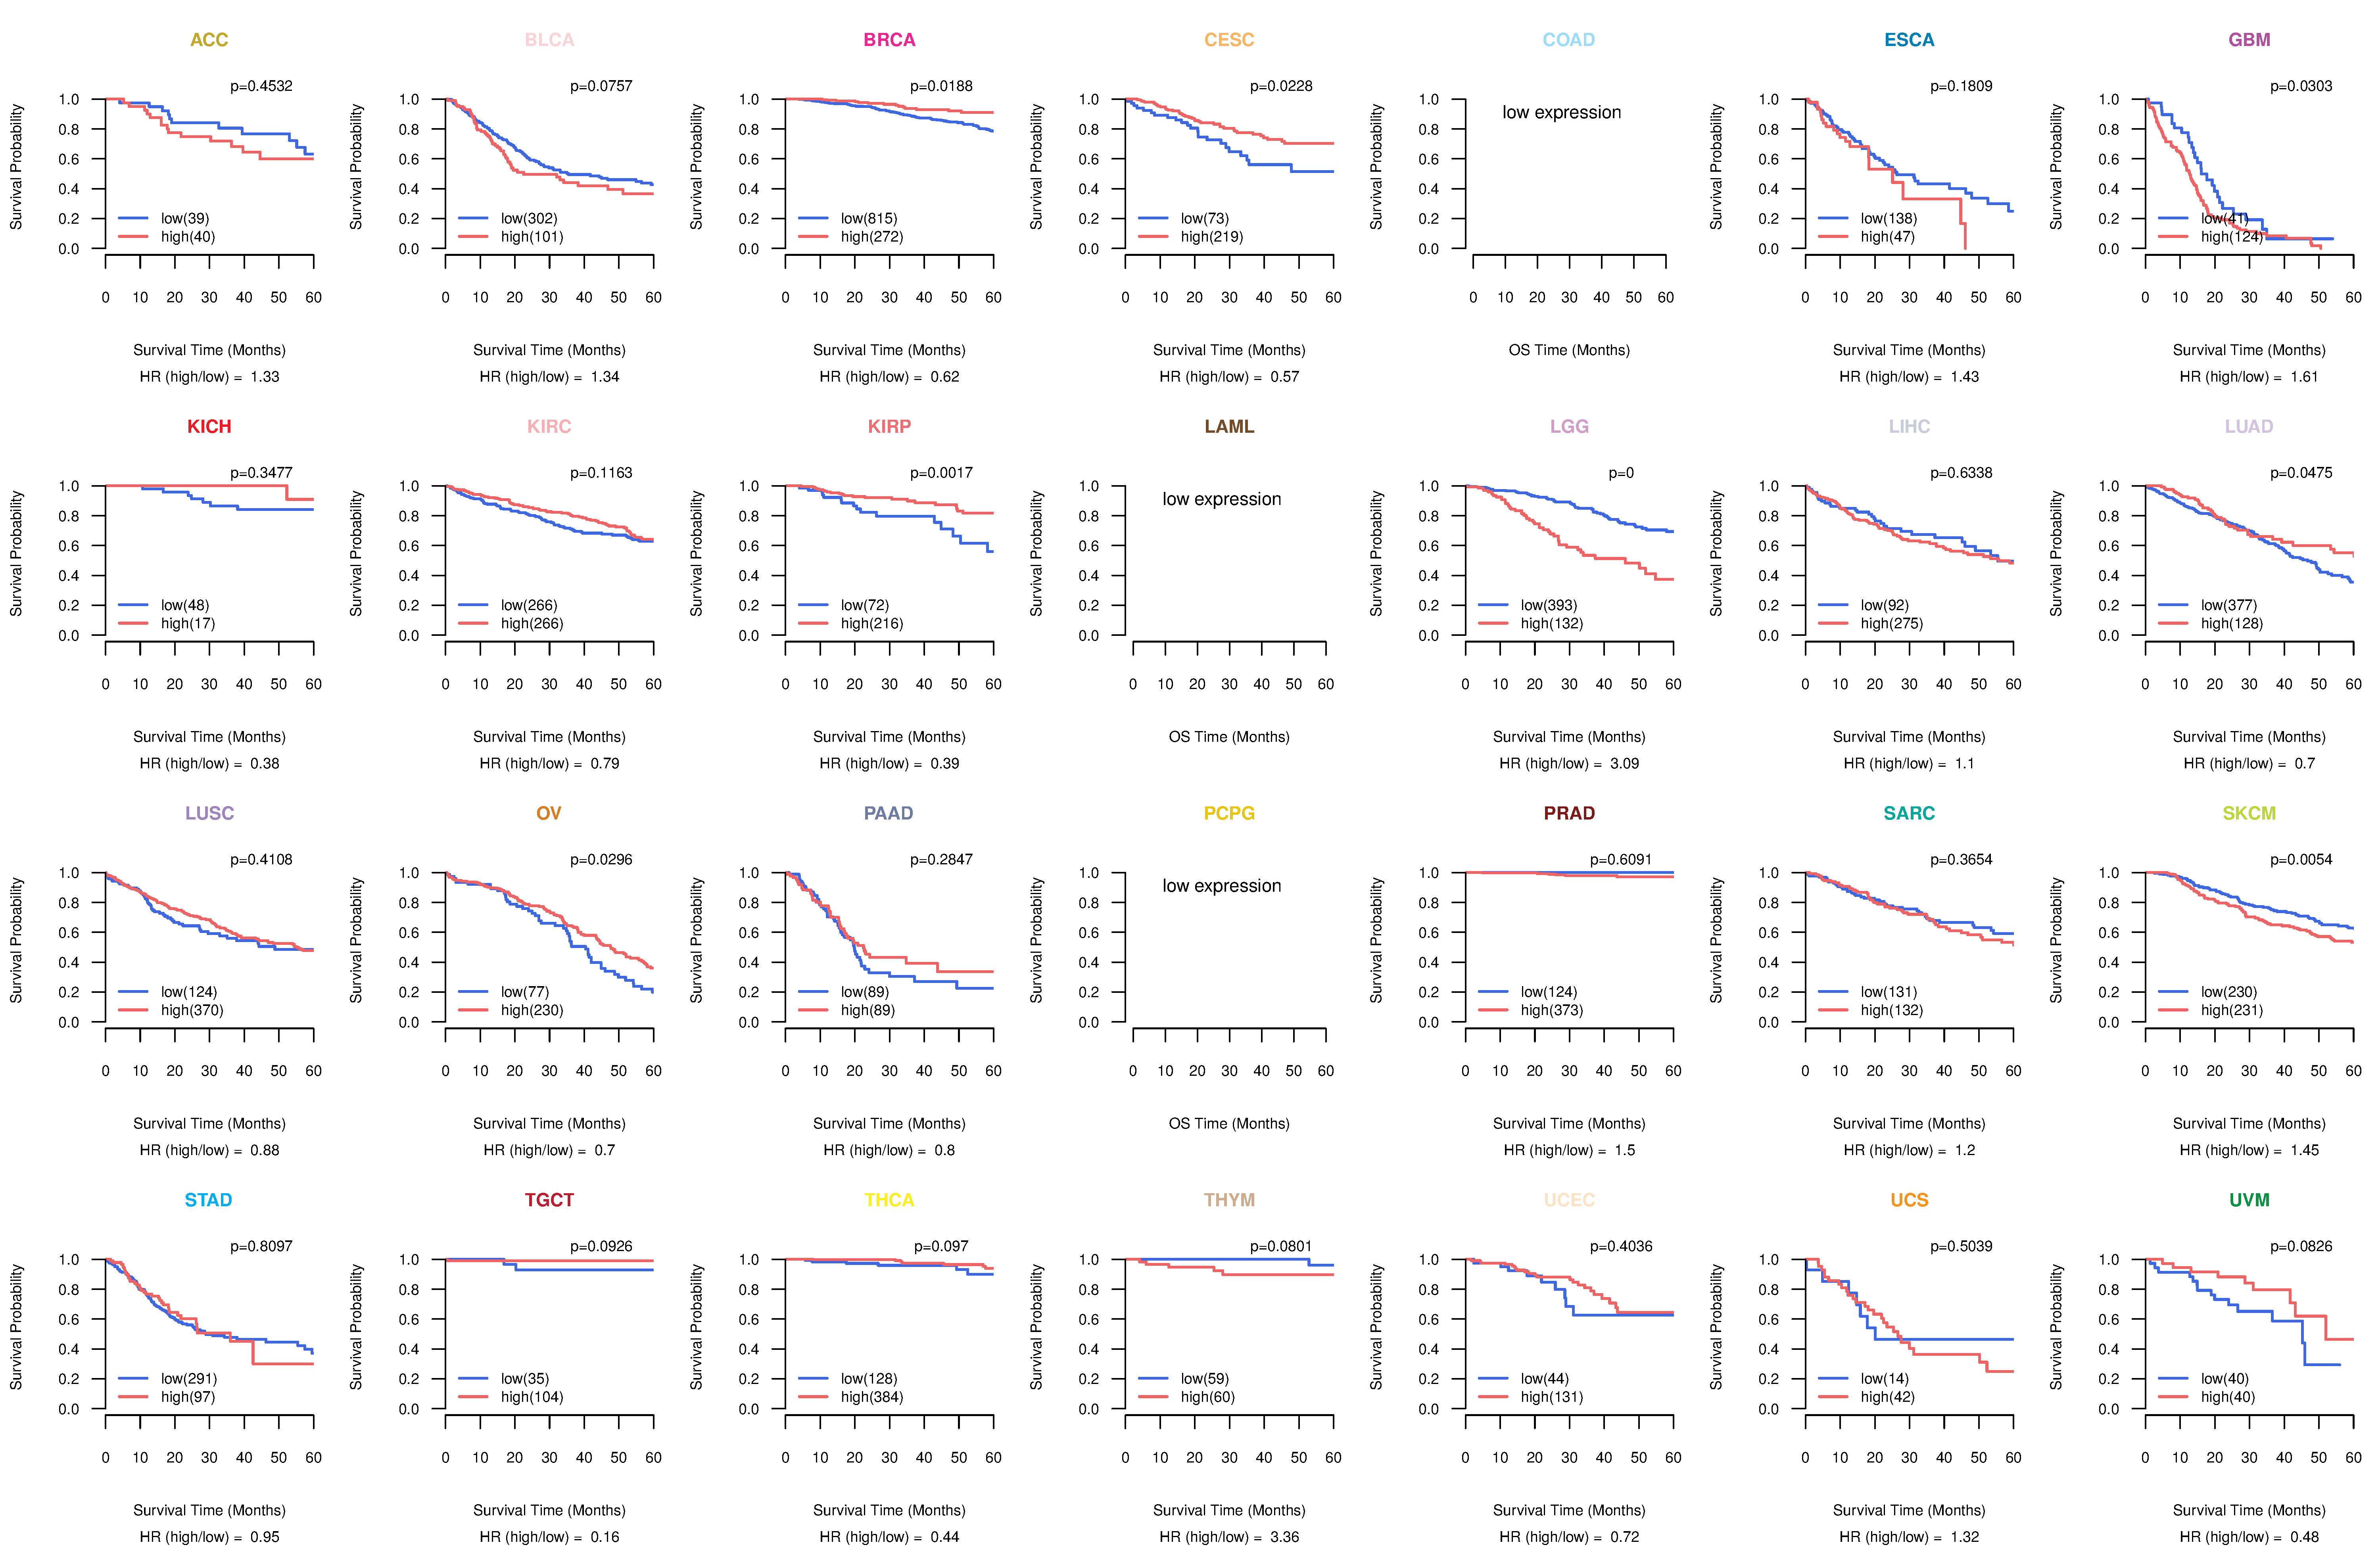
| Kaplan-Meier plots with logrank tests of overall survival (OS) using 28 cancer types (TCGA IlluminaHiSeq_RNASeqV2, pan-cancer normalized log2(norm_counts+1) data, version 2016-08-16) (TCGA clinicalMatrix, phenotype data, version 2016-04-27) * Click on the image to enlarge it in a new window. |
 |
| Kaplan-Meier plots with logrank test of relapse free survival (RFS) using 28 cancer types (TCGA IlluminaHiSeq_RNASeqV2, pan-cancer normalized log2(norm_counts+1) data, version 2016-08-16) (TCGA clinicalMatrix, phenotype data, version 2016-04-27) * Click on the image enlarge it in a new window. |
 |
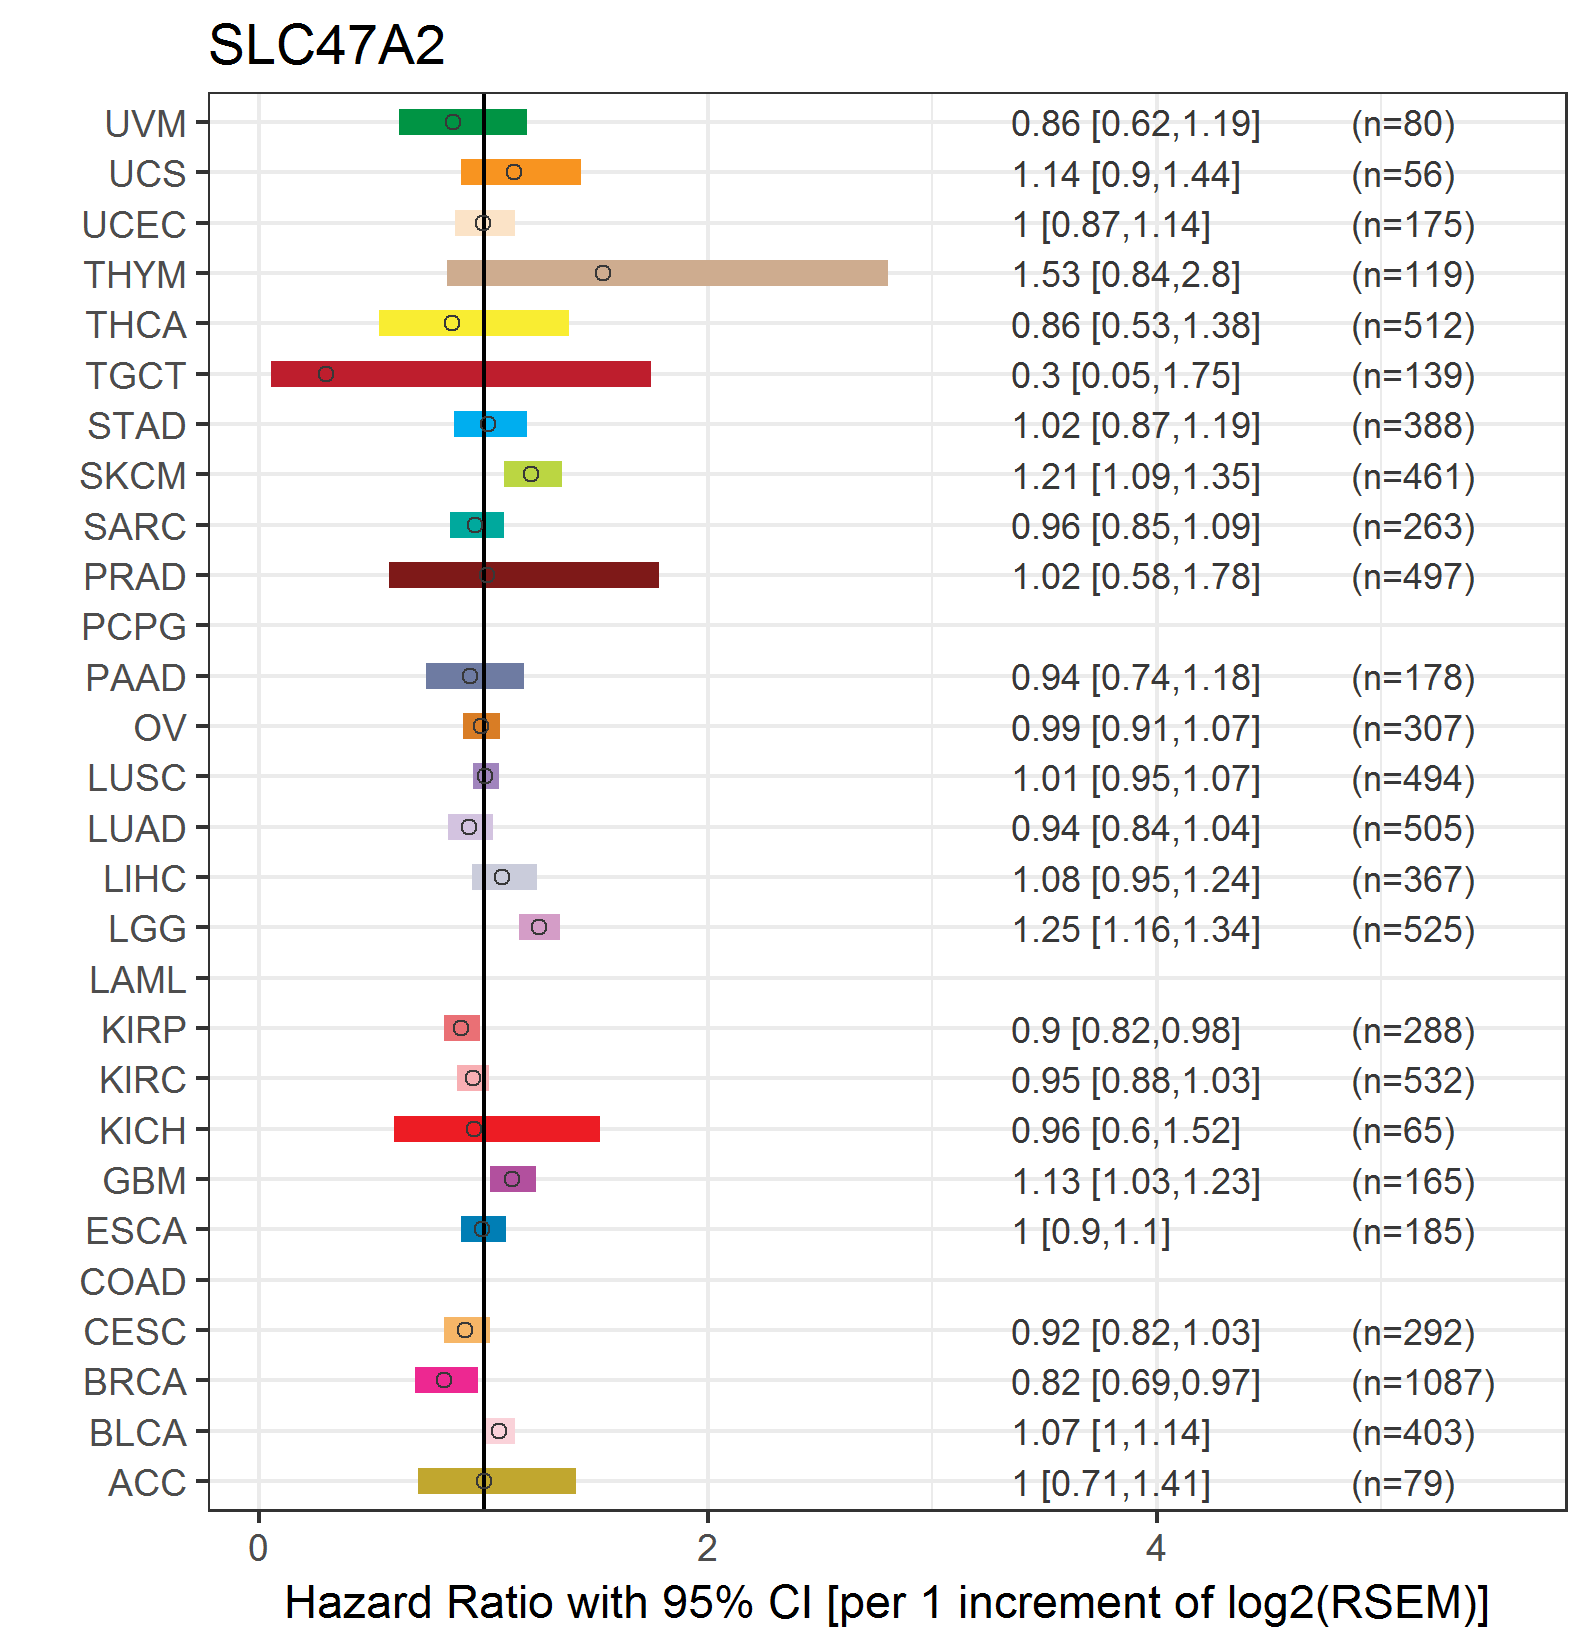
| Forest plot of Cox proportional hazard ratio (HR) and 95% CI of overall survival (OS) using 28 cancer types (TCGA IlluminaHiSeq_RNASeqV2, pan-cancer normalized log2(norm_counts+1) data, version 2016-08-16) (TCGA clinicalMatrix, phenotype data, version 2016-04-27) * Click on the image enlarge it in a new window. |
 |
| Forest plot of Cox proportional hazard ratio (HR) and 95% CI of relapse free survival (RFS) using 28 cancer types (TCGA IlluminaHiSeq_RNASeqV2, pan-cancer normalized log2(norm_counts+1) data, version 2016-08-16) (TCGA clinicalMatrix, phenotype data, version 2016-04-27) * Click on the image enlarge it in a new window. |
 |
| Top |
| TissGeneClin for SLC47A2 |
| TissGeneDrug for SLC47A2 |
| Drug information targeting TissGene (DrugBank Version 5.0.6, 2017-04-01) |
| DrugBank ID | Drug name | Drug activity | Drug type | Drug status |
| Top |
| TissGeneDisease for SLC47A2 |
| Disease information associated with TissGene (DisGeNet, 2016-06-01) |
| Disease ID | Disease name | # pubmeds | Source |
| umls:C0040336 | Tobacco Use Disorder | 1 | GAD |
|
Copyright 2016-Present - The University of Texas Health Science Center at Houston (UTHealth) Web File Viewing | How to Report, Fraud, Waste and Abuse | State of Texas | Statewide Search | Texas Homeland Security | Site Policies |