 |
| |
| |
| |
| |
| |
| |
|

| TissGeneSummary for CST1 |
 Gene summary Gene summary |
| Basic gene information | Gene symbol | CST1 |
| Gene name | cystatin SN | |
| Synonyms | - | |
| Cytomap | UCSC genome browser: 20p11.21 | |
| Type of gene | protein-coding | |
| RefGenes | NM_001898.2, | |
| Description | cystain-SA-Icystatin 1cystatin SA-Icystatin-1cystatin-SNcysteine proteinase inhibitor, type 2 familysalivary cystatin-SA-1 | |
| Modification date | 20141207 | |
| dbXrefs | MIM : 123855 | |
| HGNC : HGNC | ||
| Ensembl : ENSG00000170373 | ||
| HPRD : 00460 | ||
| Vega : OTTHUMG00000032085 | ||
| Protein | UniProt: go to UniProt's Cross Reference DB Table | |
| Expression | CleanEX: HS_CST1 | |
| BioGPS: 1469 | ||
| Pathway | NCI Pathway Interaction Database: CST1 | |
| KEGG: CST1 | ||
| REACTOME: CST1 | ||
| Pathway Commons: CST1 | ||
| Context | iHOP: CST1 | |
| ligand binding site mutation search in PubMed: CST1 | ||
| UCL Cancer Institute: CST1 | ||
| Assigned class in TissGDB* | C | |
| Included tissue-specific gene expression resources | TiGER,GTEx | |
| Specific-tissues in normal samples (assigned by TissGDB using HPA, TiGER, and GTEx) | BladderColonProstate | |
| Cancer types related to the specific-tissues in cancer samples (assigned by TissGDB using TCGA) | BLCACOADPRAD | |
| Reference showing the relevant tissue of CST1 | ||
| Description by TissGene annotations | Cancer gene | |
| * Class A consists of genes with literature evidence and is part of the cTissGenes. Class B consists of only cTissGenes without additional evidence. The remaining genes belong to Class C. |
| Gene ontology having evidence of Inferred from Direct Assay (IDA) from Entrez |
| GO ID | GO term | PubMed ID | GO:0001580 | detection of chemical stimulus involved in sensory perception of bitter taste | 24248522 | GO:0001580 | detection of chemical stimulus involved in sensory perception of bitter taste | 24248522 |
| Top |
| TissGeneExp for CST1 |
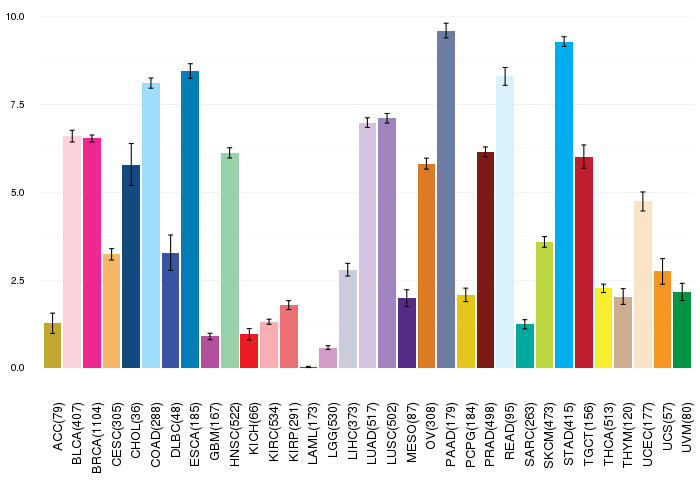
| Gene expressions across 28 cancer types (X-axis: cancer type and Y-axis: log2(norm_counts+1)) (TCGA IlluminaHiSeq_RNASeqV2, pan-cancer normalized log2(norm_counts+1) data, version 2016-08-16) |
 |
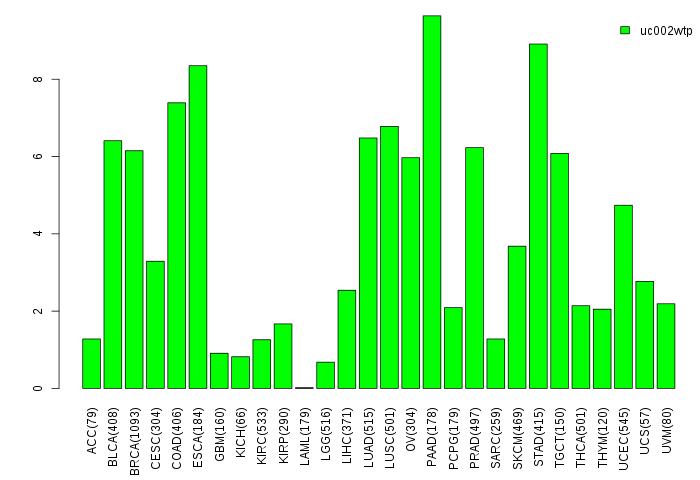
| Gene isoform expressions across 28 cancer types (X-axis: cancer type and Y-axis: log2(norm_counts+1)) (TCGA pan-cancer tcga_rsem_isoform_tpm, version 2016-09-01) |
 |
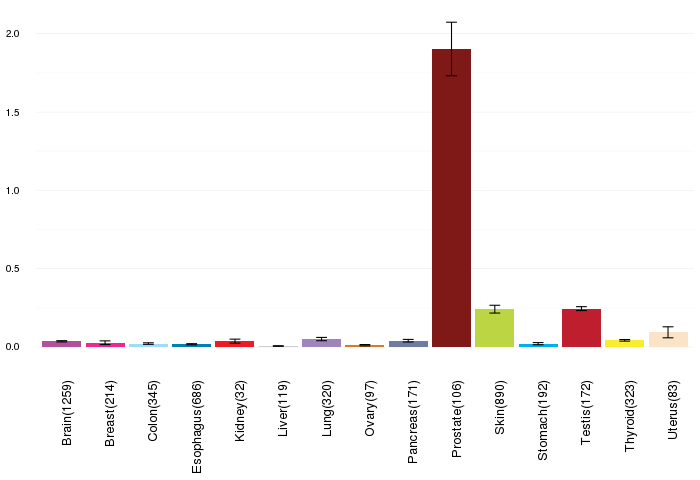
| Gene expressions across normal tissues of GTEx data (GTEx GTEx_Analysis_v6_RNA-seq_RNA-SeQCv1.1.8_gene_rpkm.gct) - Here, we shows the matched tissue types only among our 28 cancer types. |
 |
| Different expressions across 14 cancer types with more than 10 samples between matched tumors and normals (X-axis: cancer type and Y-axis: log2(norm_counts+1)) (TCGA IlluminaHiSeq_RNASeqV2, pan-cancer normalized log2(norm_counts+1) data, version 2016-08-16) |
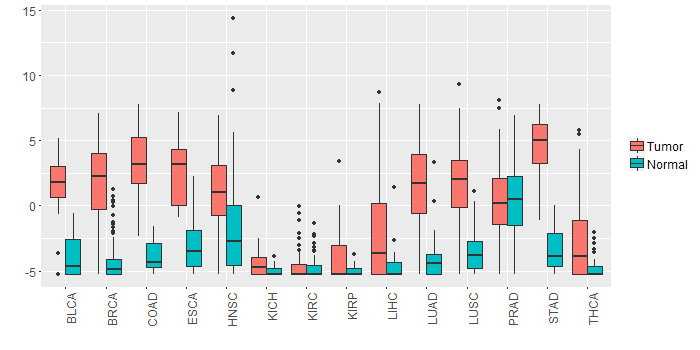 |
| - Significantly differentially expressed cancer types and information. (|Fold change|>1 and FDR<0.05) |
| Cancer type | Mean(exp) in tumor | Mean(exp) in matched normal | Log2FC | P-val. | FDR |
| LUSC | 1.662886505 | -3.531411534 | 5.194298039 | 1.40E-15 | 9.44E-15 |
| THCA | -2.715341445 | -4.812178733 | 2.096837288 | 2.47E-06 | 8.91E-06 |
| LUAD | 1.505210981 | -4.104752812 | 5.609963793 | 3.92E-19 | 6.82E-18 |
| COAD | 3.28957557 | -3.879143661 | 7.168719231 | 7.64E-15 | 3.80E-13 |
| STAD | 4.450677252 | -3.404313373 | 7.854990625 | 8.26E-22 | 1.86E-18 |
| BLCA | 1.388696825 | -3.877434754 | 5.266131579 | 2.15E-08 | 1.77E-06 |
| BRCA | 1.657306474 | -4.354522473 | 6.011828947 | 3.29E-44 | 1.35E-42 |
| HNSC | 0.981364389 | -1.217717006 | 2.199081395 | 0.0127 | 0.030206131 |
| ESCA | 2.771963332 | -2.949473032 | 5.721436364 | 5.94E-05 | 0.002183895 |
| LIHC | -2.254670123 | -4.640962123 | 2.386292 | 5.80E-05 | 0.000212571 |
| Top |
| TissGene-miRNA for CST1 |
| Significantly anti-correlated miRNAs of TissGene across 28 cancer types (Gene-miRNA relations from TargetScanHuman Relsease 7.1, Conserved_Site_Context_Scores.txt.zip, 06.01.2016) (TCGA IlluminaHiSeq_miRNASeq, log2(RPM+1) data, version 2016-11-21) (TCGA IlluminaHiSeq_RNASeqV2, log2(normalized_count+1) data, version 2016-08-16) (Spearman’s Rank Correlation (p-value<0.05 and coefficient<-0.25)) |
| Cancer type | miRNA id | miRNA accession | P-val. | Coeff. | # samples |
| Top |
| TissGeneMut for CST1 |
| TissGeneSNV for CST1 |
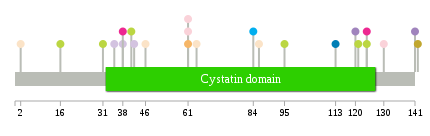
| nsSNV counts per each loci. Different colors of circles represent different cancer types. Circle size denotes number of samples. (TCGA somatic mutation (SNPs and small INDELs) data, version 2016-04-25) * Click on the image to enlarge it in a new window. |
 |
 |
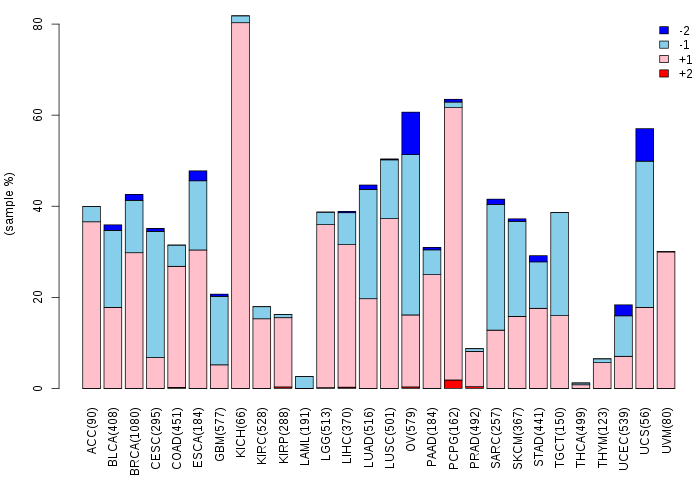
| Somatic nucleotide variants of TissGene across 28 cancer types (X-axis: cancer type and Y-axis: % of mutated samples) The numbers in parentheses are numbers of samples with mutation (nsSNVs). (TCGA somatic mutation (SNPs and small INDELs) data, version 2016-04-25) |
 |
| - nsSNVs sorted by frequency. |
| AAchange | Cancer type | # samples |
| p.E124K | SKCM | 1 |
| p.A2V | UCEC | 1 |
| p.F120L | LUSC | 1 |
| p.Q113H | HNSC | 1 |
| p.E124K | BRCA | 1 |
| p.T95I | SKCM | 1 |
| p.D61H | CESC | 1 |
| p.D38E | BRCA | 1 |
| p.N36K | HNSC | 1 |
| p.D38N | LUAD | 1 |
| p.D41N | SKCM | 1 |
| p.D86N | UCEC | 1 |
| p.A37T | HNSC | 1 |
| p.E121K | SKCM | 1 |
| p.R46C | UCEC | 1 |
| p.Y35S | LUAD | 1 |
| p.Q113H | ESCA | 1 |
| p.X142Y | ACC | 1 |
| p.R69Q | HNSC | 1 |
| p.R130T | BLCA | 1 |
| p.E42* | LUAD | 1 |
| p.D61H | BLCA | 1 |
| p.S141Y | LUSC | 1 |
| p.Y64H | UCEC | 1 |
| p.D61Y | BLCA | 1 |
| p.A16V | SKCM | 1 |
| p.P31S | SKCM | 1 |
| p.F84V | STAD | 1 |
| p.G32S | HNSC | 1 |
| p.R69W | READ | 1 |
| Top |
| TissGeneCNV for CST1 |
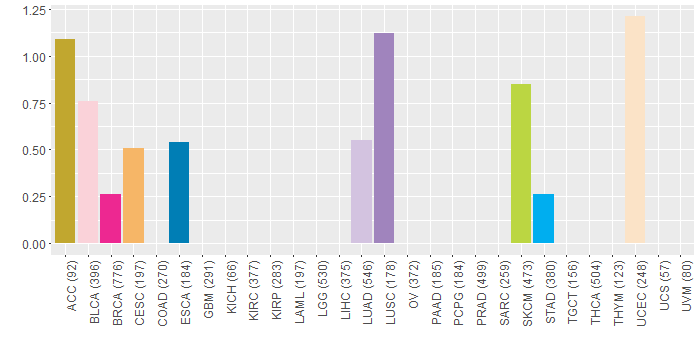
| Copy number variations of TissGene across 28 cancer types (X-axis: cancer type and Y-axis: % of CNV samples) (TCGA Gistic2_CopyNumber_Gistic2_all_data_by_genes, Gistic2 copy number data, version 2016-08-16) |
 |
| Top |
| TissGeneFusions for CST1 |
| Fusion genes including TissGene (ChimerDB 3.0, 2016-12-01 and TCGA fusion Portal 2015-12-01) |
| Database | Src | Cancer type | Sample | Fusion gene | ORF | 5'-gene BP | 3'-gene BP |
| Chimerdb3.0 | ChiTaRs | NA | BX648878 | CST1-BCLAF1 | chr20:23728288 | chr6:136579727 | |
| Chimerdb3.0 | ChiTaRs | NA | U37519 | CST1-ALDH3B2 | chr20:23728407 | chr11:67429637 |
| Top |
| TissGeneNet for CST1 |
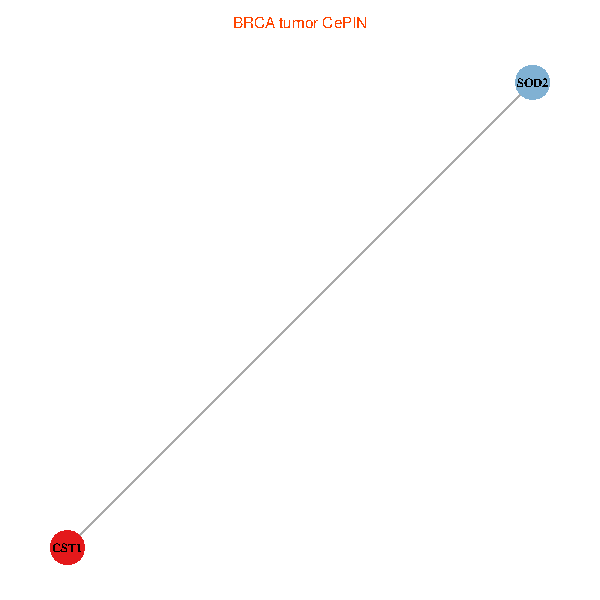
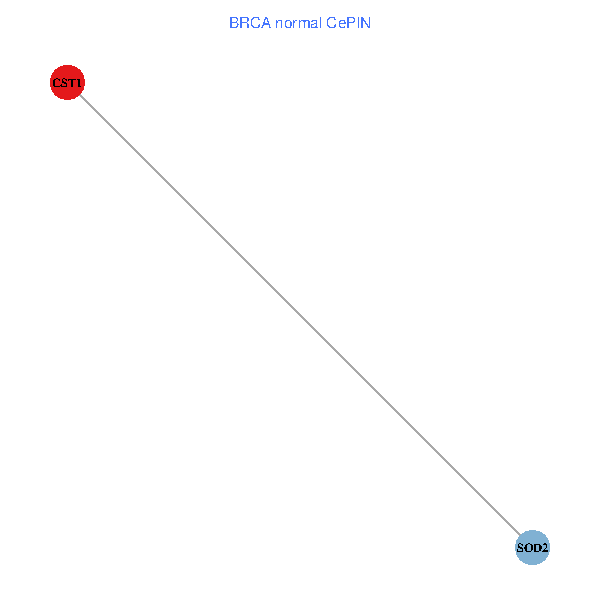
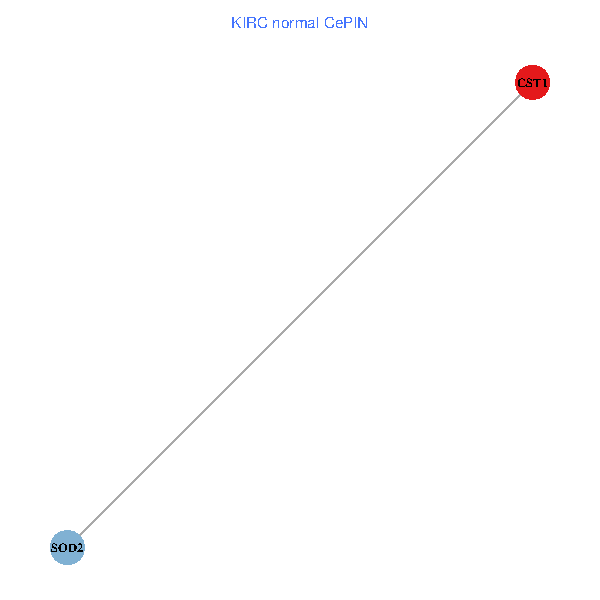
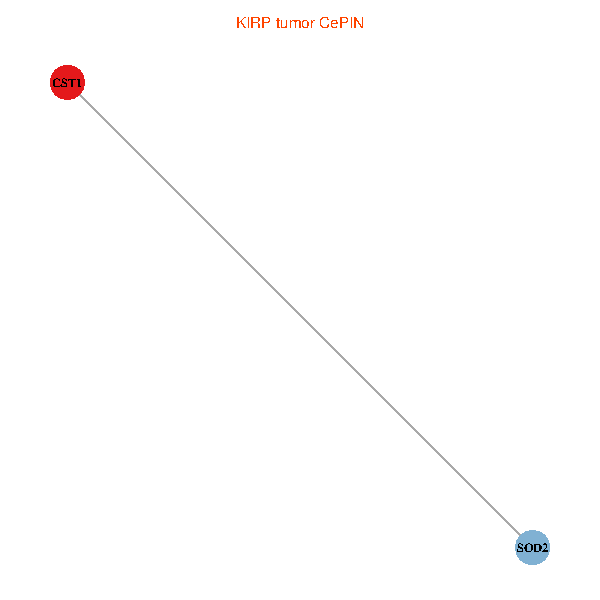
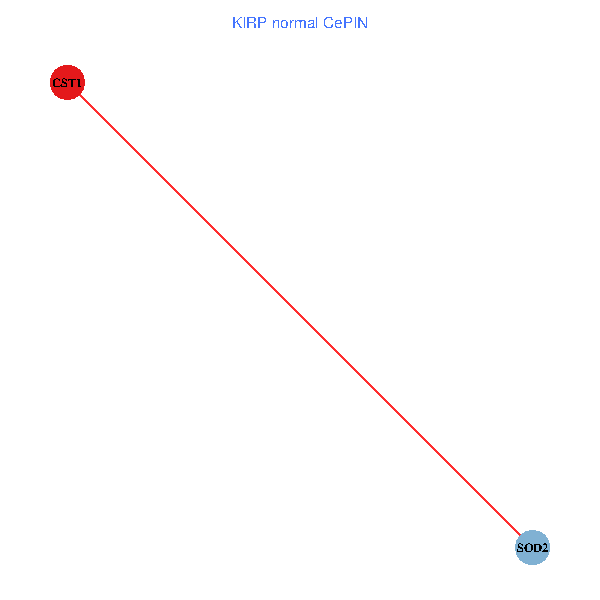
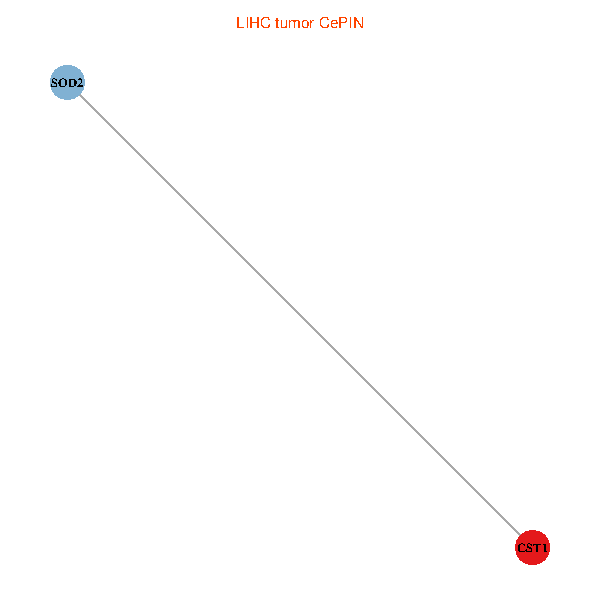
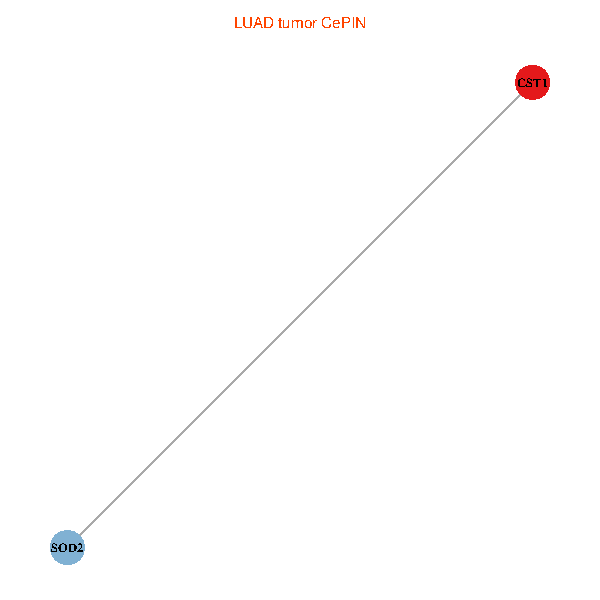
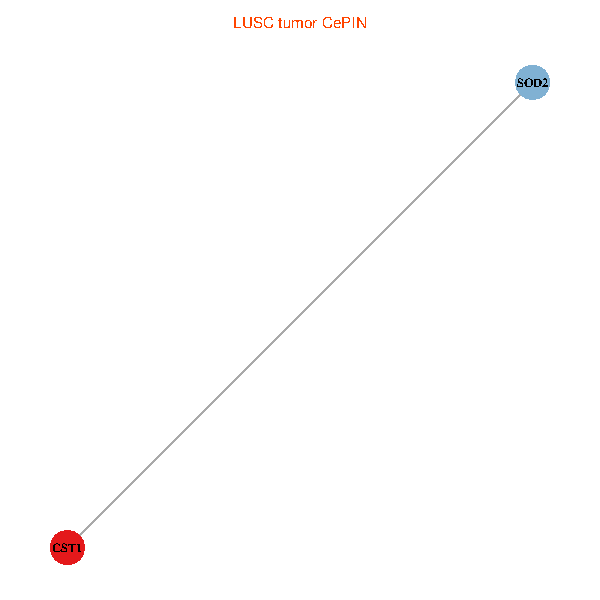
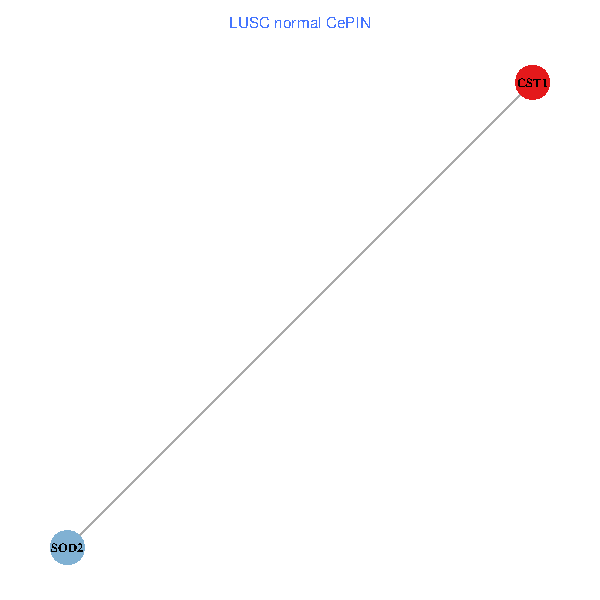
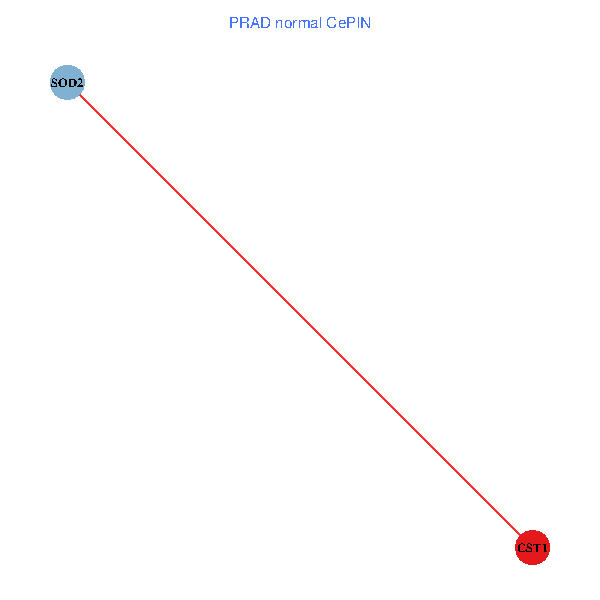
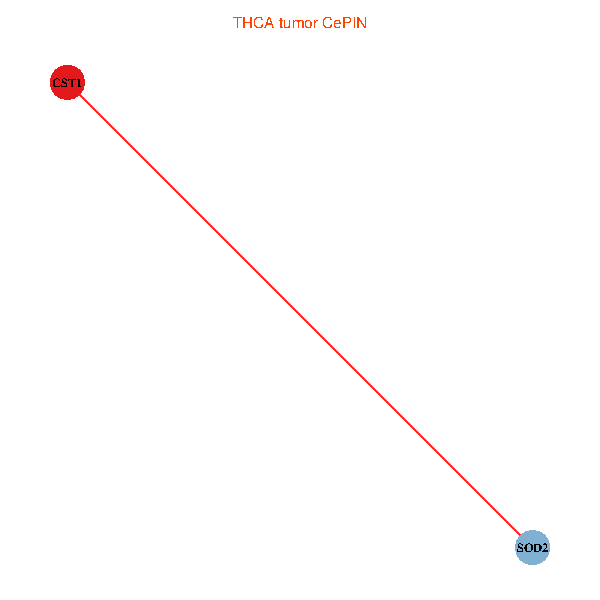
| Co-expressed gene networks based on protein-protein interaction data (CePIN) (TCGA IlluminaHiSeq_RNASeqV2, pan-cancer normalized log2(norm_counts+1) data, version 2016-08-16) (PINA2 ppi data) |
| BRCA (tumor) | BRCA (normal) |
| CST1, SOD2 (tumor) | CST1, SOD2 (normal) |
 |  |
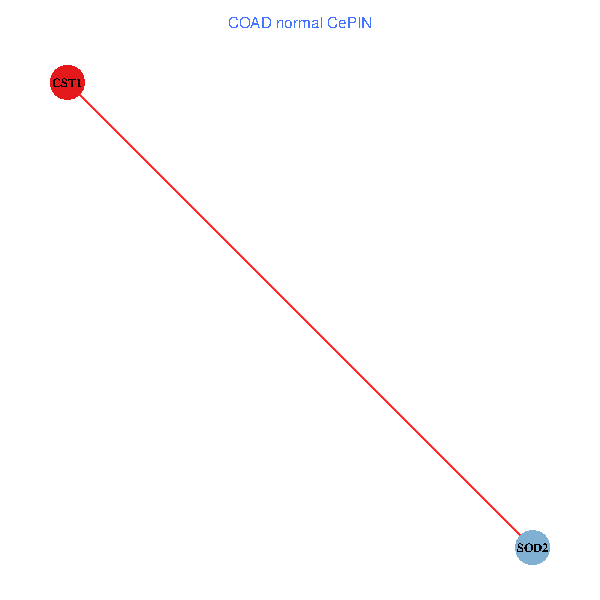
| COAD (tumor) | COAD (normal) |
| CST1, SOD2 (tumor) | CST1, SOD2 (normal) |
 |  |
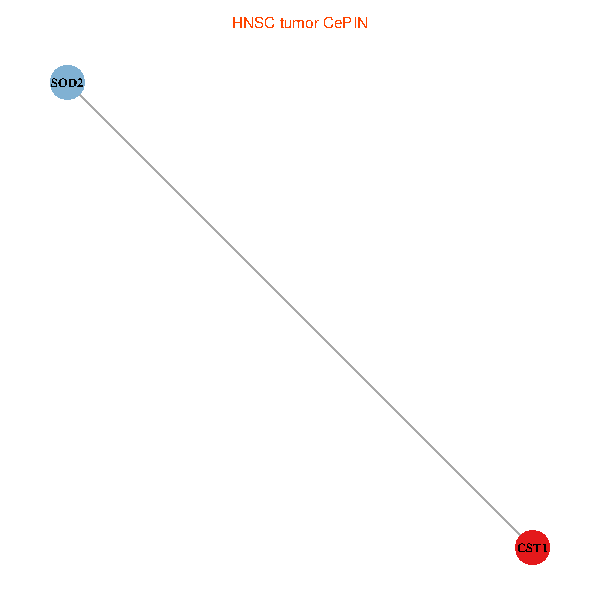
| HNSC (tumor) | HNSC (normal) |
| CST1, SOD2 (tumor) | CST1, SOD2 (normal) |
 |  |
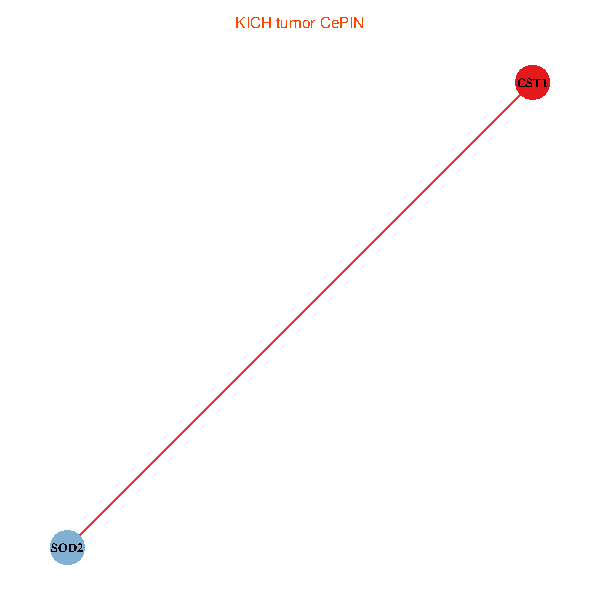
| KICH (tumor) | KICH (normal) |
| CST1, SOD2 (tumor) | CST1, SOD2 (normal) |
 |  |
| KIRC (tumor) | KIRC (normal) |
| CST1, SOD2 (tumor) | CST1, SOD2 (normal) |
 |  |
| KIRP (tumor) | KIRP (normal) |
| CST1, SOD2 (tumor) | CST1, SOD2 (normal) |
 |  |
| LIHC (tumor) | LIHC (normal) |
| CST1, SOD2 (tumor) | CST1, SOD2 (normal) |
 |  |
| LUAD (tumor) | LUAD (normal) |
| CST1, SOD2 (tumor) | CST1, SOD2 (normal) |
 |  |
| LUSC (tumor) | LUSC (normal) |
| CST1, SOD2 (tumor) | CST1, SOD2 (normal) |
 |  |
| PRAD (tumor) | PRAD (normal) |
| CST1, SOD2 (tumor) | CST1, SOD2 (normal) |
 |  |
| STAD (tumor) | STAD (normal) |
| CST1, SOD2 (tumor) | CST1, SOD2 (normal) |
 |  |
| THCA (tumor) | THCA (normal) |
| CST1, SOD2 (tumor) | CST1, SOD2 (normal) |
 |  |
| Top |
| TissGeneProg for CST1 |
| Kaplan-Meier plots with logrank tests of overall survival (OS) using 28 cancer types (TCGA IlluminaHiSeq_RNASeqV2, pan-cancer normalized log2(norm_counts+1) data, version 2016-08-16) (TCGA clinicalMatrix, phenotype data, version 2016-04-27) * Click on the image to enlarge it in a new window. |
 |
| Kaplan-Meier plots with logrank test of relapse free survival (RFS) using 28 cancer types (TCGA IlluminaHiSeq_RNASeqV2, pan-cancer normalized log2(norm_counts+1) data, version 2016-08-16) (TCGA clinicalMatrix, phenotype data, version 2016-04-27) * Click on the image enlarge it in a new window. |
 |
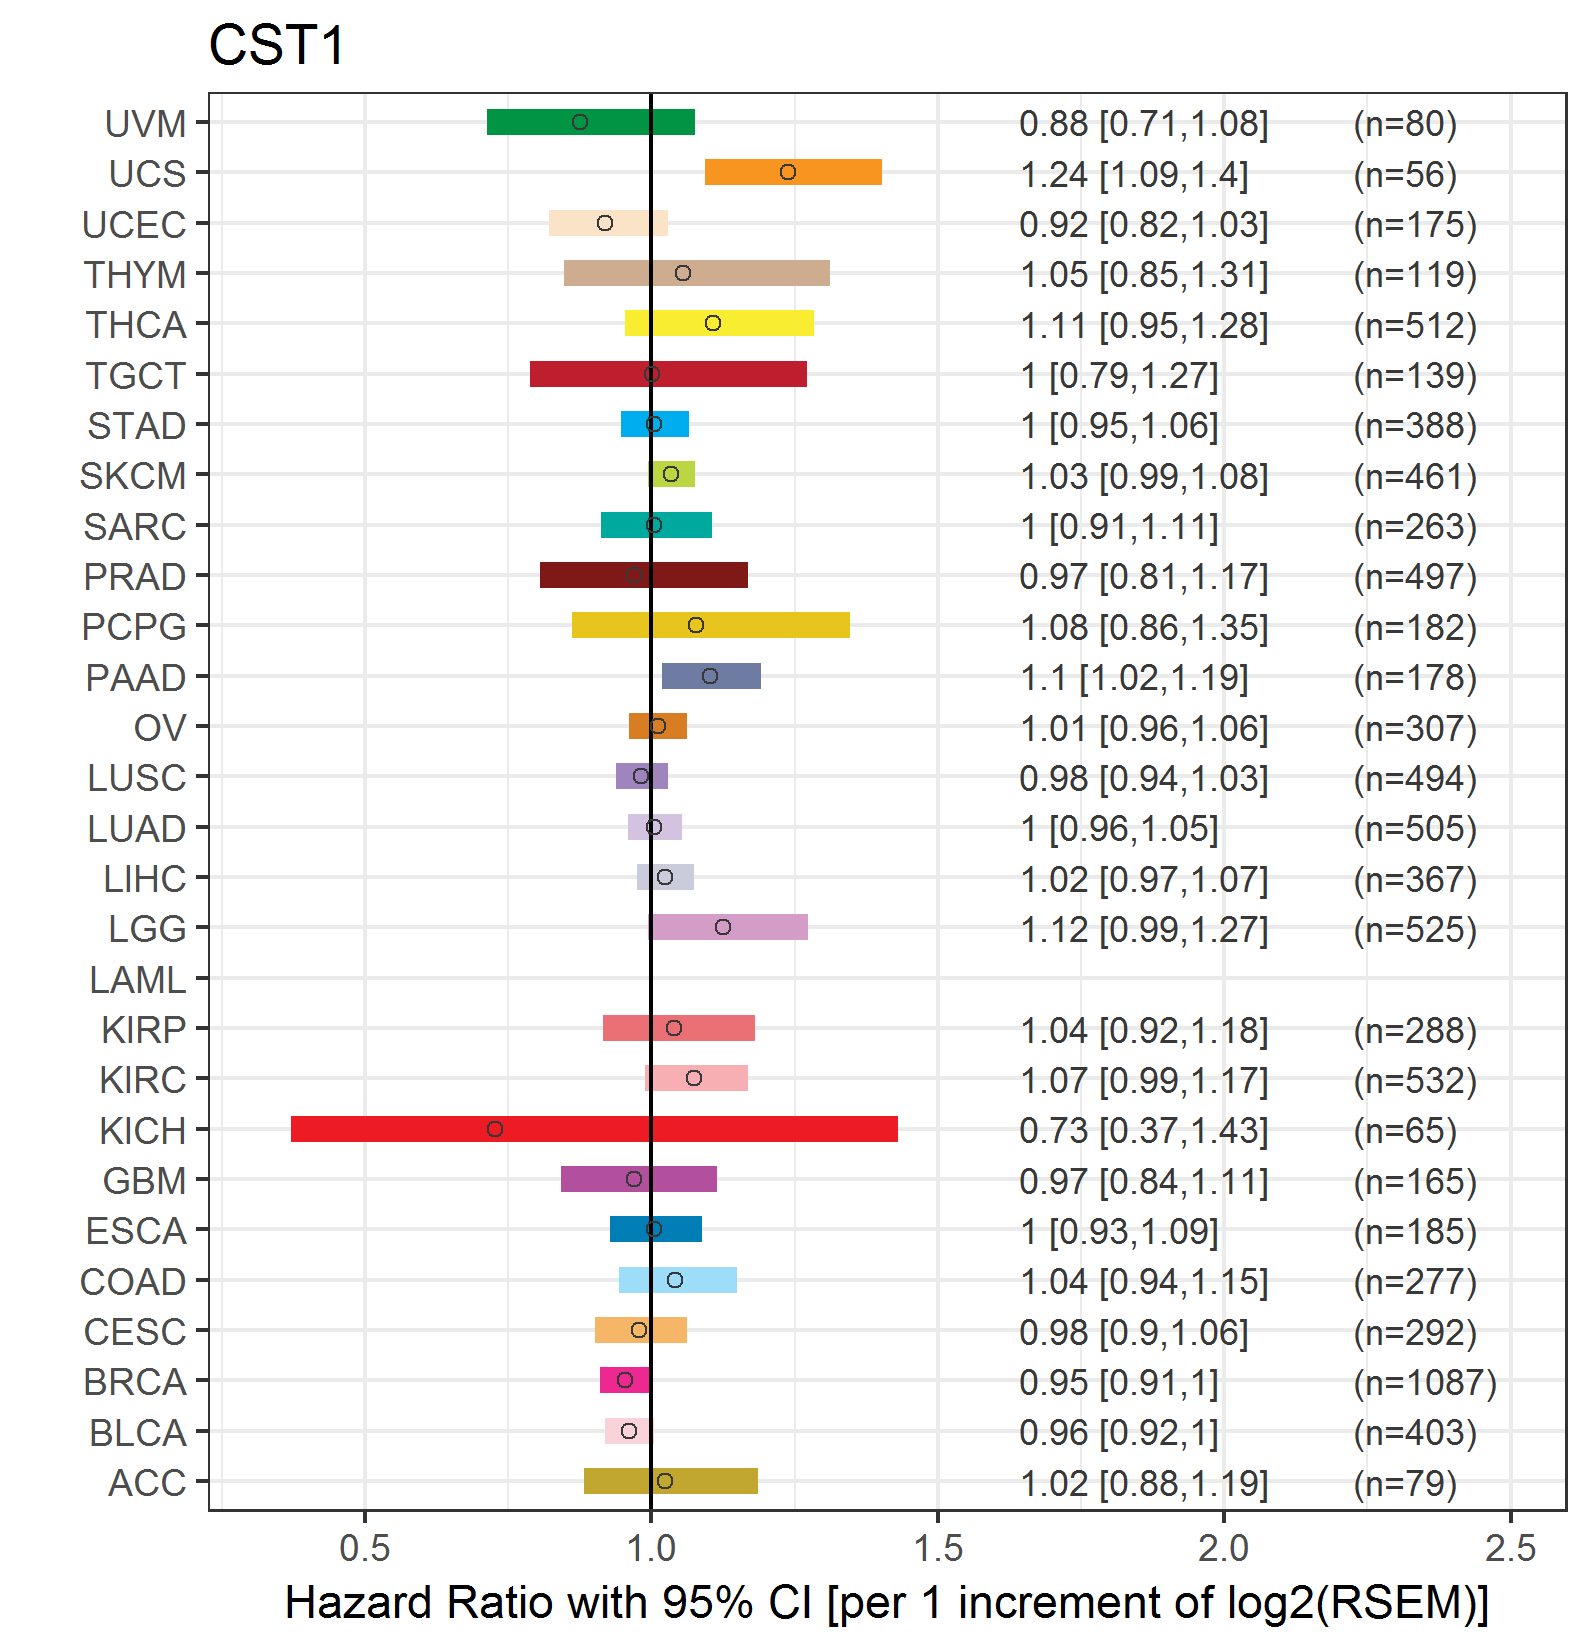
| Forest plot of Cox proportional hazard ratio (HR) and 95% CI of overall survival (OS) using 28 cancer types (TCGA IlluminaHiSeq_RNASeqV2, pan-cancer normalized log2(norm_counts+1) data, version 2016-08-16) (TCGA clinicalMatrix, phenotype data, version 2016-04-27) * Click on the image enlarge it in a new window. |
 |
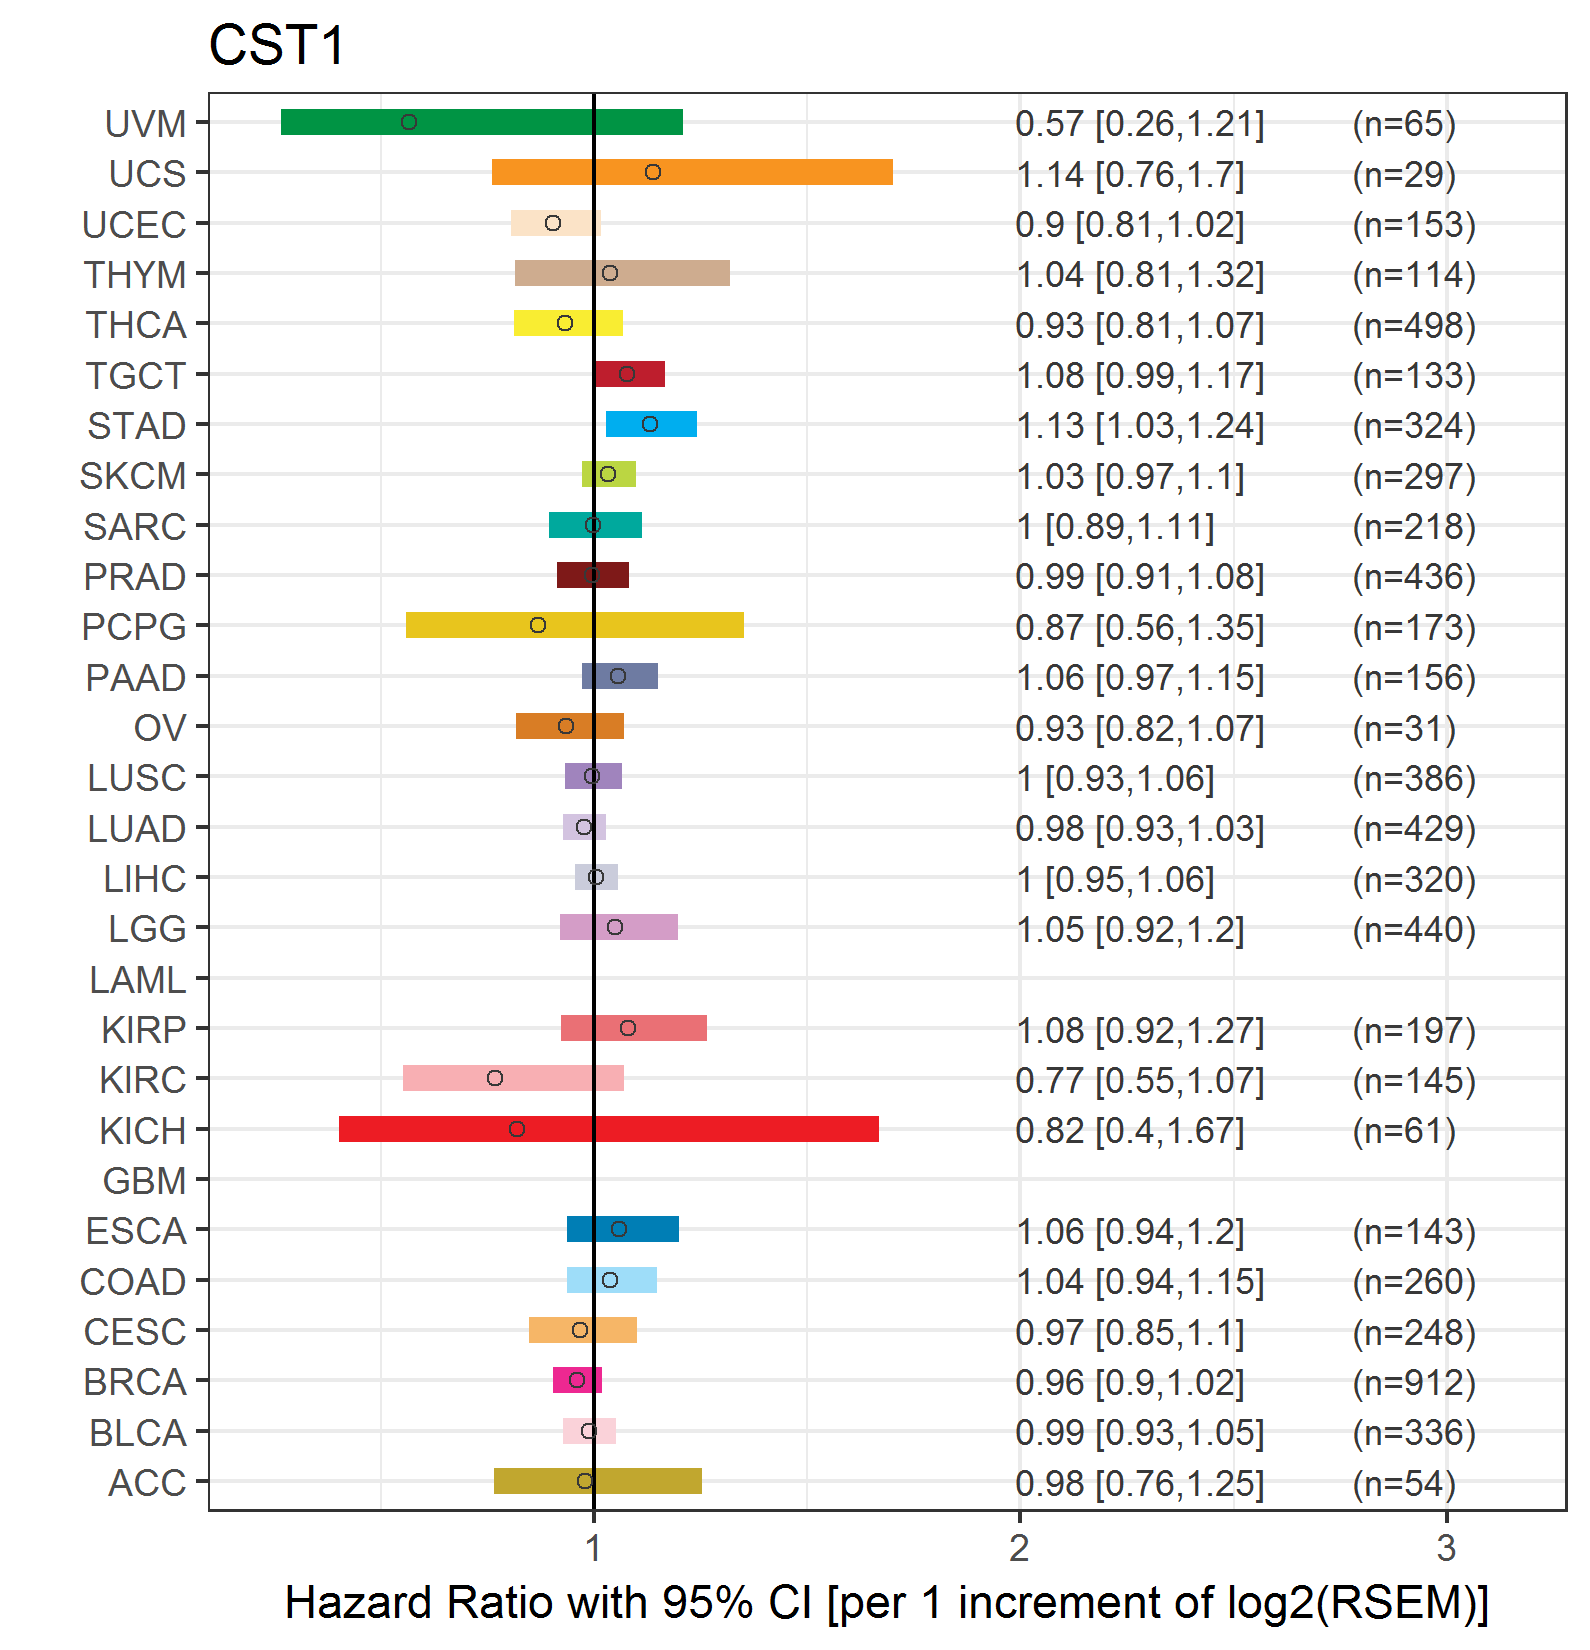
| Forest plot of Cox proportional hazard ratio (HR) and 95% CI of relapse free survival (RFS) using 28 cancer types (TCGA IlluminaHiSeq_RNASeqV2, pan-cancer normalized log2(norm_counts+1) data, version 2016-08-16) (TCGA clinicalMatrix, phenotype data, version 2016-04-27) * Click on the image enlarge it in a new window. |
 |
| Top |
| TissGeneClin for CST1 |
| TissGeneDrug for CST1 |
| Drug information targeting TissGene (DrugBank Version 5.0.6, 2017-04-01) |
| DrugBank ID | Drug name | Drug activity | Drug type | Drug status |
| Top |
| TissGeneDisease for CST1 |
| Disease information associated with TissGene (DisGeNet, 2016-06-01) |
| Disease ID | Disease name | # pubmeds | Source |
| umls:C0009402 | Colorectal Carcinoma | 2 | BeFree |
| umls:C0024623 | Malignant neoplasm of stomach | 2 | BeFree |
| umls:C0027627 | Neoplasm Metastasis | 2 | BeFree |
| umls:C0596263 | Carcinogenesis | 2 | BeFree |
| umls:C0699791 | Stomach Carcinoma | 2 | BeFree |
| umls:C0007102 | Malignant tumor of colon | 1 | BeFree |
| umls:C0007131 | Non-Small Cell Lung Carcinoma | 1 | BeFree |
| umls:C0009375 | Colonic Neoplasms | 1 | BeFree |
| umls:C0010709 | Cyst | 1 | BeFree |
| umls:C0011860 | Diabetes Mellitus, Non-Insulin-Dependent | 1 | GAD |
| umls:C0018621 | Hay fever | 1 | BeFree,CTD_human |
| umls:C0033578 | Prostatic Neoplasms | 1 | CTD_human |
| umls:C0038356 | Stomach Neoplasms | 1 | CTD_human |
| umls:C0085166 | Bacterial Vaginosis | 1 | BeFree |
| umls:C0221760 | brain cyst | 1 | BeFree |
| umls:C0235974 | Pancreatic carcinoma | 1 | BeFree |
| umls:C0346647 | Malignant neoplasm of pancreas | 1 | BeFree |
| umls:C0699790 | Colon Carcinoma | 1 | BeFree |
| umls:C1527249 | Colorectal Cancer | 1 | BeFree |
|
Copyright 2016-Present - The University of Texas Health Science Center at Houston (UTHealth) Web File Viewing | How to Report, Fraud, Waste and Abuse | State of Texas | Statewide Search | Texas Homeland Security | Site Policies |