 |
| |
| |
| |
| |
| |
| |
|

| TissGeneSummary for TMEM56 |
 Gene summary Gene summary |
| Basic gene information | Gene symbol | TMEM56 |
| Gene name | transmembrane protein 56 | |
| Synonyms | - | |
| Cytomap | UCSC genome browser: 1p21.3 | |
| Type of gene | protein-coding | |
| RefGenes | NM_001199679.1, NM_152487.2, | |
| Description | - | |
| Modification date | 20141207 | |
| dbXrefs | HGNC : HGNC | |
| Ensembl : ENSG00000152078 | ||
| HPRD : 08110 | ||
| Vega : OTTHUMG00000010847 | ||
| Protein | UniProt: go to UniProt's Cross Reference DB Table | |
| Expression | CleanEX: HS_TMEM56 | |
| BioGPS: 148534 | ||
| Pathway | NCI Pathway Interaction Database: TMEM56 | |
| KEGG: TMEM56 | ||
| REACTOME: TMEM56 | ||
| Pathway Commons: TMEM56 | ||
| Context | iHOP: TMEM56 | |
| ligand binding site mutation search in PubMed: TMEM56 | ||
| UCL Cancer Institute: TMEM56 | ||
| Assigned class in TissGDB* | C | |
| Included tissue-specific gene expression resources | TiGER,GTEx | |
| Specific-tissues in normal samples (assigned by TissGDB using HPA, TiGER, and GTEx) | CervixLiver | |
| Cancer types related to the specific-tissues in cancer samples (assigned by TissGDB using TCGA) | CESCLIHC | |
| Reference showing the relevant tissue of TMEM56 | ||
| Description by TissGene annotations | Have significant anti-correlated miRNA | |
| * Class A consists of genes with literature evidence and is part of the cTissGenes. Class B consists of only cTissGenes without additional evidence. The remaining genes belong to Class C. |
| Gene ontology having evidence of Inferred from Direct Assay (IDA) from Entrez |
| GO ID | GO term | PubMed ID |
| Top |
| TissGeneExp for TMEM56 |
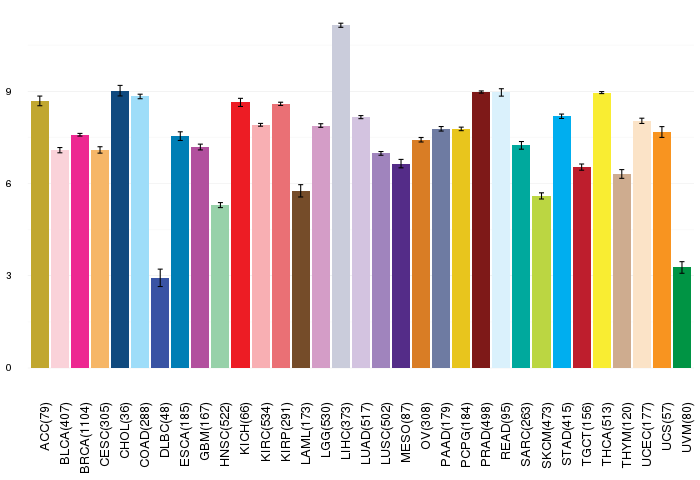
| Gene expressions across 28 cancer types (X-axis: cancer type and Y-axis: log2(norm_counts+1)) (TCGA IlluminaHiSeq_RNASeqV2, pan-cancer normalized log2(norm_counts+1) data, version 2016-08-16) |
 |
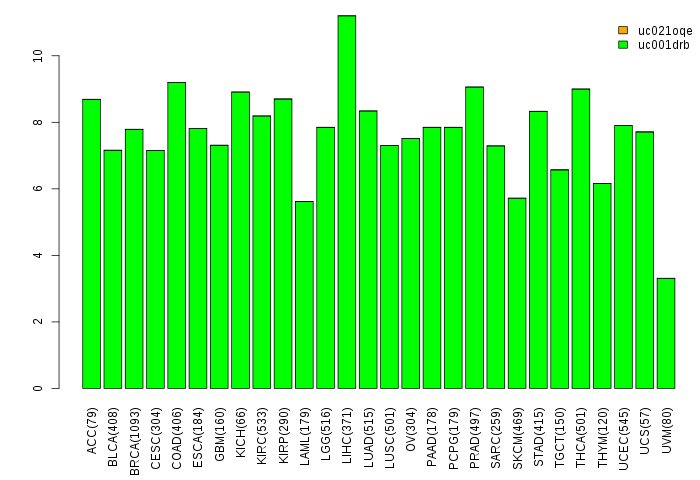
| Gene isoform expressions across 28 cancer types (X-axis: cancer type and Y-axis: log2(norm_counts+1)) (TCGA pan-cancer tcga_rsem_isoform_tpm, version 2016-09-01) |
 |
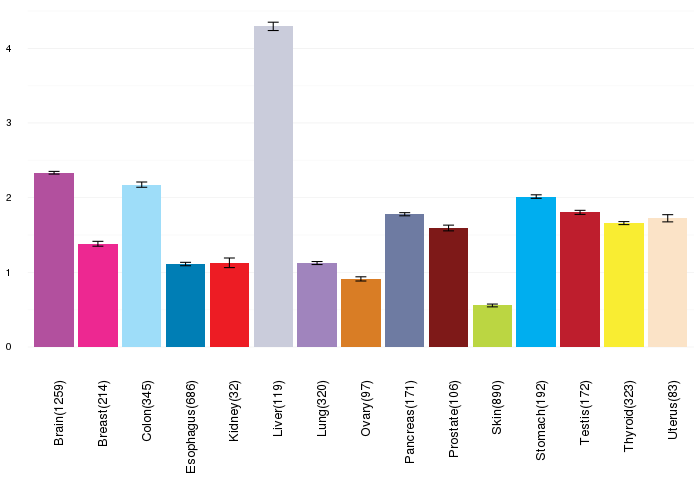
| Gene expressions across normal tissues of GTEx data (GTEx GTEx_Analysis_v6_RNA-seq_RNA-SeQCv1.1.8_gene_rpkm.gct) - Here, we shows the matched tissue types only among our 28 cancer types. |
 |
| Different expressions across 14 cancer types with more than 10 samples between matched tumors and normals (X-axis: cancer type and Y-axis: log2(norm_counts+1)) (TCGA IlluminaHiSeq_RNASeqV2, pan-cancer normalized log2(norm_counts+1) data, version 2016-08-16) |
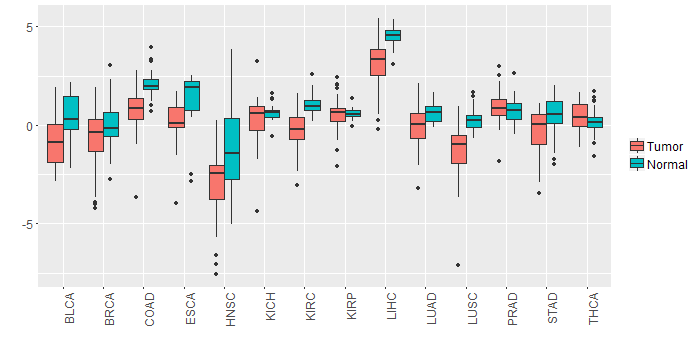 |
| - Significantly differentially expressed cancer types and information. (|Fold change|>1 and FDR<0.05) |
| Cancer type | Mean(exp) in tumor | Mean(exp) in matched normal | Log2FC | P-val. | FDR |
| LUSC | -1.323153413 | 0.258497567 | -1.58165098 | 2.07E-10 | 7.56E-10 |
| LIHC | 3.140240744 | 4.534276744 | -1.394036 | 3.87E-11 | 5.37E-10 |
| KIRC | -0.276816812 | 1.00550541 | -1.282322222 | 8.29E-18 | 5.34E-17 |
| COAD | 0.700919513 | 2.094300282 | -1.393380769 | 9.91E-06 | 4.55E-05 |
| BLCA | -0.781640204 | 0.46074927 | -1.242389474 | 0.00536 | 0.02778704 |
| HNSC | -2.894349628 | -1.195458931 | -1.698890698 | 7.64E-05 | 0.000352977 |
| Top |
| TissGene-miRNA for TMEM56 |
| Significantly anti-correlated miRNAs of TissGene across 28 cancer types (Gene-miRNA relations from TargetScanHuman Relsease 7.1, Conserved_Site_Context_Scores.txt.zip, 06.01.2016) (TCGA IlluminaHiSeq_miRNASeq, log2(RPM+1) data, version 2016-11-21) (TCGA IlluminaHiSeq_RNASeqV2, log2(normalized_count+1) data, version 2016-08-16) (Spearman’s Rank Correlation (p-value<0.05 and coefficient<-0.25)) |
| Cancer type | miRNA id | miRNA accession | P-val. | Coeff. | # samples |
| LUAD | hsa-miR-141-3p | MIMAT0000432 | 0.0024 | -0.39 | 60 |
| Top |
| TissGeneMut for TMEM56 |
| TissGeneSNV for TMEM56 |
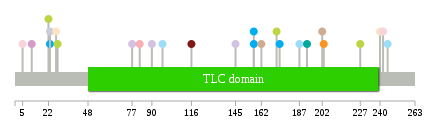
| nsSNV counts per each loci. Different colors of circles represent different cancer types. Circle size denotes number of samples. (TCGA somatic mutation (SNPs and small INDELs) data, version 2016-04-25) * Click on the image to enlarge it in a new window. |
 |
 |
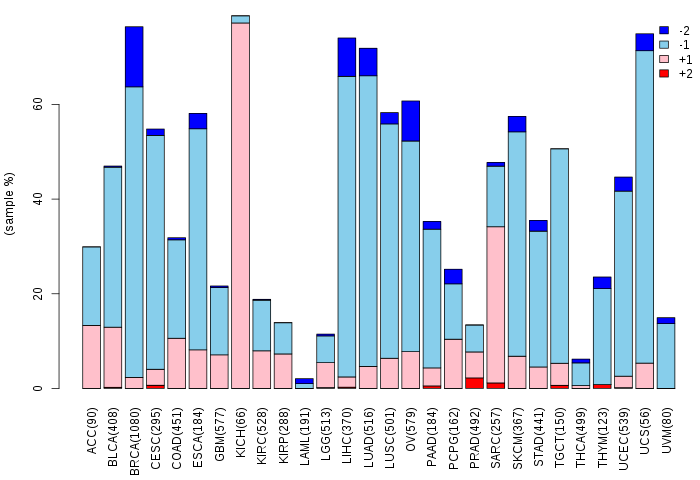
| Somatic nucleotide variants of TissGene across 28 cancer types (X-axis: cancer type and Y-axis: % of mutated samples) The numbers in parentheses are numbers of samples with mutation (nsSNVs). (TCGA somatic mutation (SNPs and small INDELs) data, version 2016-04-25) |
 |
| - nsSNVs sorted by frequency. |
| AAchange | Cancer type | # samples |
| p.W82L | KIRC | 1 |
| p.D227N | SKCM | 1 |
| p.M192I | SARC | 1 |
| p.I245T | COAD | 1 |
| p.K77E | LUAD | 1 |
| p.G197V | HNSC | 1 |
| p.L22F | SKCM | 1 |
| p.K116N | PRAD | 1 |
| p.Q157X | STAD | 1 |
| p.G240C | UCEC | 1 |
| p.V187M | COAD | 1 |
| p.S27N | UCEC | 1 |
| p.Y28H | SKCM | 1 |
| p.F23L | STAD | 1 |
| p.K236T | READ | 1 |
| p.Y203H | UCS | 1 |
| p.V11A | LGG | 1 |
| p.V90M | LUAD | 1 |
| p.G97D | COAD | 1 |
| p.T5R | BLCA | 1 |
| p.A172T | SKCM | 1 |
| p.I242M | BLCA | 1 |
| p.V174I | STAD | 1 |
| p.Q157* | STAD | 1 |
| p.R145C | LUAD | 1 |
| p.F23L | LIHC | 1 |
| p.E162G | THYM | 1 |
| p.V202M | THYM | 1 |
| Top |
| TissGeneCNV for TMEM56 |
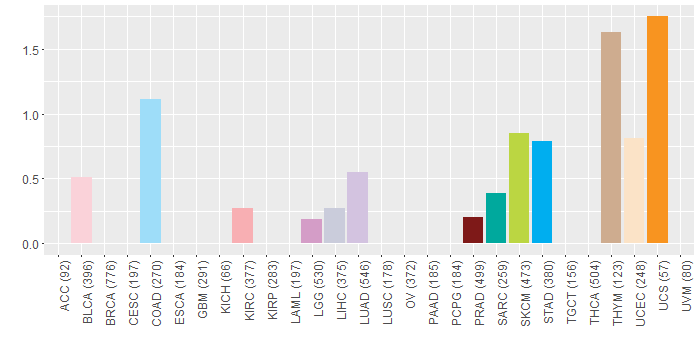
| Copy number variations of TissGene across 28 cancer types (X-axis: cancer type and Y-axis: % of CNV samples) (TCGA Gistic2_CopyNumber_Gistic2_all_data_by_genes, Gistic2 copy number data, version 2016-08-16) |
 |
| Top |
| TissGeneFusions for TMEM56 |
| Fusion genes including TissGene (ChimerDB 3.0, 2016-12-01 and TCGA fusion Portal 2015-12-01) |
| Database | Src | Cancer type | Sample | Fusion gene | ORF | 5'-gene BP | 3'-gene BP |
| Chimerdb3.0 | ChiTaRs | NA | AW362912 | ZCCHC10-TMEM56 | chr5:132339336 | chr1:95576560 | |
| Chimerdb3.0 | ChiTaRs | NA | BF306134 | TMEM56-DDOST | chr1:95639966 | chr1:20978617 | |
| TCGAfusionPortal | PRADA | BRCA | TCGA-A8-A07L-01A | RWDD3-TMEM56 | Out-of-frame | Chr1:95699871 | Chr1:95639372 |
| TCGAfusionPortal | PRADA | BRCA | TCGA-D8-A1X5-01A | TMEM56-FNBP1L | Out-of-frame | Chr1:95639445 | Chr1:93965025 |
| Top |
| TissGeneNet for TMEM56 |
| Co-expressed gene networks based on protein-protein interaction data (CePIN) (TCGA IlluminaHiSeq_RNASeqV2, pan-cancer normalized log2(norm_counts+1) data, version 2016-08-16) (PINA2 ppi data) |
| Top |
| TissGeneProg for TMEM56 |
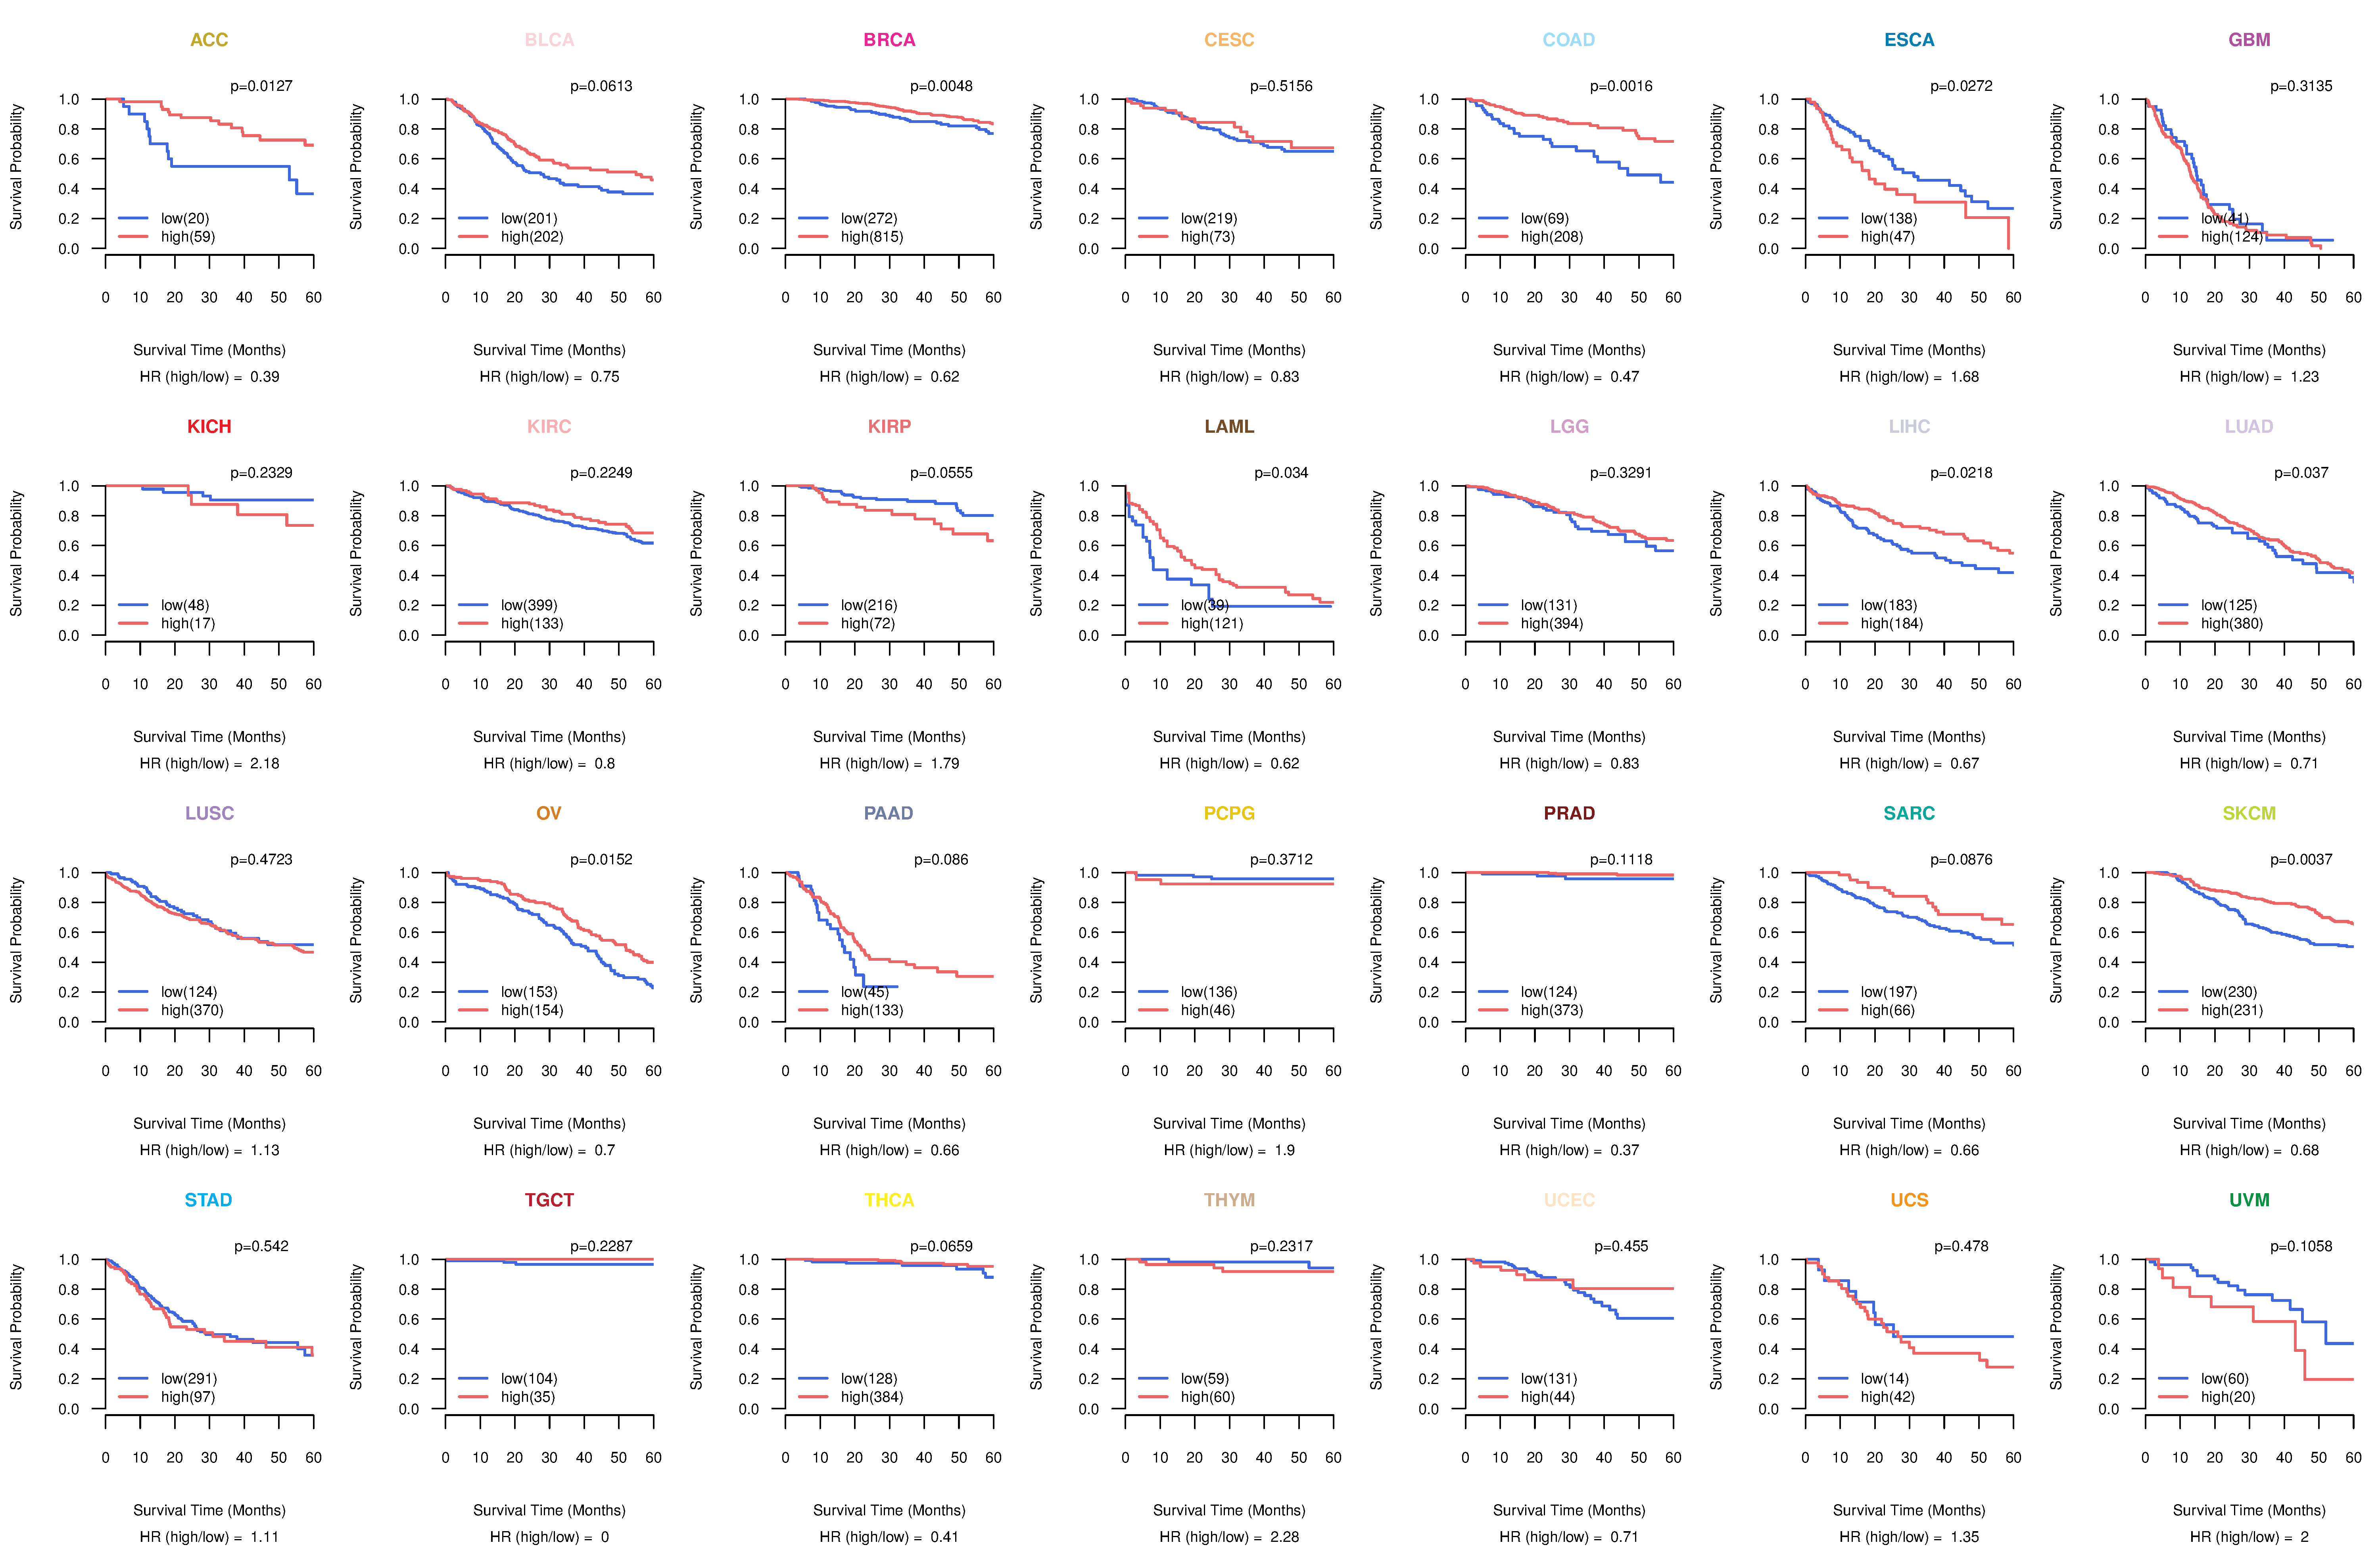
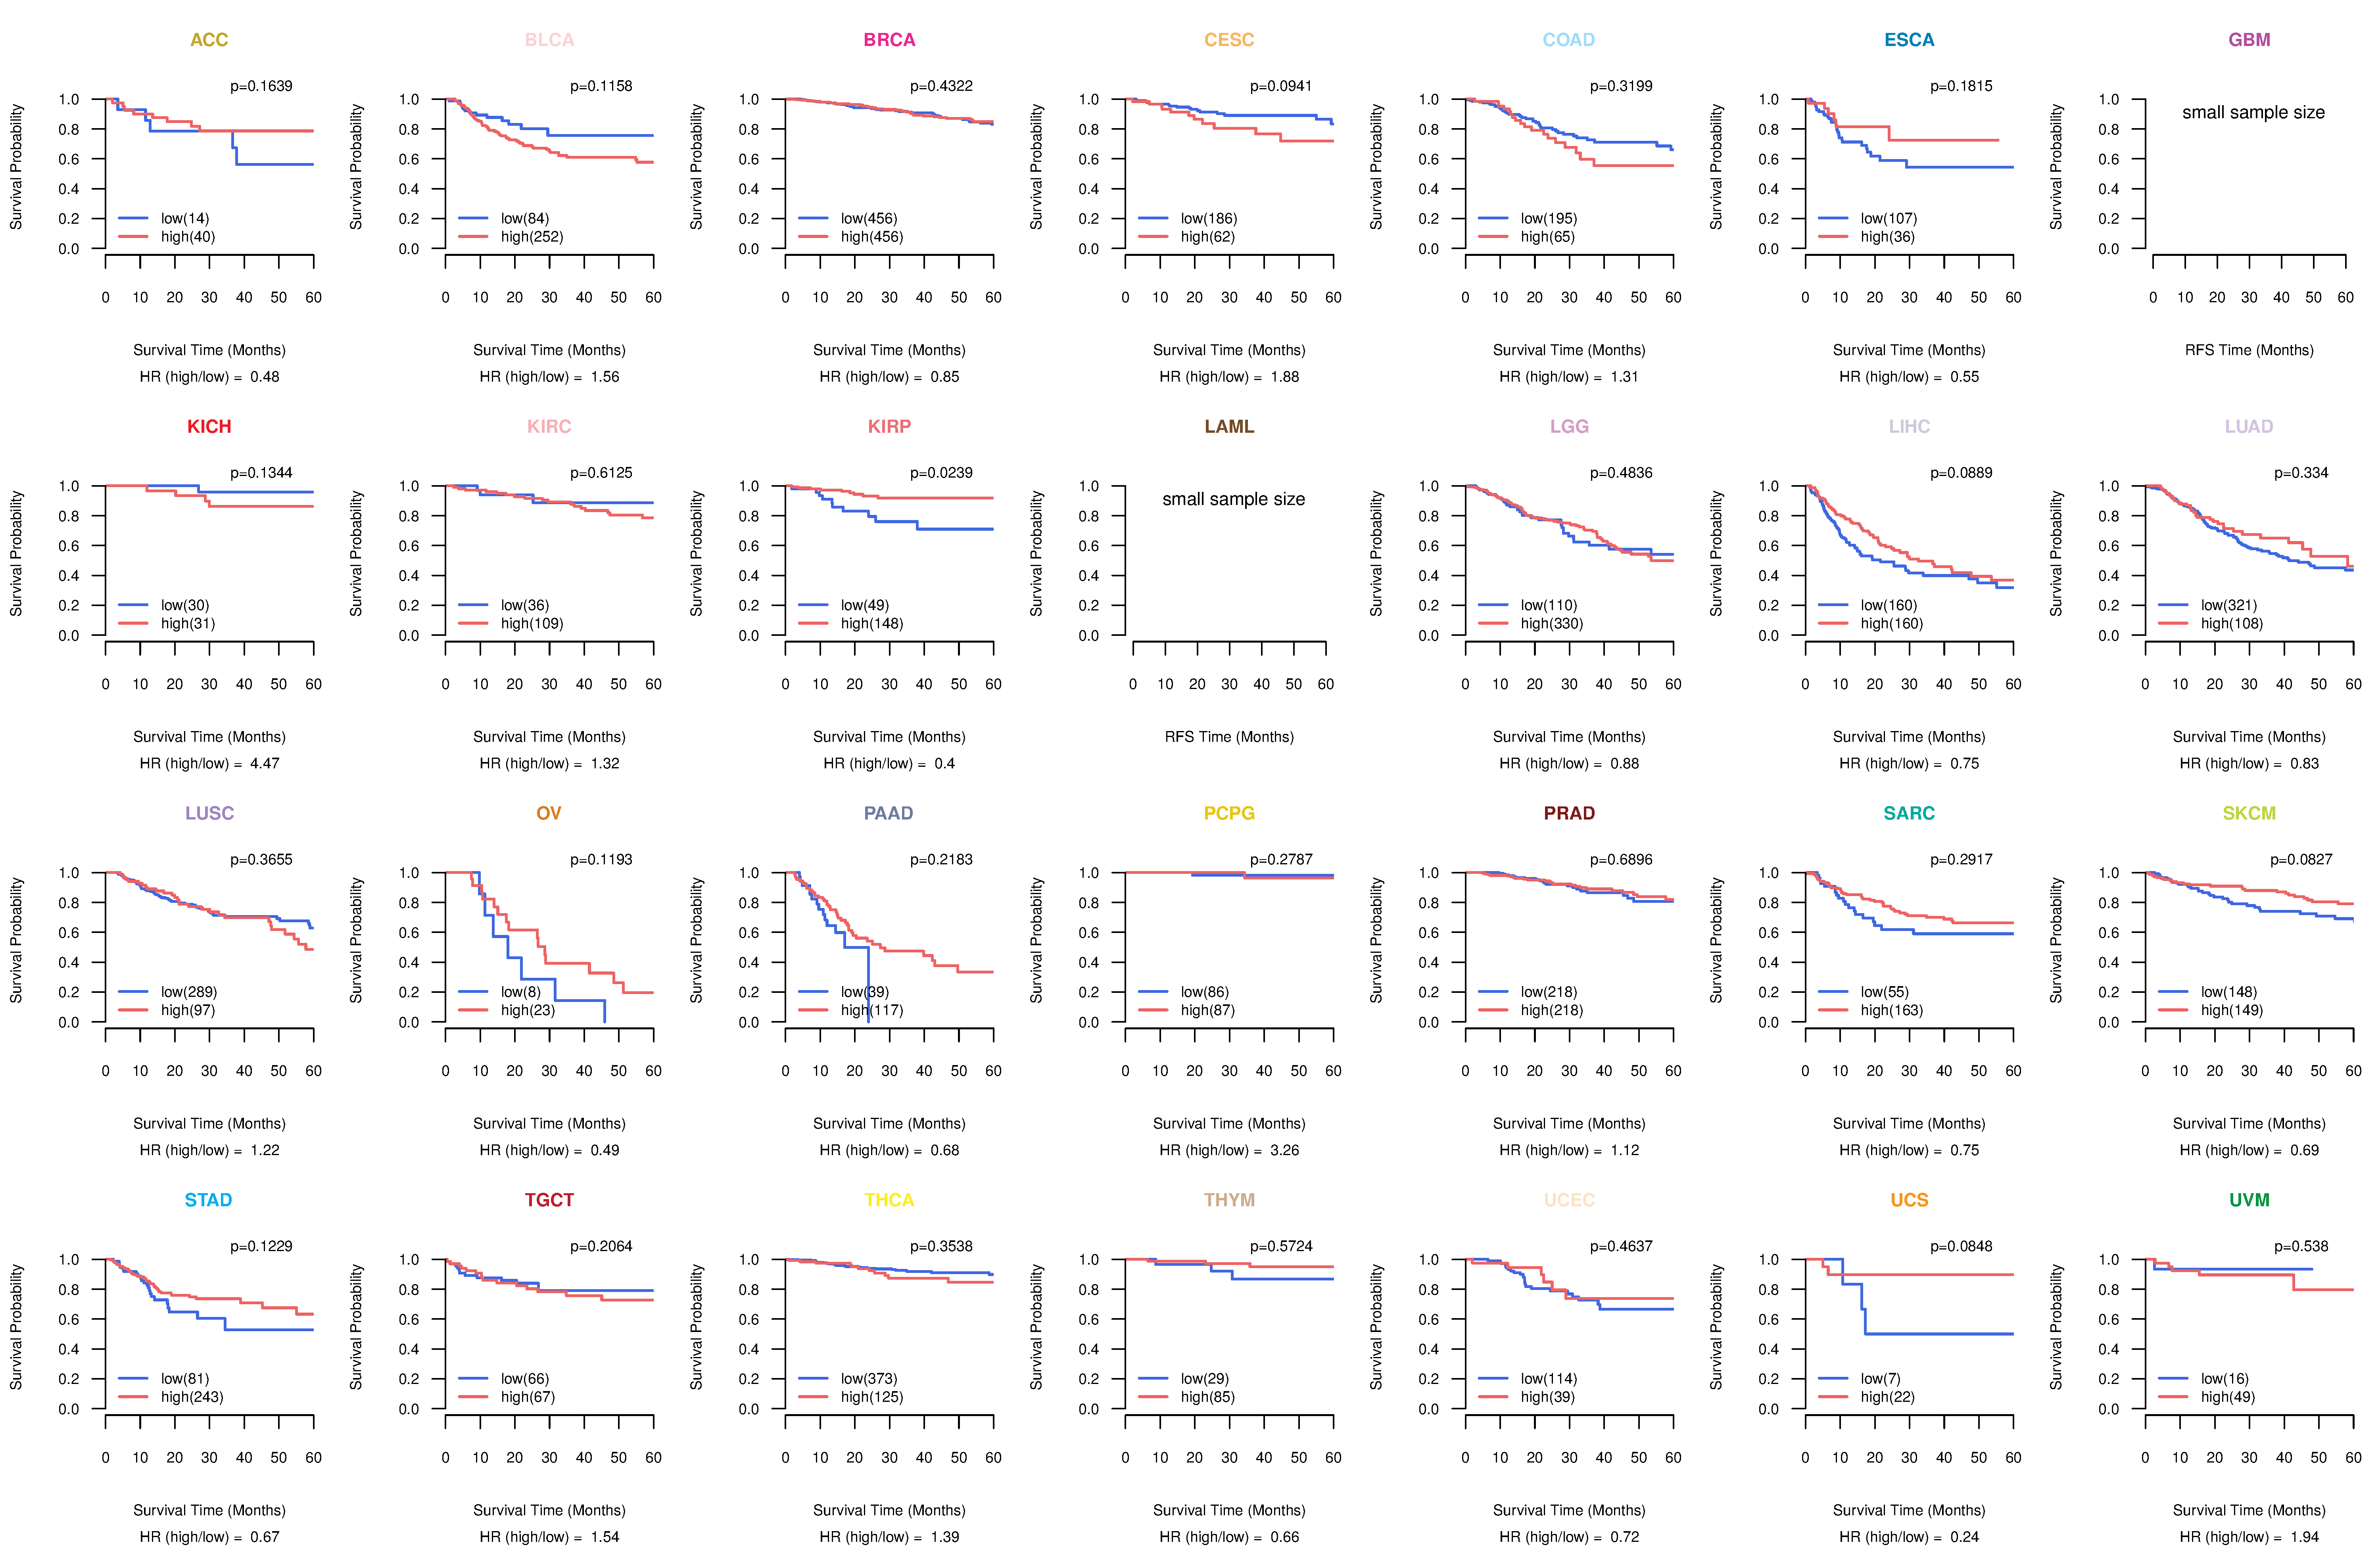
| Kaplan-Meier plots with logrank tests of overall survival (OS) using 28 cancer types (TCGA IlluminaHiSeq_RNASeqV2, pan-cancer normalized log2(norm_counts+1) data, version 2016-08-16) (TCGA clinicalMatrix, phenotype data, version 2016-04-27) * Click on the image to enlarge it in a new window. |
 |
| Kaplan-Meier plots with logrank test of relapse free survival (RFS) using 28 cancer types (TCGA IlluminaHiSeq_RNASeqV2, pan-cancer normalized log2(norm_counts+1) data, version 2016-08-16) (TCGA clinicalMatrix, phenotype data, version 2016-04-27) * Click on the image enlarge it in a new window. |
 |
| Forest plot of Cox proportional hazard ratio (HR) and 95% CI of overall survival (OS) using 28 cancer types (TCGA IlluminaHiSeq_RNASeqV2, pan-cancer normalized log2(norm_counts+1) data, version 2016-08-16) (TCGA clinicalMatrix, phenotype data, version 2016-04-27) * Click on the image enlarge it in a new window. |
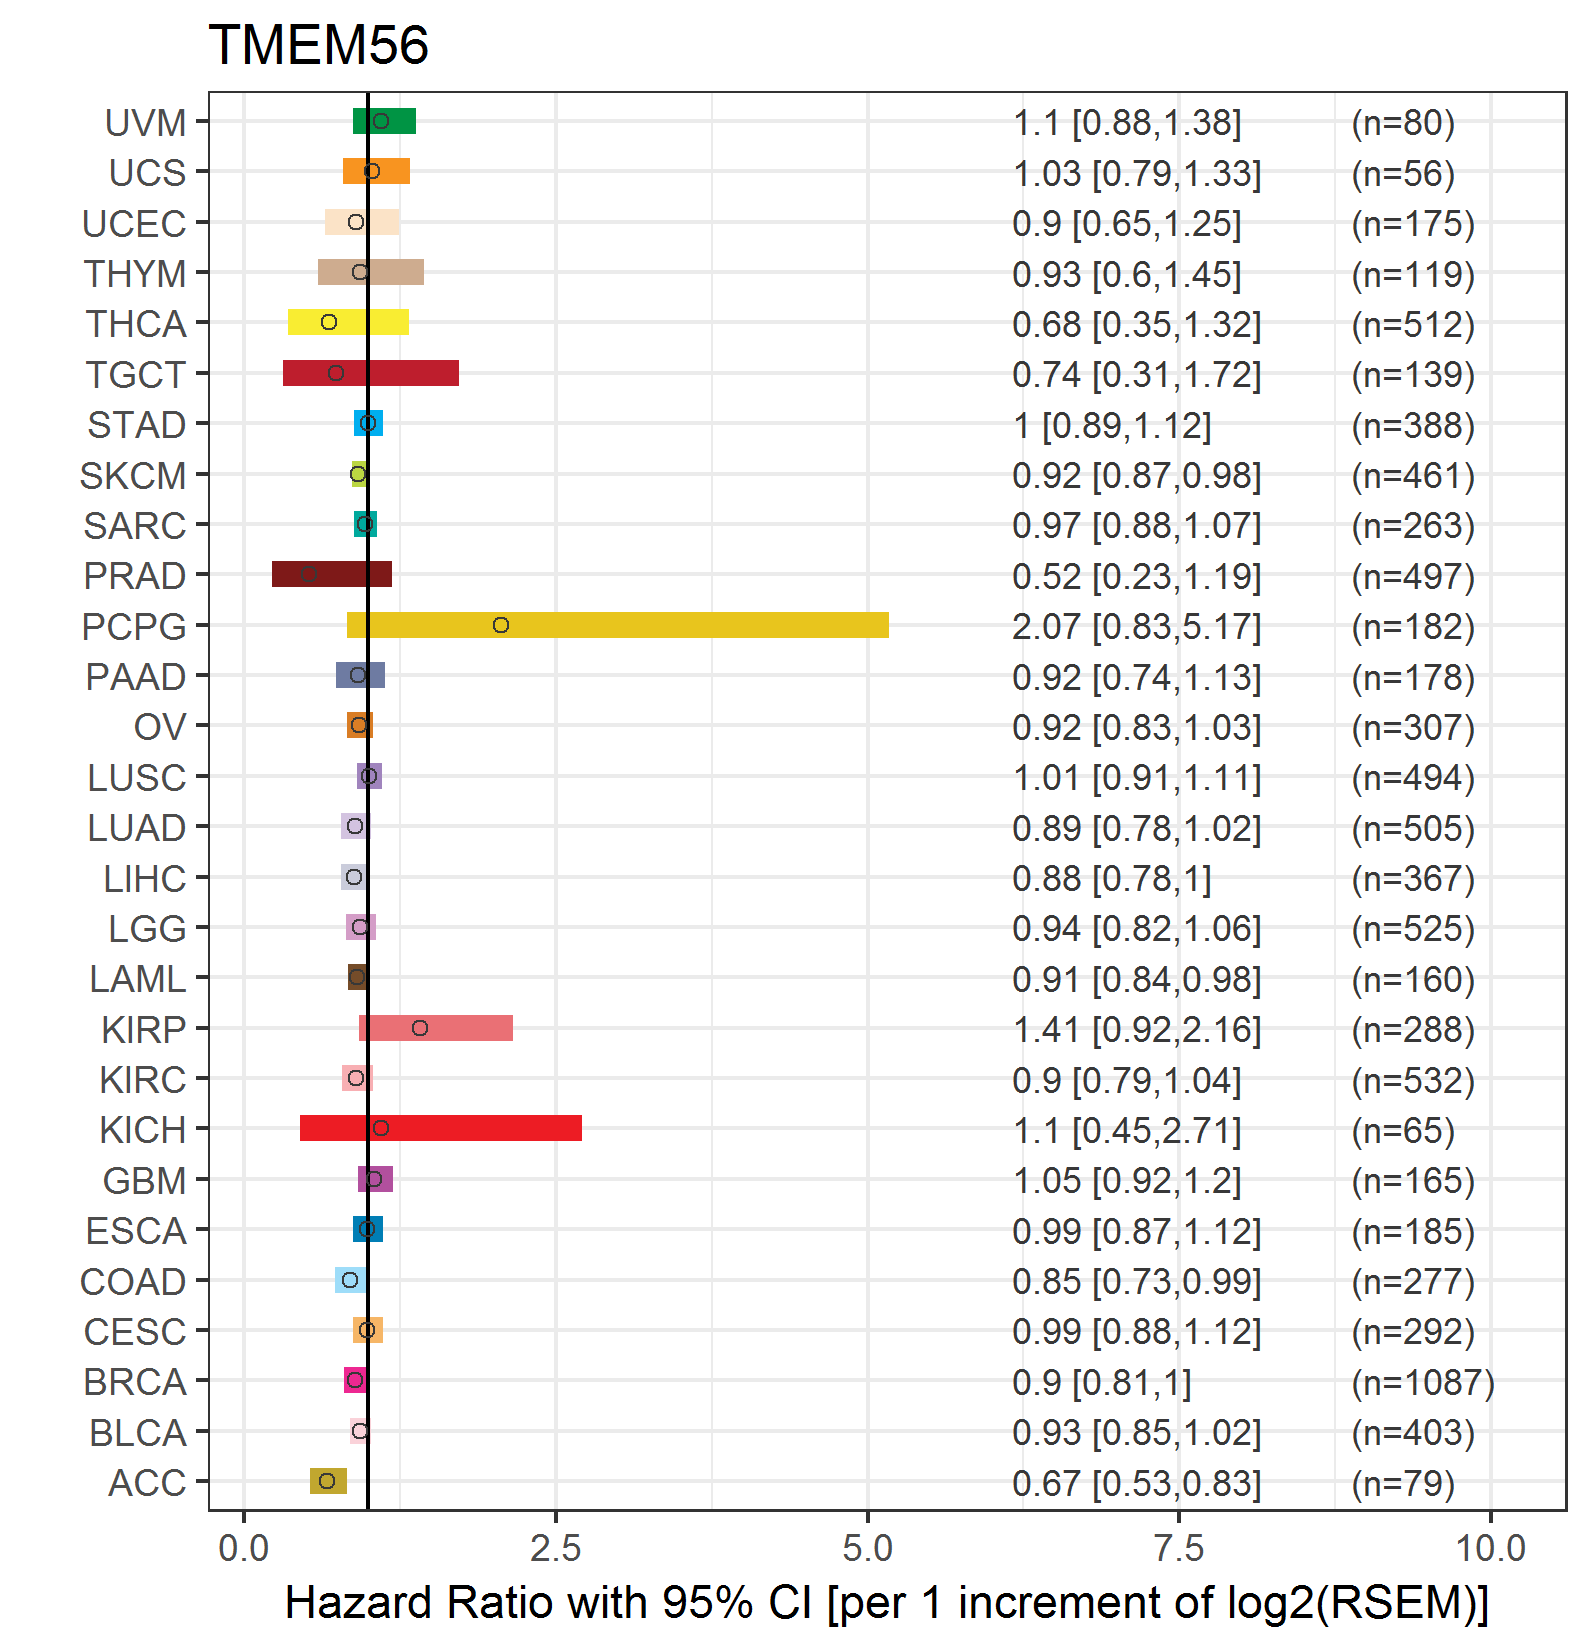 |
| Forest plot of Cox proportional hazard ratio (HR) and 95% CI of relapse free survival (RFS) using 28 cancer types (TCGA IlluminaHiSeq_RNASeqV2, pan-cancer normalized log2(norm_counts+1) data, version 2016-08-16) (TCGA clinicalMatrix, phenotype data, version 2016-04-27) * Click on the image enlarge it in a new window. |
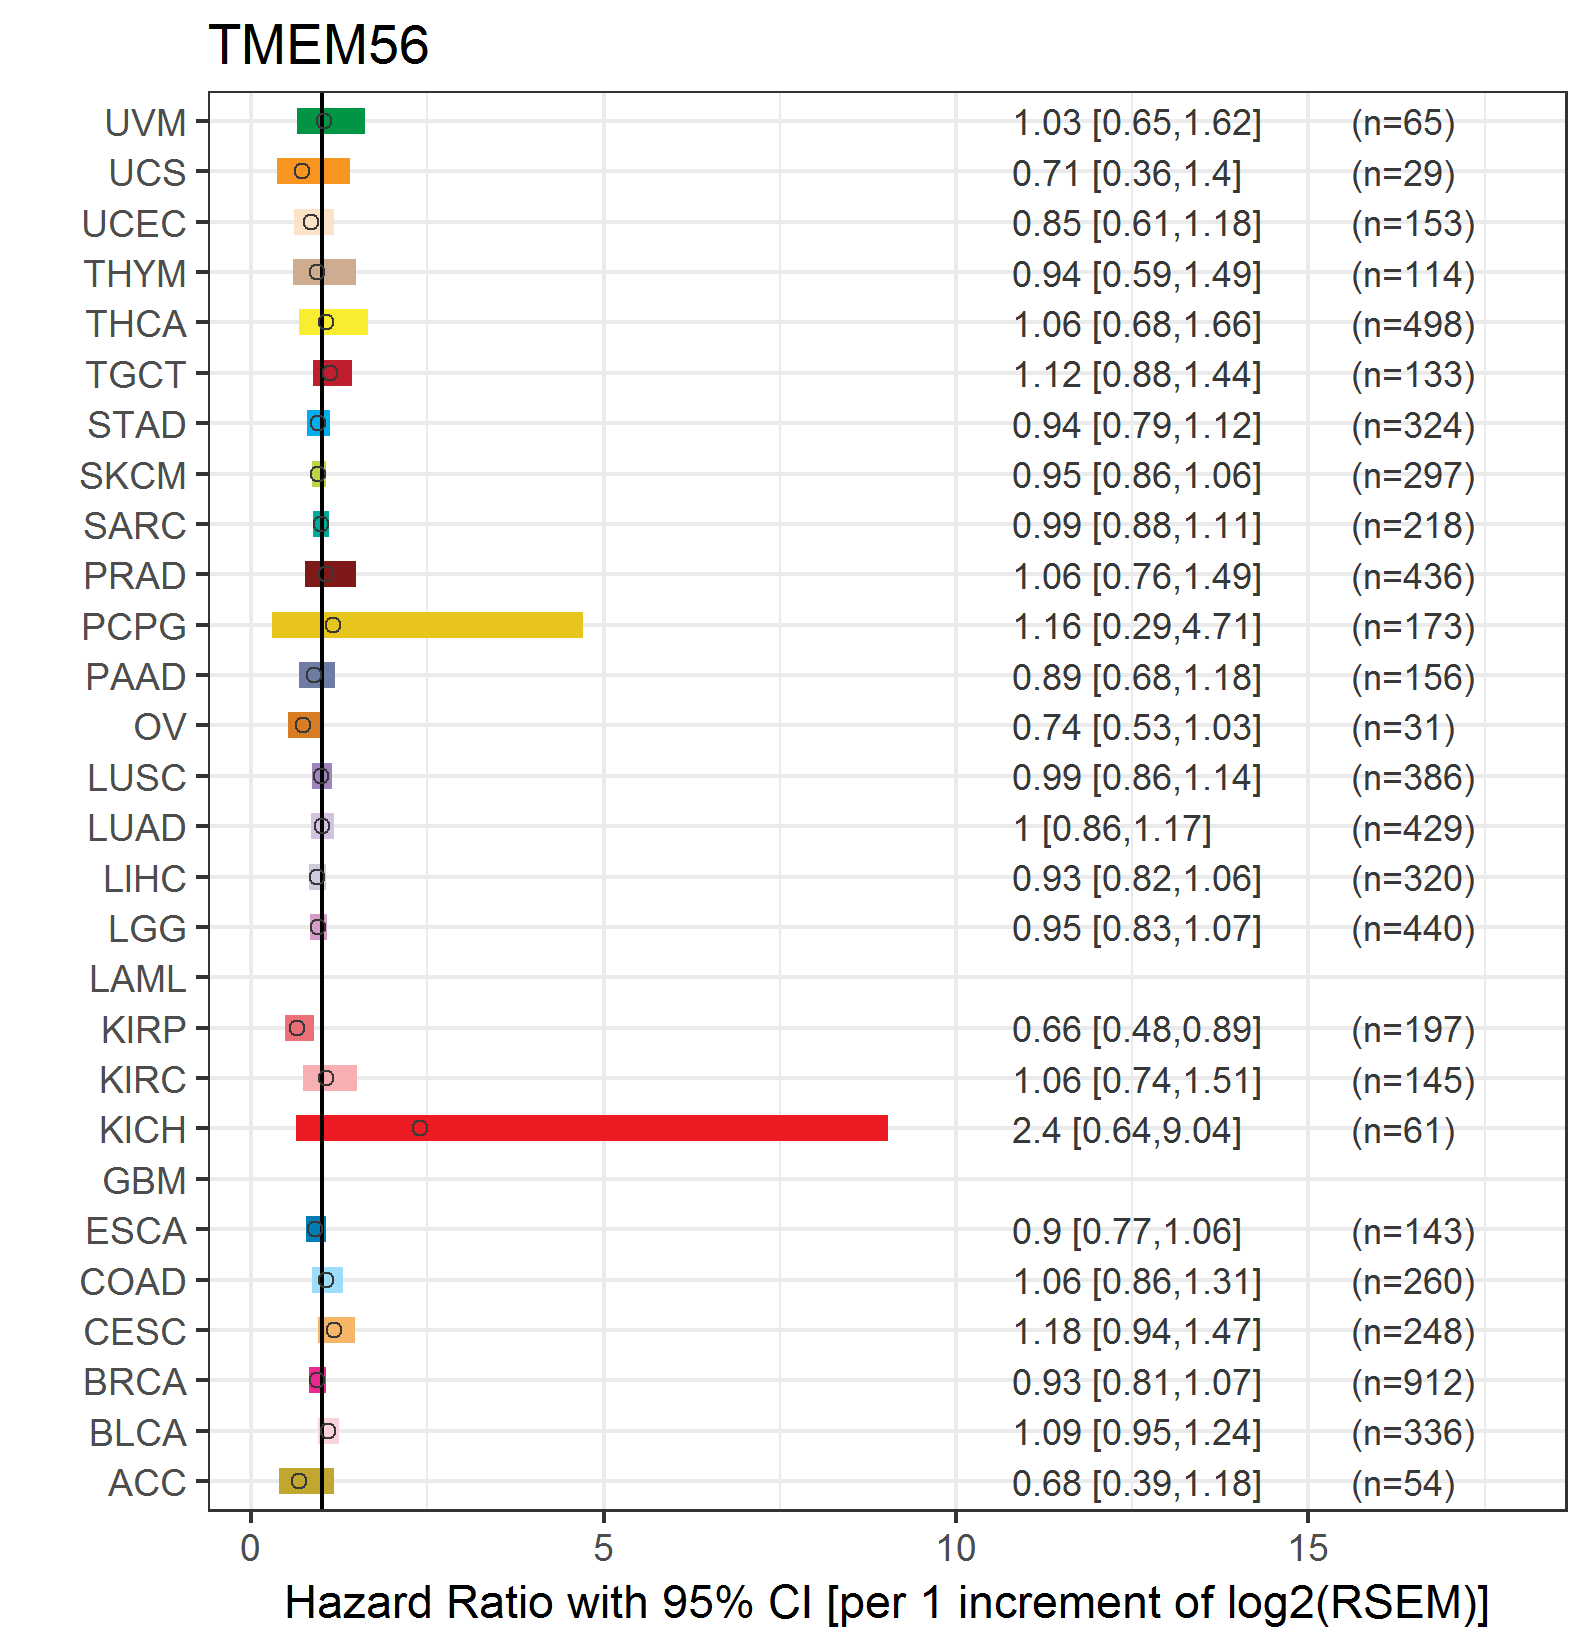 |
| Top |
| TissGeneClin for TMEM56 |
| TissGeneDrug for TMEM56 |
| Drug information targeting TissGene (DrugBank Version 5.0.6, 2017-04-01) |
| DrugBank ID | Drug name | Drug activity | Drug type | Drug status |
| Top |
| TissGeneDisease for TMEM56 |
| Disease information associated with TissGene (DisGeNet, 2016-06-01) |
| Disease ID | Disease name | # pubmeds | Source |
| umls:C0040336 | Tobacco Use Disorder | 1 | GAD |
| umls:C0400966 | Non-alcoholic Fatty Liver Disease | 1 | GAD |
|
Copyright 2016-Present - The University of Texas Health Science Center at Houston (UTHealth) Web File Viewing | How to Report, Fraud, Waste and Abuse | State of Texas | Statewide Search | Texas Homeland Security | Site Policies |