 |
| |
| |
| |
| |
| |
| |
|

| TissGeneSummary for WFDC5 |
 Gene summary Gene summary |
| Basic gene information | Gene symbol | WFDC5 |
| Gene name | WAP four-disulfide core domain 5 | |
| Synonyms | PRG5|WAP1|dJ211D12.5 | |
| Cytomap | UCSC genome browser: 20q13.12 | |
| Type of gene | protein-coding | |
| RefGenes | NM_145652.3, | |
| Description | WAP four-disulfide core domain protein 5p53-responsive gene 5 proteinprotease inhibitor WAP1putative protease inhibitor WAP1 | |
| Modification date | 20141207 | |
| dbXrefs | MIM : 605161 | |
| HGNC : HGNC | ||
| Ensembl : ENSG00000175121 | ||
| Vega : OTTHUMG00000046411 | ||
| Protein | UniProt: go to UniProt's Cross Reference DB Table | |
| Expression | CleanEX: HS_WFDC5 | |
| BioGPS: 149708 | ||
| Pathway | NCI Pathway Interaction Database: WFDC5 | |
| KEGG: WFDC5 | ||
| REACTOME: WFDC5 | ||
| Pathway Commons: WFDC5 | ||
| Context | iHOP: WFDC5 | |
| ligand binding site mutation search in PubMed: WFDC5 | ||
| UCL Cancer Institute: WFDC5 | ||
| Assigned class in TissGDB* | C | |
| Included tissue-specific gene expression resources | HPA,GTEx | |
| Specific-tissues in normal samples (assigned by TissGDB using HPA, TiGER, and GTEx) | Skin | |
| Cancer types related to the specific-tissues in cancer samples (assigned by TissGDB using TCGA) | SKCM | |
| Reference showing the relevant tissue of WFDC5 | ||
| Description by TissGene annotations | ||
| * Class A consists of genes with literature evidence and is part of the cTissGenes. Class B consists of only cTissGenes without additional evidence. The remaining genes belong to Class C. |
| Gene ontology having evidence of Inferred from Direct Assay (IDA) from Entrez |
| GO ID | GO term | PubMed ID |
| Top |
| TissGeneExp for WFDC5 |
| Gene expressions across 28 cancer types (X-axis: cancer type and Y-axis: log2(norm_counts+1)) (TCGA IlluminaHiSeq_RNASeqV2, pan-cancer normalized log2(norm_counts+1) data, version 2016-08-16) |
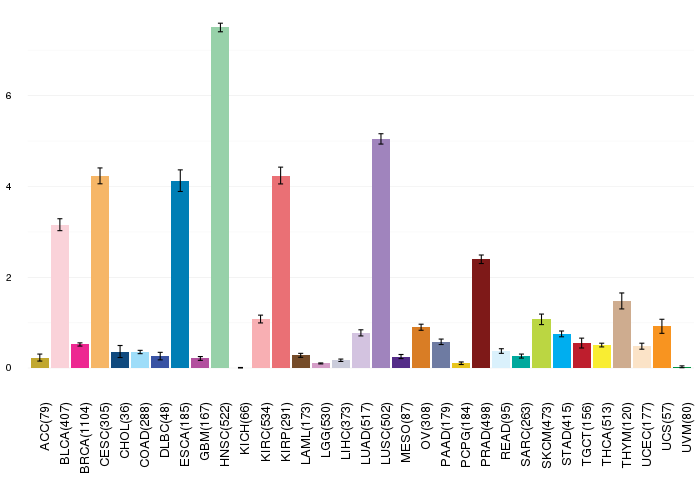 |
| Gene isoform expressions across 28 cancer types (X-axis: cancer type and Y-axis: log2(norm_counts+1)) (TCGA pan-cancer tcga_rsem_isoform_tpm, version 2016-09-01) |
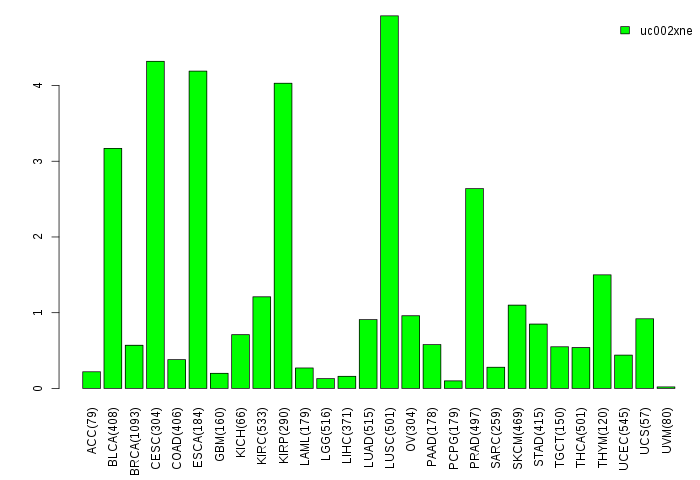 |
| Gene expressions across normal tissues of GTEx data (GTEx GTEx_Analysis_v6_RNA-seq_RNA-SeQCv1.1.8_gene_rpkm.gct) - Here, we shows the matched tissue types only among our 28 cancer types. |
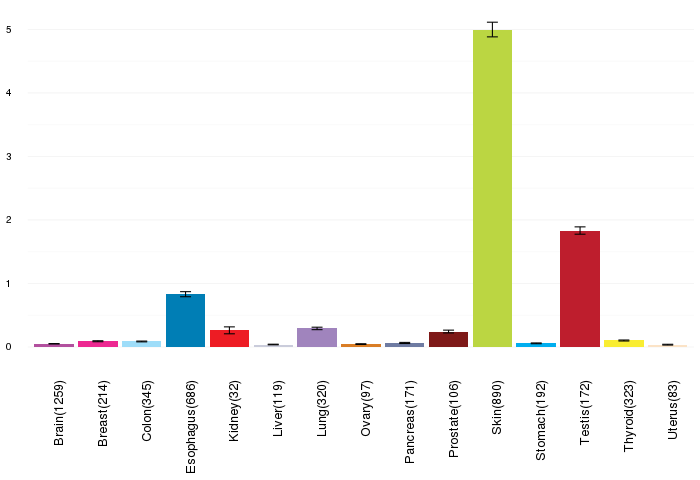 |
| Different expressions across 14 cancer types with more than 10 samples between matched tumors and normals (X-axis: cancer type and Y-axis: log2(norm_counts+1)) (TCGA IlluminaHiSeq_RNASeqV2, pan-cancer normalized log2(norm_counts+1) data, version 2016-08-16) |
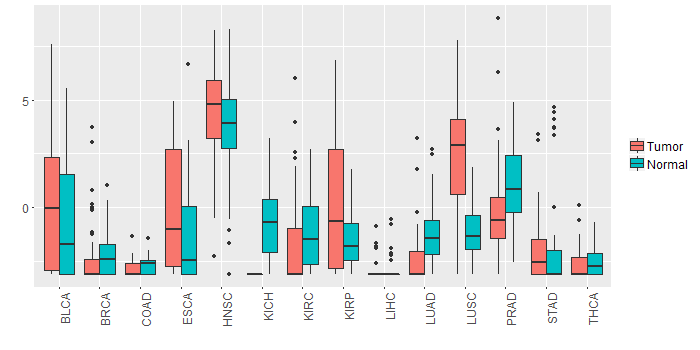 |
| - Significantly differentially expressed cancer types and information. (|Fold change|>1 and FDR<0.05) |
| Cancer type | Mean(exp) in tumor | Mean(exp) in matched normal | Log2FC | P-val. | FDR |
| KICH | -3.107699399 | -0.699355399 | -2.408344 | 1.97E-07 | 8.55E-07 |
| LUSC | 2.209741777 | -1.167005281 | 3.376747059 | 1.72E-10 | 6.32E-10 |
| KIRP | -0.075352524 | -1.501790024 | 1.4264375 | 0.0197 | 0.039970498 |
| PRAD | -0.184087861 | 1.035744832 | -1.219832692 | 0.00406 | 0.0108315 |
| LUAD | -2.278725261 | -1.225642503 | -1.053082759 | 7.91E-05 | 0.000203465 |
| Top |
| TissGene-miRNA for WFDC5 |
| Significantly anti-correlated miRNAs of TissGene across 28 cancer types (Gene-miRNA relations from TargetScanHuman Relsease 7.1, Conserved_Site_Context_Scores.txt.zip, 06.01.2016) (TCGA IlluminaHiSeq_miRNASeq, log2(RPM+1) data, version 2016-11-21) (TCGA IlluminaHiSeq_RNASeqV2, log2(normalized_count+1) data, version 2016-08-16) (Spearman’s Rank Correlation (p-value<0.05 and coefficient<-0.25)) |
| Cancer type | miRNA id | miRNA accession | P-val. | Coeff. | # samples |
| Top |
| TissGeneMut for WFDC5 |
| TissGeneSNV for WFDC5 |
| nsSNV counts per each loci. Different colors of circles represent different cancer types. Circle size denotes number of samples. (TCGA somatic mutation (SNPs and small INDELs) data, version 2016-04-25) * Click on the image to enlarge it in a new window. |
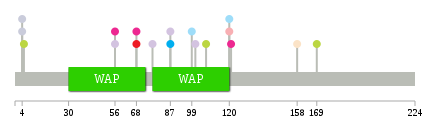 |
 |
| Somatic nucleotide variants of TissGene across 28 cancer types (X-axis: cancer type and Y-axis: % of mutated samples) The numbers in parentheses are numbers of samples with mutation (nsSNVs). (TCGA somatic mutation (SNPs and small INDELs) data, version 2016-04-25) |
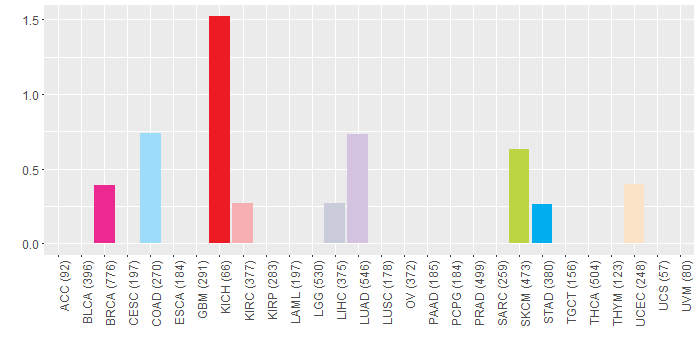 |
| - nsSNVs sorted by frequency. |
| AAchange | Cancer type | # samples |
| p.A158T | UCEC | 1 |
| p.P56L | BRCA | 1 |
| p.D101Y | LUAD | 1 |
| p.P56H | LUAD | 1 |
| p.Q4X | LIHC | 1 |
| p.S5N | SKCM | 1 |
| p.A121D | BRCA | 1 |
| p.R87S | LUAD | 1 |
| p.R68C | BRCA | 1 |
| p.R68H | KICH | 1 |
| p.P120H | KIRC | 1 |
| p.R107Q | SKCM | 1 |
| p.R169Q | SKCM | 1 |
| p.R87C | STAD | 1 |
| p.Q4* | LIHC | 1 |
| p.P120H | COAD | 1 |
| p.D99N | COAD | 1 |
| p.K77M | LUAD | 1 |
| Top |
| TissGeneCNV for WFDC5 |
| Copy number variations of TissGene across 28 cancer types (X-axis: cancer type and Y-axis: % of CNV samples) (TCGA Gistic2_CopyNumber_Gistic2_all_data_by_genes, Gistic2 copy number data, version 2016-08-16) |
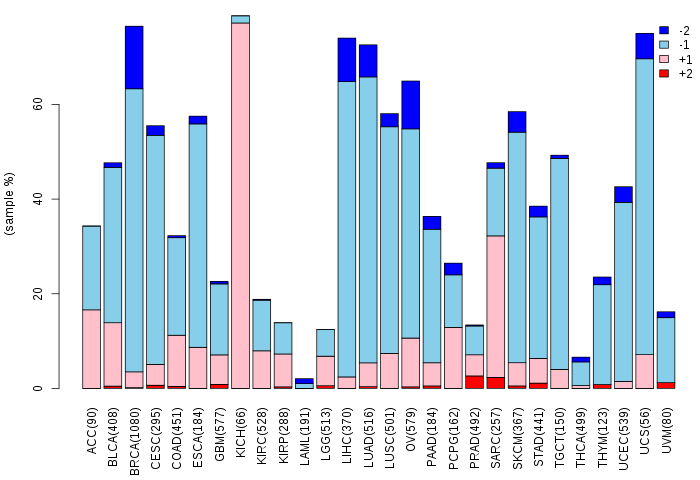 |
| Top |
| TissGeneFusions for WFDC5 |
| Fusion genes including TissGene (ChimerDB 3.0, 2016-12-01 and TCGA fusion Portal 2015-12-01) |
| Database | Src | Cancer type | Sample | Fusion gene | ORF | 5'-gene BP | 3'-gene BP |
| Top |
| TissGeneNet for WFDC5 |
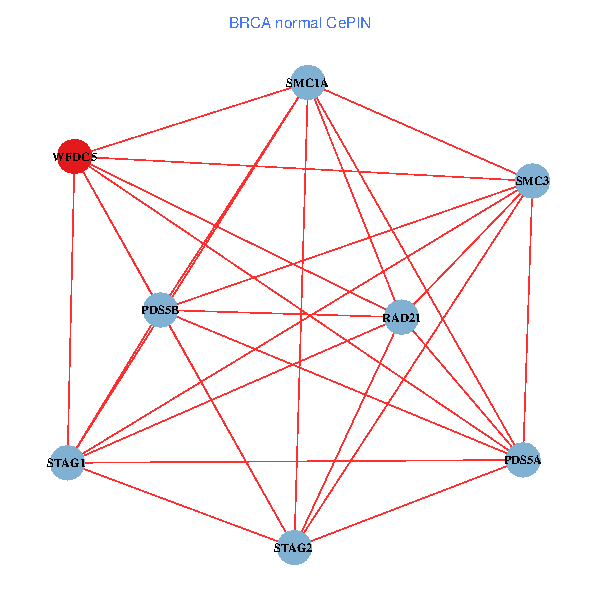
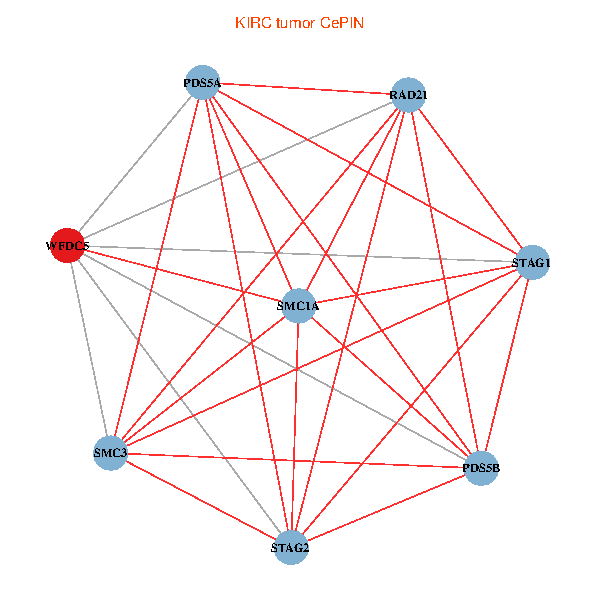
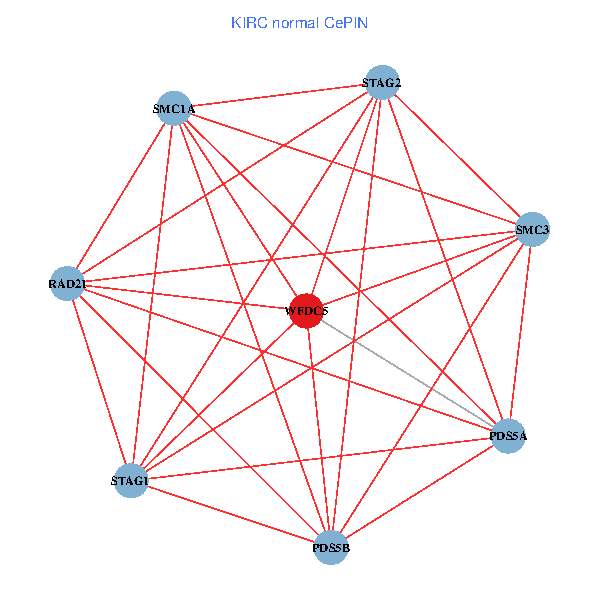
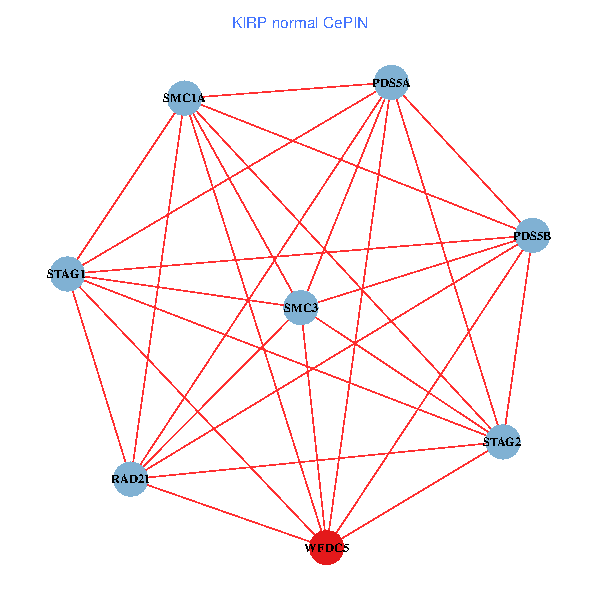
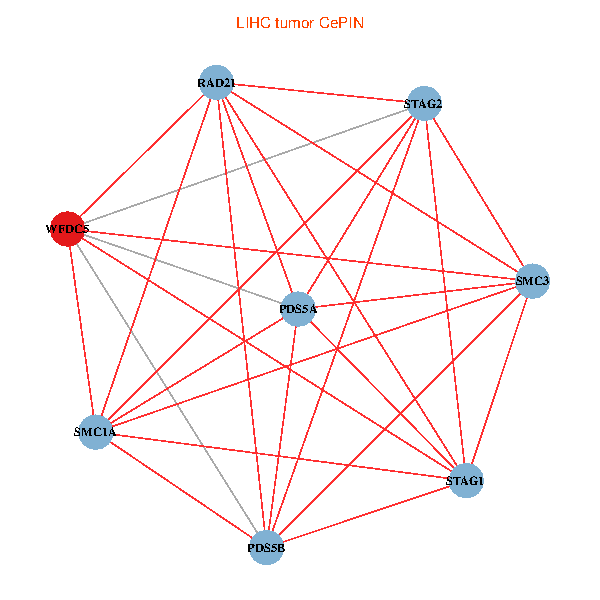
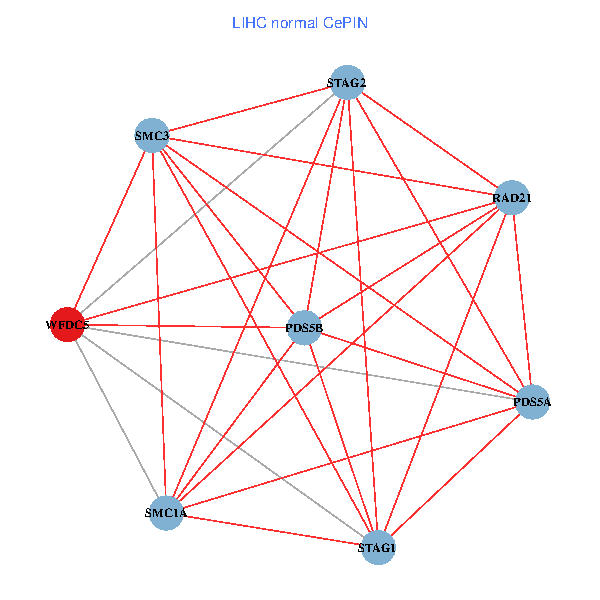
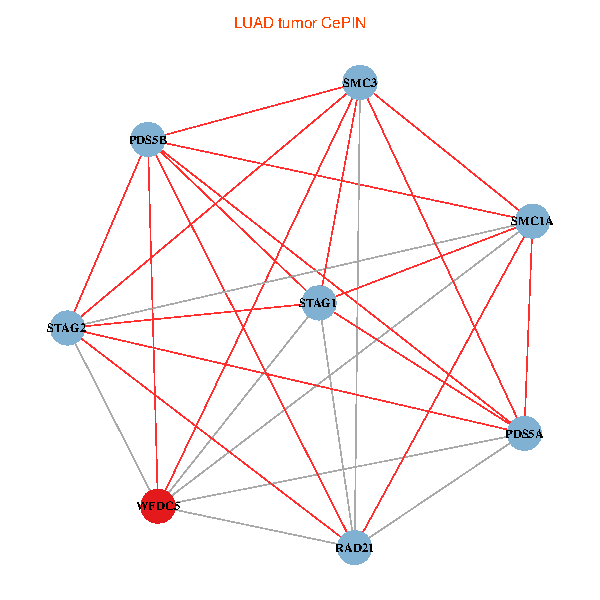
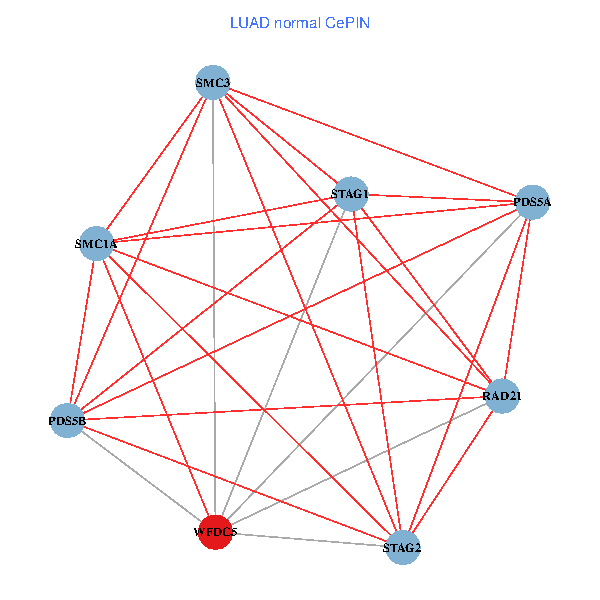
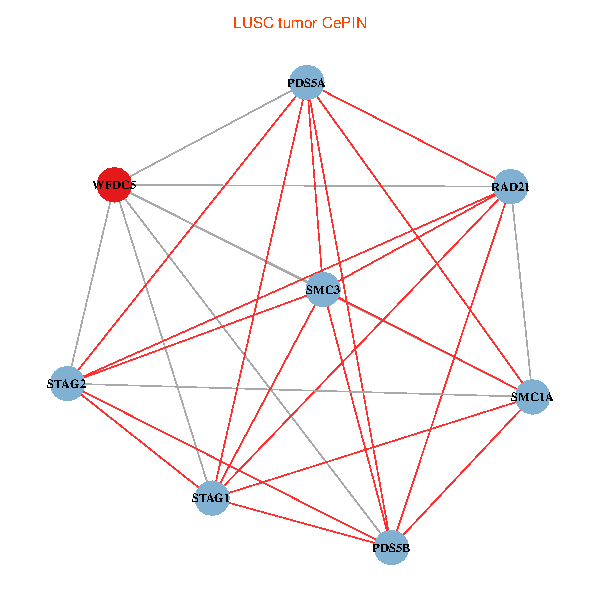
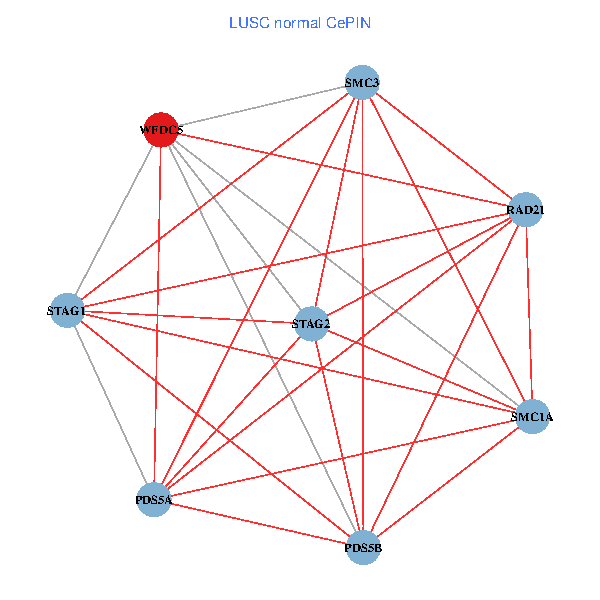
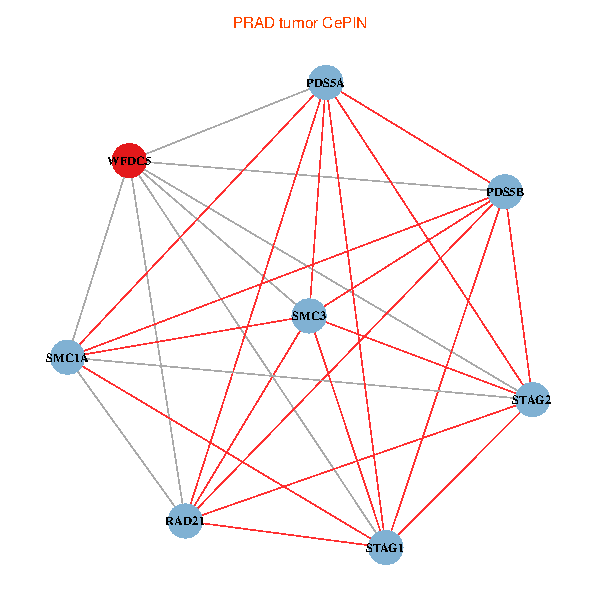
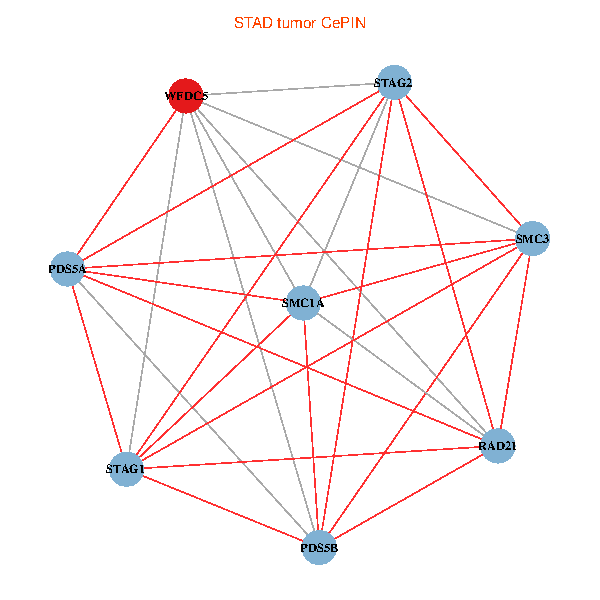
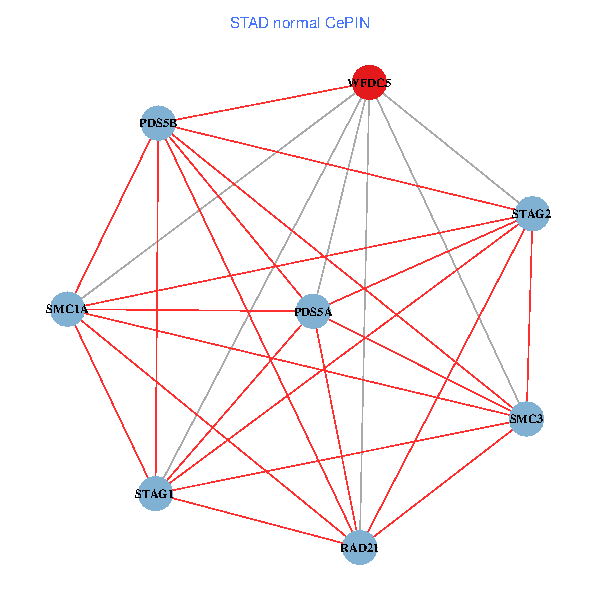
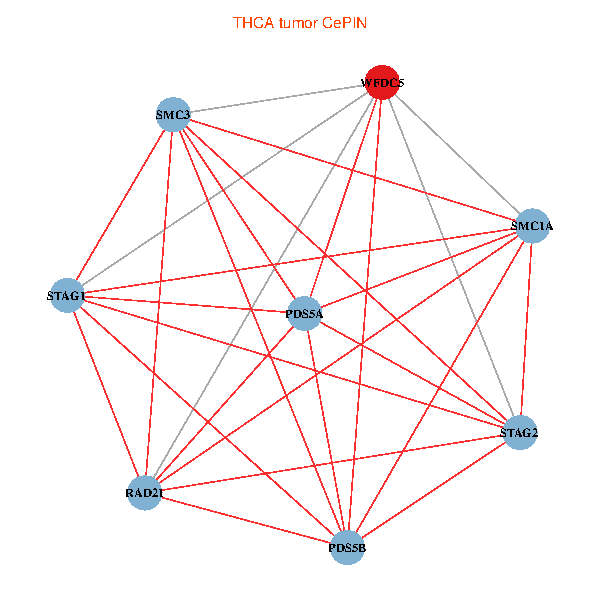
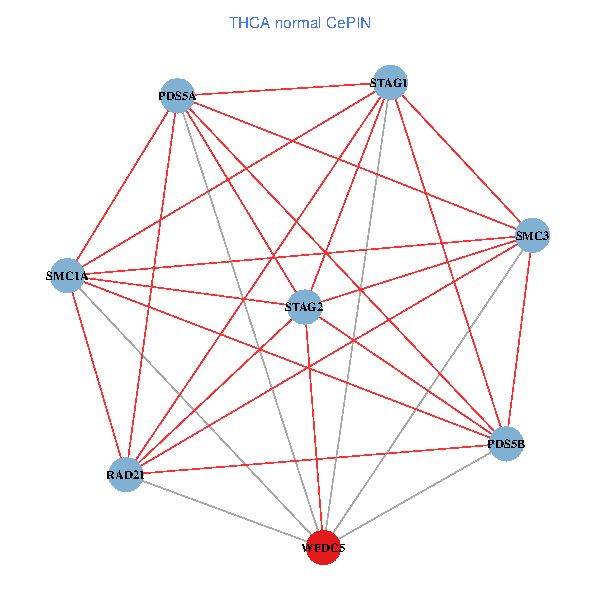
| Co-expressed gene networks based on protein-protein interaction data (CePIN) (TCGA IlluminaHiSeq_RNASeqV2, pan-cancer normalized log2(norm_counts+1) data, version 2016-08-16) (PINA2 ppi data) |
| BRCA (tumor) | BRCA (normal) |
| WFDC5, PDS5B, RAD21, SMC1A, SMC3, STAG2, PDS5A, STAG1 (tumor) | WFDC5, PDS5B, RAD21, SMC1A, SMC3, STAG2, PDS5A, STAG1 (normal) |
 |  |
| COAD (tumor) | COAD (normal) |
| WFDC5, PDS5B, RAD21, SMC1A, SMC3, STAG2, PDS5A, STAG1 (tumor) | WFDC5, PDS5B, RAD21, SMC1A, SMC3, STAG2, PDS5A, STAG1 (normal) |
 | 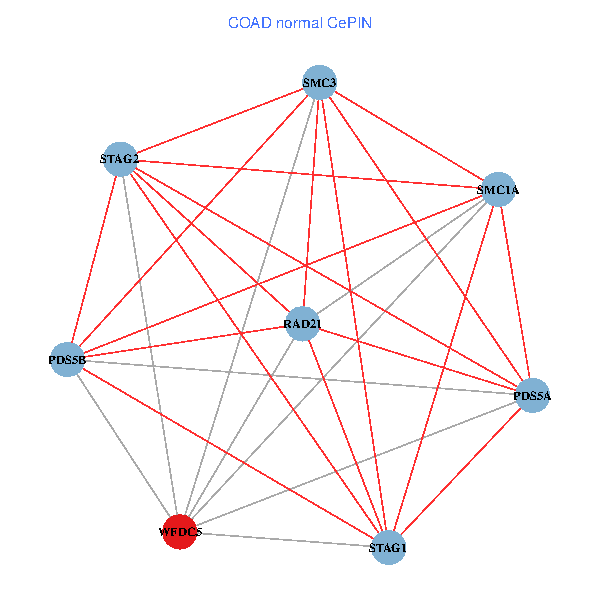 |
| HNSC (tumor) | HNSC (normal) |
| WFDC5, PDS5B, RAD21, SMC1A, SMC3, STAG2, PDS5A, STAG1 (tumor) | WFDC5, PDS5B, RAD21, SMC1A, SMC3, STAG2, PDS5A, STAG1 (normal) |
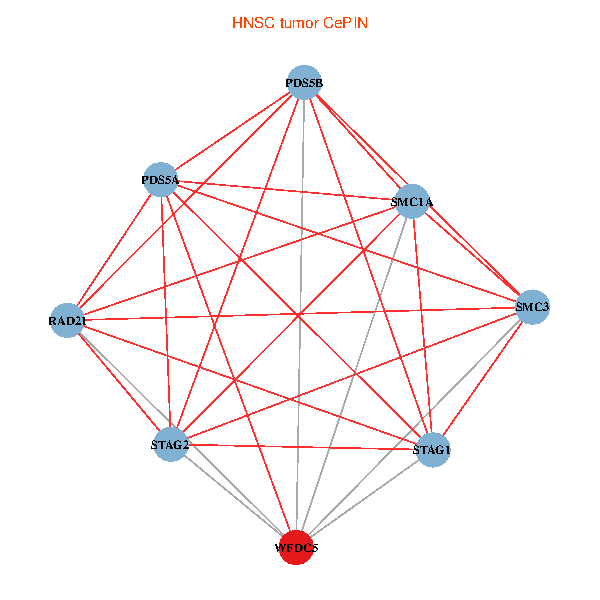 | 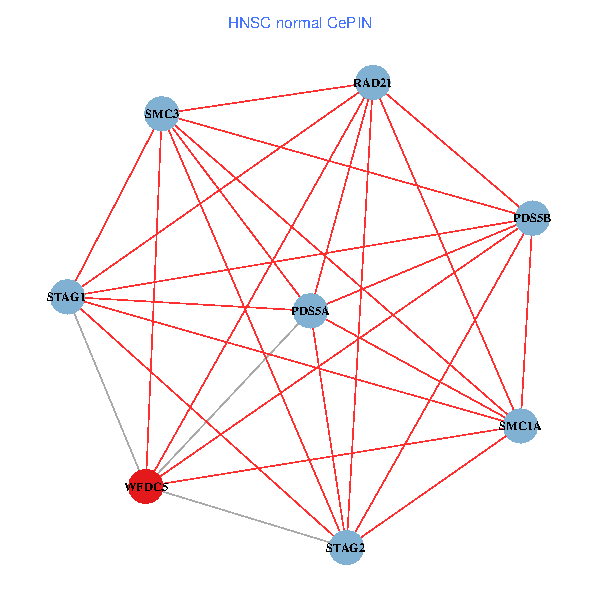 |
| KICH (tumor) | KICH (normal) |
| WFDC5, PDS5B, RAD21, SMC1A, SMC3, STAG2, PDS5A, STAG1 (tumor) | WFDC5, PDS5B, RAD21, SMC1A, SMC3, STAG2, PDS5A, STAG1 (normal) |
 | 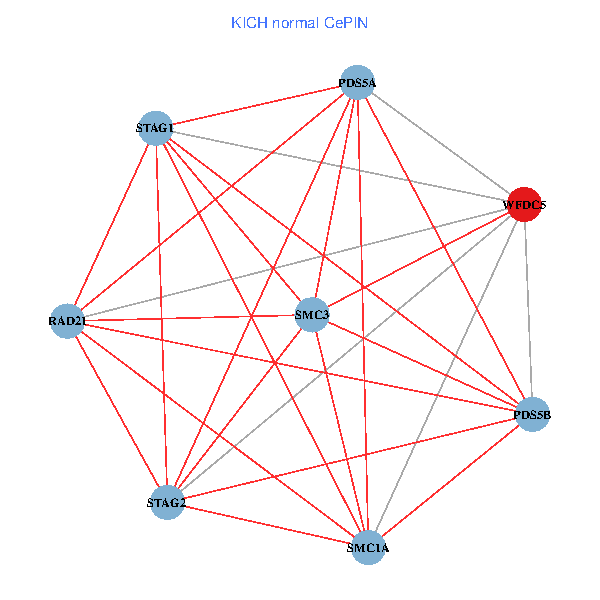 |
| KIRC (tumor) | KIRC (normal) |
| WFDC5, PDS5B, RAD21, SMC1A, SMC3, STAG2, PDS5A, STAG1 (tumor) | WFDC5, PDS5B, RAD21, SMC1A, SMC3, STAG2, PDS5A, STAG1 (normal) |
 |  |
| KIRP (tumor) | KIRP (normal) |
| WFDC5, PDS5B, RAD21, SMC1A, SMC3, STAG2, PDS5A, STAG1 (tumor) | WFDC5, PDS5B, RAD21, SMC1A, SMC3, STAG2, PDS5A, STAG1 (normal) |
 |  |
| LIHC (tumor) | LIHC (normal) |
| WFDC5, PDS5B, RAD21, SMC1A, SMC3, STAG2, PDS5A, STAG1 (tumor) | WFDC5, PDS5B, RAD21, SMC1A, SMC3, STAG2, PDS5A, STAG1 (normal) |
 |  |
| LUAD (tumor) | LUAD (normal) |
| WFDC5, PDS5B, RAD21, SMC1A, SMC3, STAG2, PDS5A, STAG1 (tumor) | WFDC5, PDS5B, RAD21, SMC1A, SMC3, STAG2, PDS5A, STAG1 (normal) |
 |  |
| LUSC (tumor) | LUSC (normal) |
| WFDC5, PDS5B, RAD21, SMC1A, SMC3, STAG2, PDS5A, STAG1 (tumor) | WFDC5, PDS5B, RAD21, SMC1A, SMC3, STAG2, PDS5A, STAG1 (normal) |
 |  |
| PRAD (tumor) | PRAD (normal) |
| WFDC5, PDS5B, RAD21, SMC1A, SMC3, STAG2, PDS5A, STAG1 (tumor) | WFDC5, PDS5B, RAD21, SMC1A, SMC3, STAG2, PDS5A, STAG1 (normal) |
 |  |
| STAD (tumor) | STAD (normal) |
| WFDC5, PDS5B, RAD21, SMC1A, SMC3, STAG2, PDS5A, STAG1 (tumor) | WFDC5, PDS5B, RAD21, SMC1A, SMC3, STAG2, PDS5A, STAG1 (normal) |
 |  |
| THCA (tumor) | THCA (normal) |
| WFDC5, PDS5B, RAD21, SMC1A, SMC3, STAG2, PDS5A, STAG1 (tumor) | WFDC5, PDS5B, RAD21, SMC1A, SMC3, STAG2, PDS5A, STAG1 (normal) |
 |  |
| Top |
| TissGeneProg for WFDC5 |
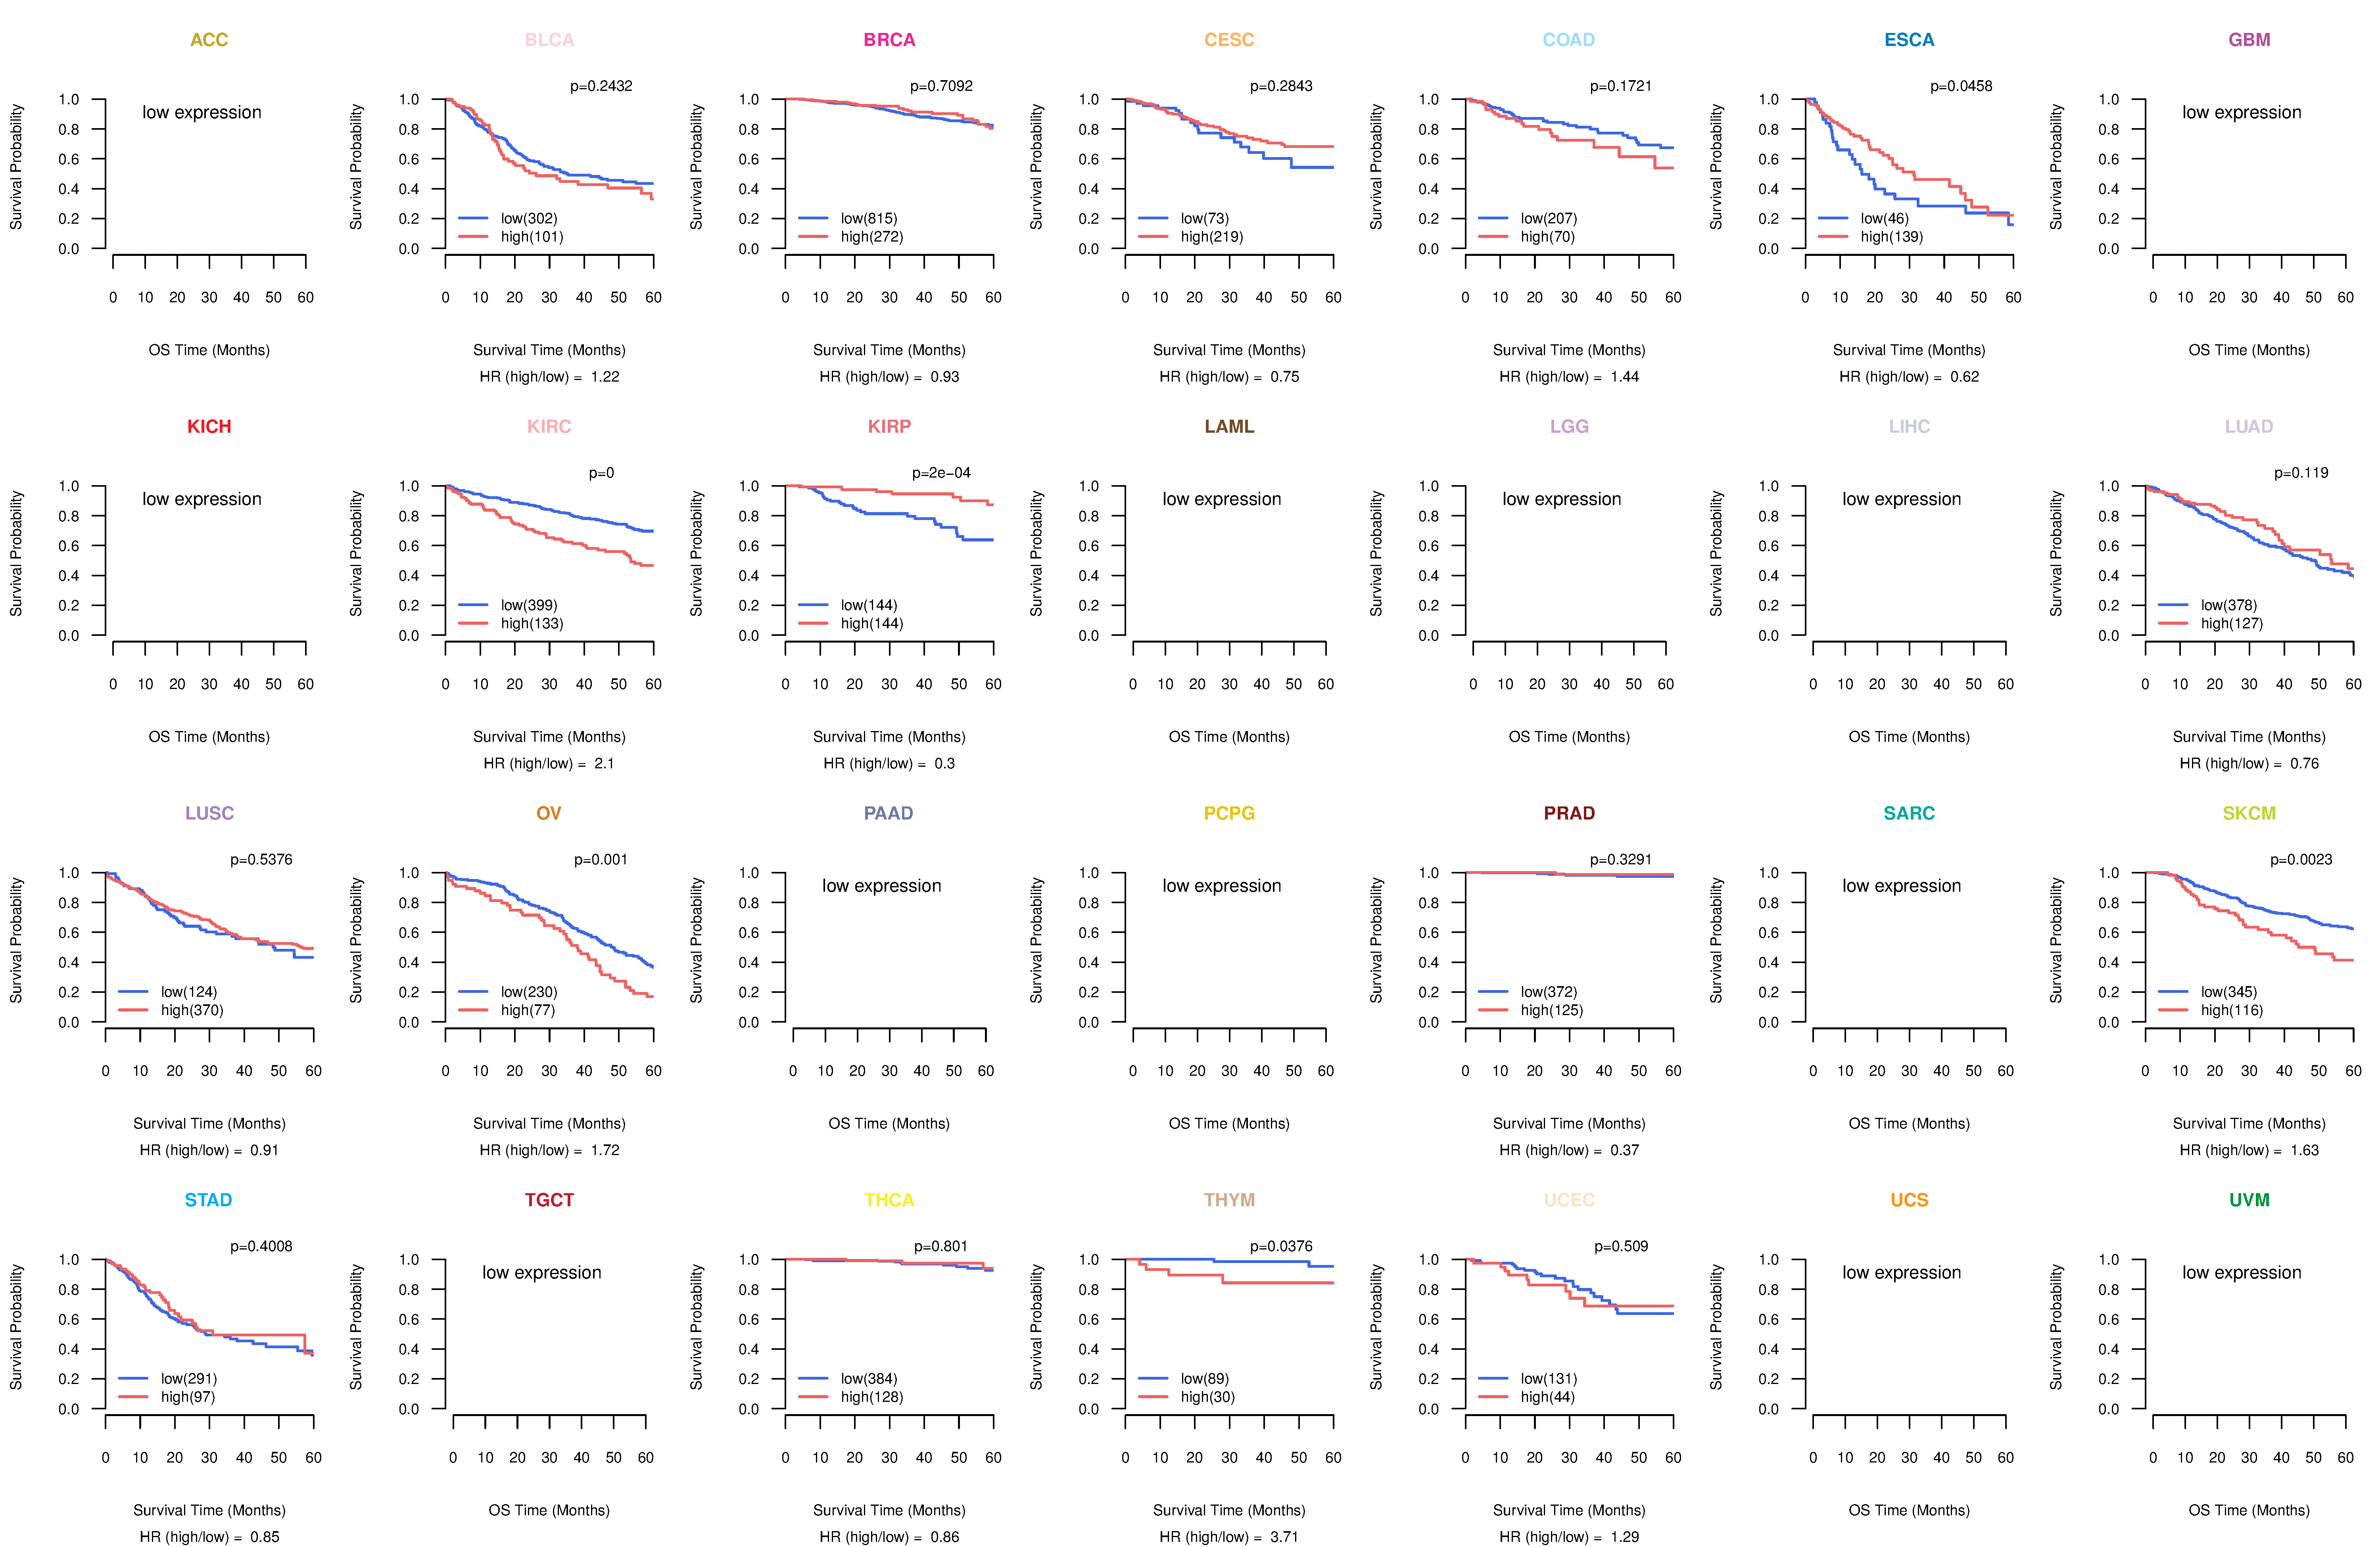
| Kaplan-Meier plots with logrank tests of overall survival (OS) using 28 cancer types (TCGA IlluminaHiSeq_RNASeqV2, pan-cancer normalized log2(norm_counts+1) data, version 2016-08-16) (TCGA clinicalMatrix, phenotype data, version 2016-04-27) * Click on the image to enlarge it in a new window. |
 |
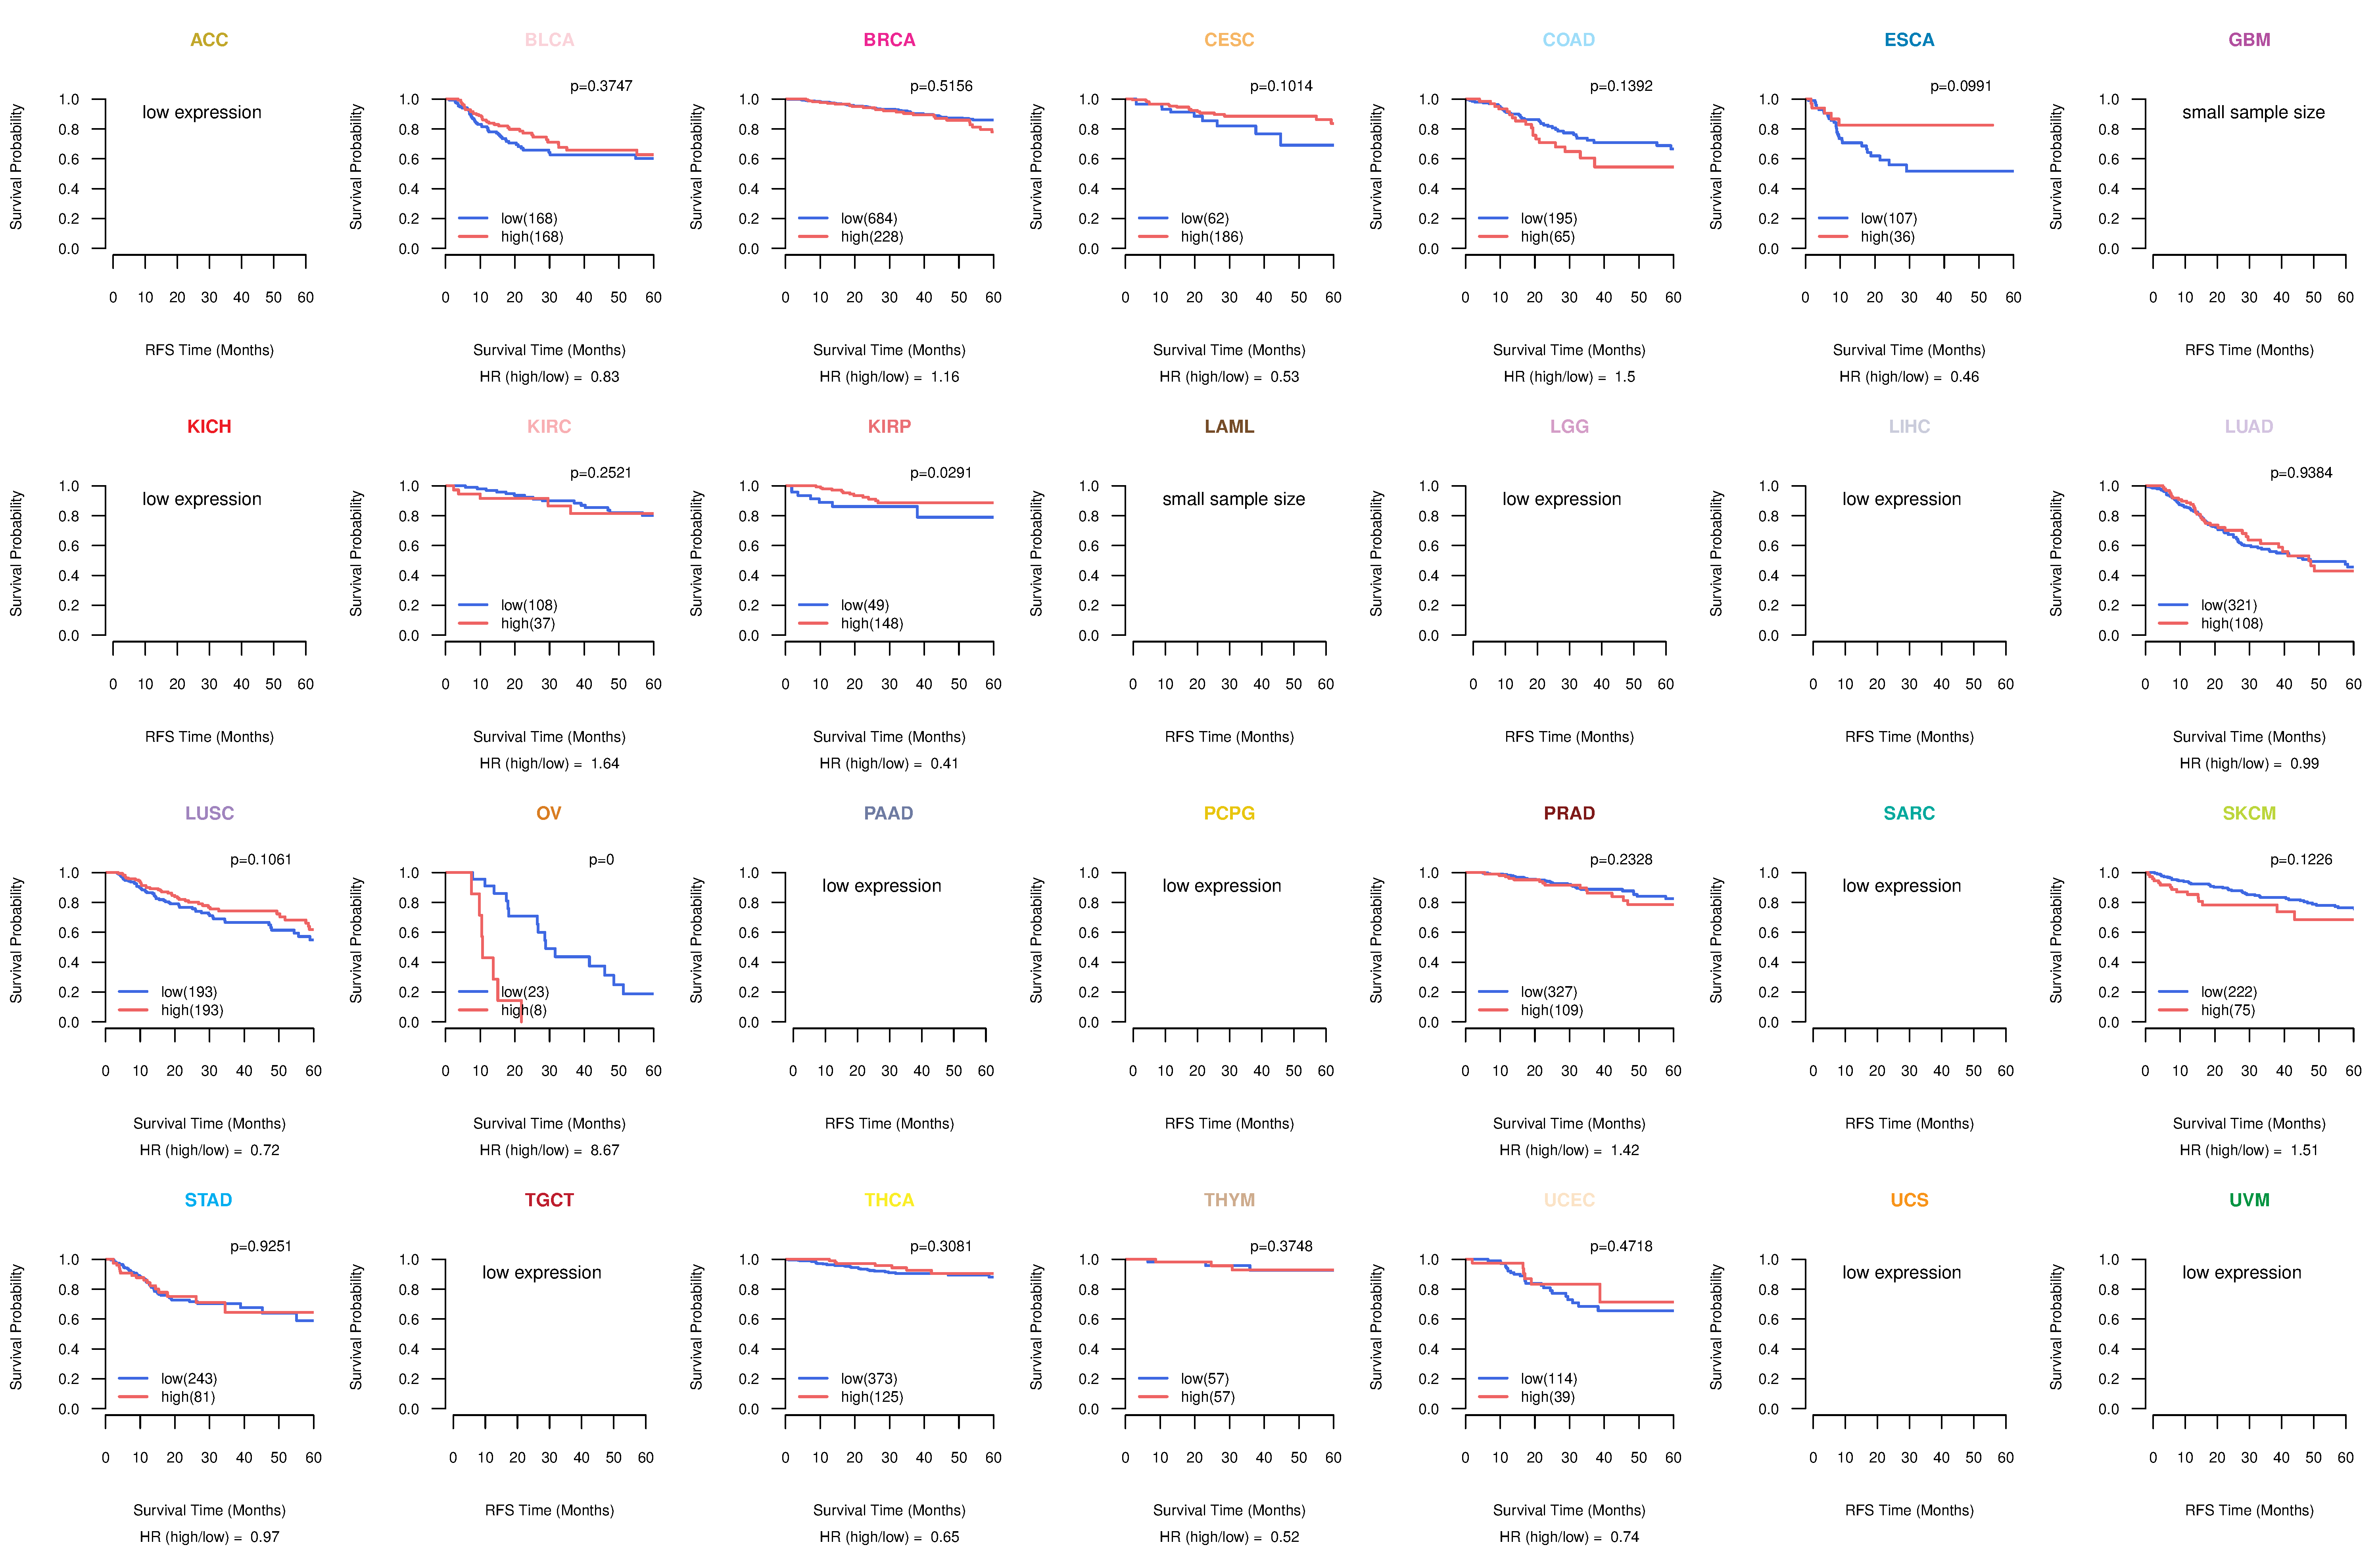
| Kaplan-Meier plots with logrank test of relapse free survival (RFS) using 28 cancer types (TCGA IlluminaHiSeq_RNASeqV2, pan-cancer normalized log2(norm_counts+1) data, version 2016-08-16) (TCGA clinicalMatrix, phenotype data, version 2016-04-27) * Click on the image enlarge it in a new window. |
 |
| Forest plot of Cox proportional hazard ratio (HR) and 95% CI of overall survival (OS) using 28 cancer types (TCGA IlluminaHiSeq_RNASeqV2, pan-cancer normalized log2(norm_counts+1) data, version 2016-08-16) (TCGA clinicalMatrix, phenotype data, version 2016-04-27) * Click on the image enlarge it in a new window. |
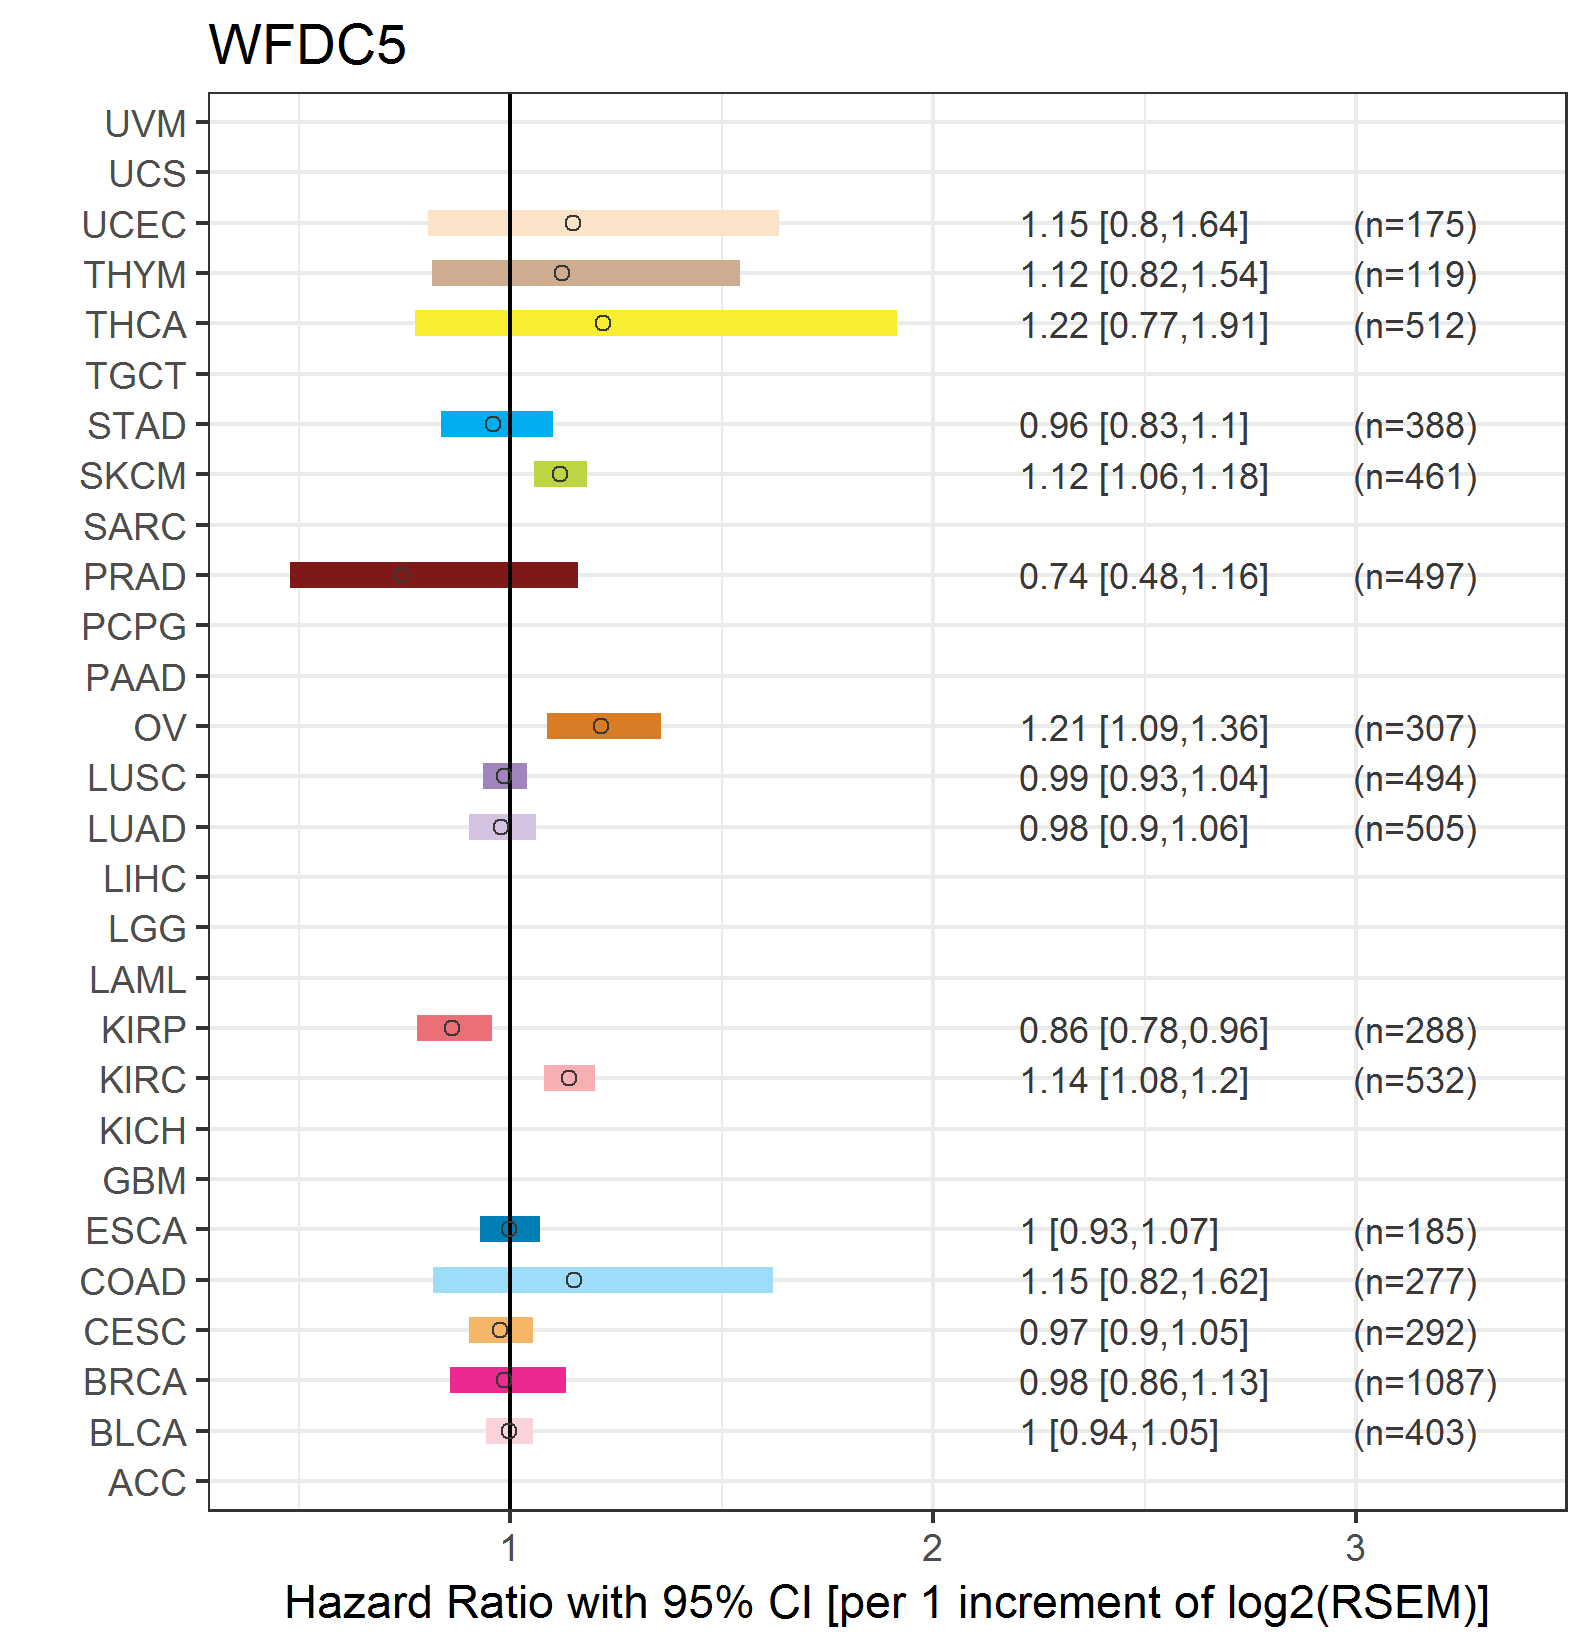 |
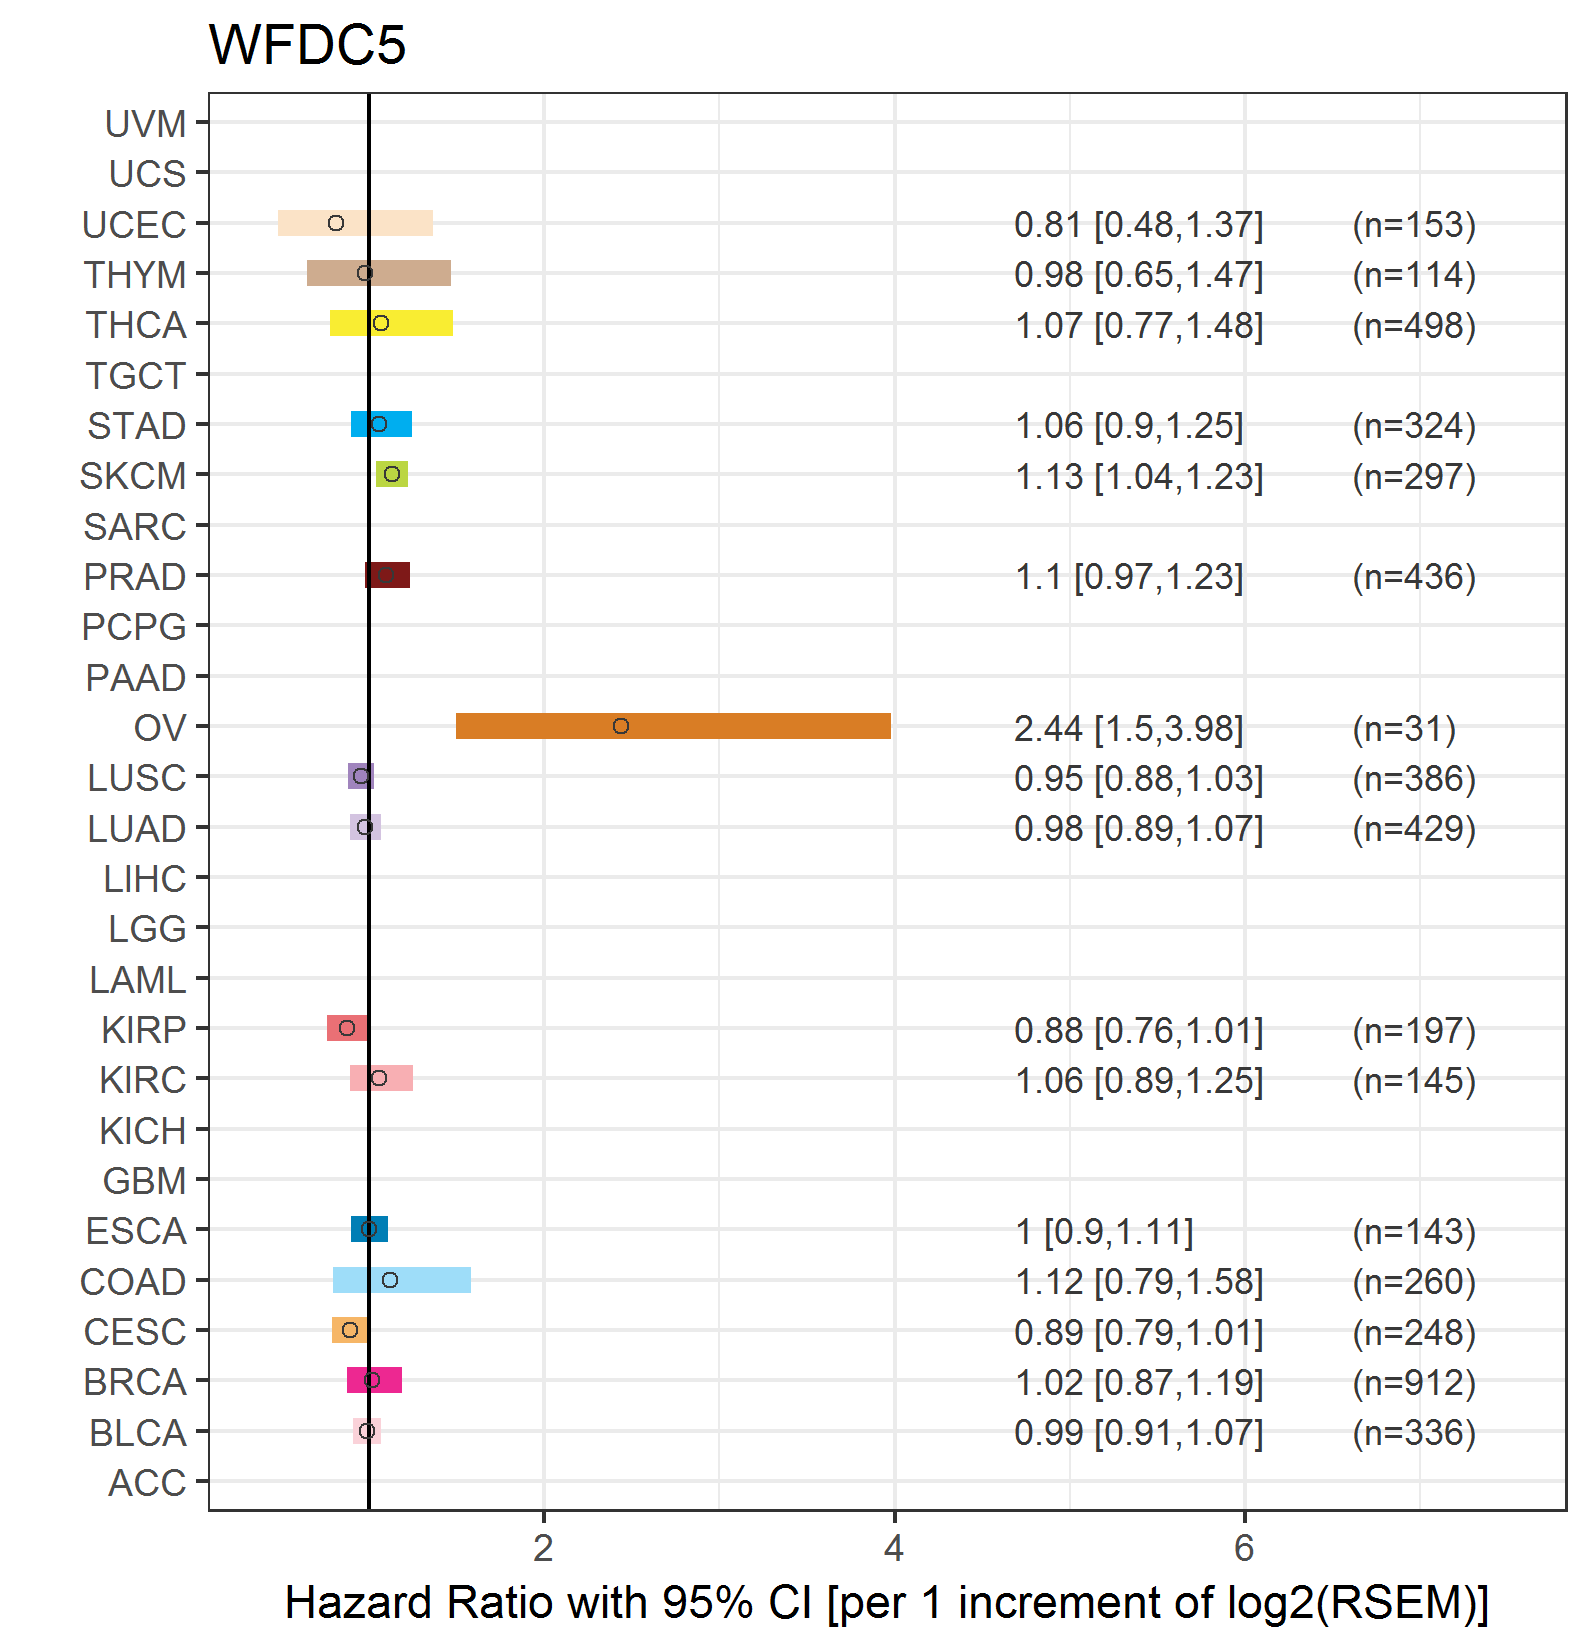
| Forest plot of Cox proportional hazard ratio (HR) and 95% CI of relapse free survival (RFS) using 28 cancer types (TCGA IlluminaHiSeq_RNASeqV2, pan-cancer normalized log2(norm_counts+1) data, version 2016-08-16) (TCGA clinicalMatrix, phenotype data, version 2016-04-27) * Click on the image enlarge it in a new window. |
 |
| Top |
| TissGeneClin for WFDC5 |
| TissGeneDrug for WFDC5 |
| Drug information targeting TissGene (DrugBank Version 5.0.6, 2017-04-01) |
| DrugBank ID | Drug name | Drug activity | Drug type | Drug status |
| Top |
| TissGeneDisease for WFDC5 |
| Disease information associated with TissGene (DisGeNet, 2016-06-01) |
| Disease ID | Disease name | # pubmeds | Source |
| umls:C0596263 | Carcinogenesis | 1 | BeFree |
|
Copyright 2016-Present - The University of Texas Health Science Center at Houston (UTHealth) Web File Viewing | How to Report, Fraud, Waste and Abuse | State of Texas | Statewide Search | Texas Homeland Security | Site Policies |