 |
| |
| |
| |
| |
| |
| |
|

| TissGeneSummary for SGOL2 |
 Gene summary Gene summary |
| Basic gene information | Gene symbol | SGOL2 |
| Gene name | shugoshin-like 2 (S. pombe) | |
| Synonyms | SGO2|TRIPIN | |
| Cytomap | UCSC genome browser: 2q33.1 | |
| Type of gene | protein-coding | |
| RefGenes | NM_001160033.1, NM_001160046.1,NM_152524.5, | |
| Description | shugoshin-2shugoshin-like 2 | |
| Modification date | 20141207 | |
| dbXrefs | MIM : 612425 | |
| HGNC : HGNC | ||
| Ensembl : ENSG00000163535 | ||
| HPRD : 11555 | ||
| Vega : OTTHUMG00000154535 | ||
| Protein | UniProt: go to UniProt's Cross Reference DB Table | |
| Expression | CleanEX: HS_SGOL2 | |
| BioGPS: 151246 | ||
| Pathway | NCI Pathway Interaction Database: SGOL2 | |
| KEGG: SGOL2 | ||
| REACTOME: SGOL2 | ||
| Pathway Commons: SGOL2 | ||
| Context | iHOP: SGOL2 | |
| ligand binding site mutation search in PubMed: SGOL2 | ||
| UCL Cancer Institute: SGOL2 | ||
| Assigned class in TissGDB* | C | |
| Included tissue-specific gene expression resources | HPA,TiGER | |
| Specific-tissues in normal samples (assigned by TissGDB using HPA, TiGER, and GTEx) | Testis | |
| Cancer types related to the specific-tissues in cancer samples (assigned by TissGDB using TCGA) | TGCT | |
| Reference showing the relevant tissue of SGOL2 | ||
| Description by TissGene annotations | ||
| * Class A consists of genes with literature evidence and is part of the cTissGenes. Class B consists of only cTissGenes without additional evidence. The remaining genes belong to Class C. |
| Gene ontology having evidence of Inferred from Direct Assay (IDA) from Entrez |
| GO ID | GO term | PubMed ID |
| Top |
| TissGeneExp for SGOL2 |
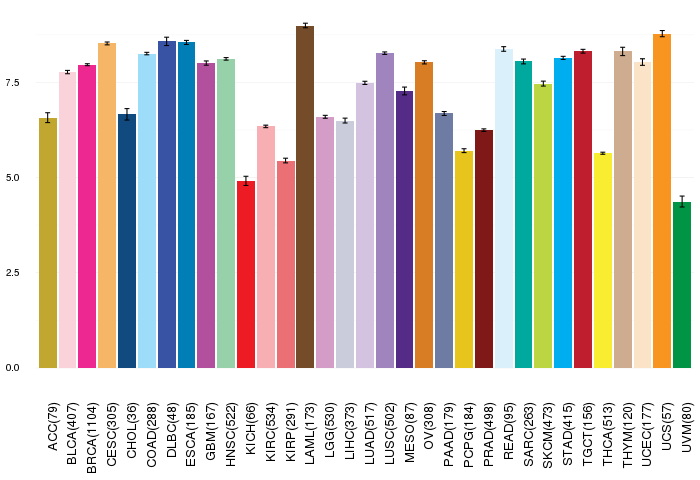
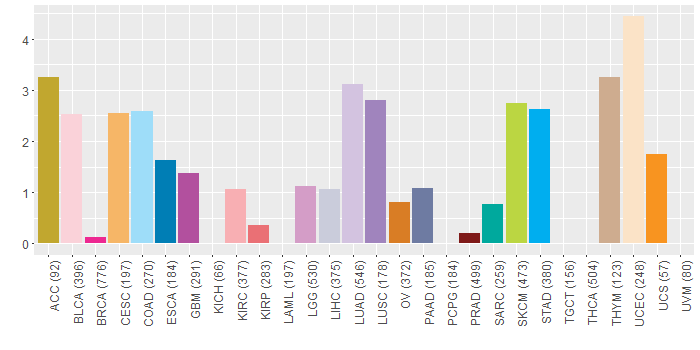
| Gene expressions across 28 cancer types (X-axis: cancer type and Y-axis: log2(norm_counts+1)) (TCGA IlluminaHiSeq_RNASeqV2, pan-cancer normalized log2(norm_counts+1) data, version 2016-08-16) |
 |
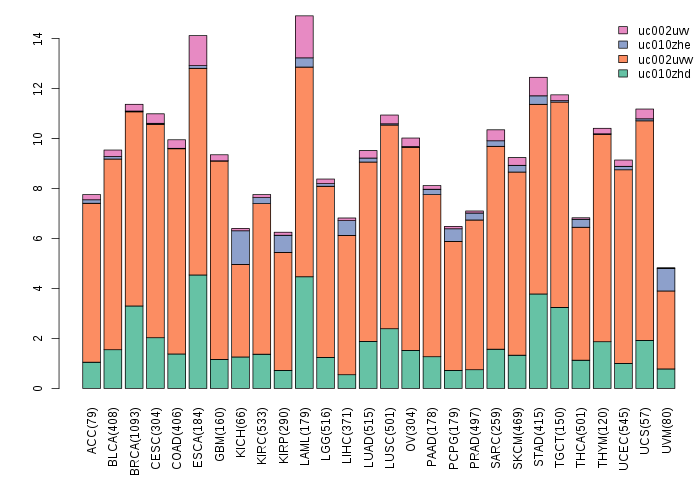
| Gene isoform expressions across 28 cancer types (X-axis: cancer type and Y-axis: log2(norm_counts+1)) (TCGA pan-cancer tcga_rsem_isoform_tpm, version 2016-09-01) |
 |
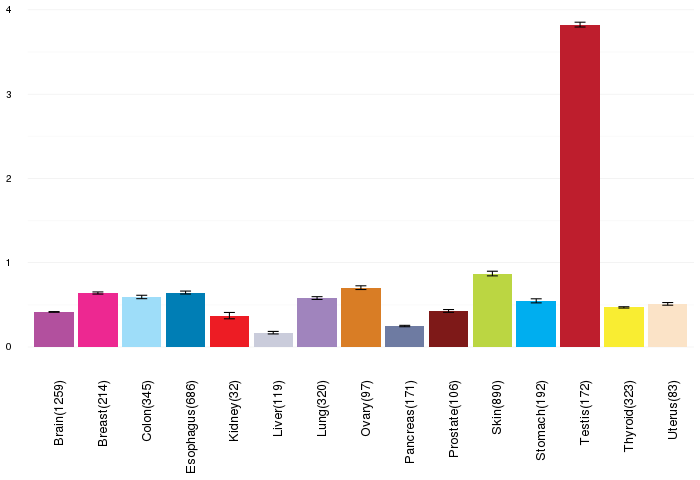
| Gene expressions across normal tissues of GTEx data (GTEx GTEx_Analysis_v6_RNA-seq_RNA-SeQCv1.1.8_gene_rpkm.gct) - Here, we shows the matched tissue types only among our 28 cancer types. |
 |
| Different expressions across 14 cancer types with more than 10 samples between matched tumors and normals (X-axis: cancer type and Y-axis: log2(norm_counts+1)) (TCGA IlluminaHiSeq_RNASeqV2, pan-cancer normalized log2(norm_counts+1) data, version 2016-08-16) |
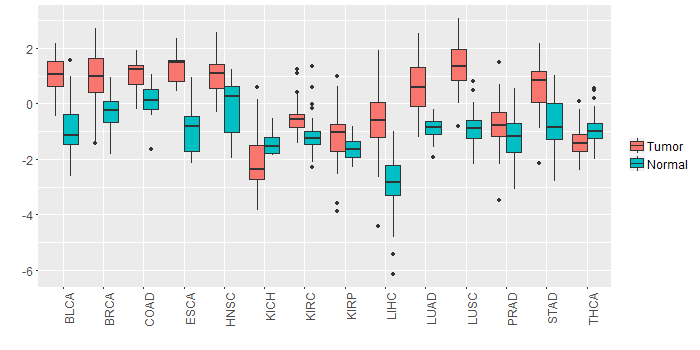 |
| - Significantly differentially expressed cancer types and information. (|Fold change|>1 and FDR<0.05) |
| Cancer type | Mean(exp) in tumor | Mean(exp) in matched normal | Log2FC | P-val. | FDR |
| LUAD | 0.541519015 | -0.889967192 | 1.431486207 | 4.91E-17 | 6.12E-16 |
| HNSC | 0.998835374 | -0.090206486 | 1.08904186 | 4.23E-08 | 4.47E-07 |
| BLCA | 1.039970013 | -0.82241946 | 1.862389474 | 5.64E-07 | 2.13E-05 |
| LIHC | -0.656091881 | -2.894585881 | 2.238494 | 4.34E-17 | 1.97E-15 |
| BRCA | 0.996724399 | -0.301068583 | 1.297792982 | 1.29E-29 | 1.66E-28 |
| LUSC | 1.369792511 | -0.903019254 | 2.272811765 | 4.48E-28 | 1.46E-26 |
| STAD | 0.627618369 | -0.723547256 | 1.351165625 | 6.01E-07 | 1.08E-05 |
| ESCA | 1.277066664 | -0.902315154 | 2.179381818 | 7.32E-06 | 0.000913862 |
| Top |
| TissGene-miRNA for SGOL2 |
| Significantly anti-correlated miRNAs of TissGene across 28 cancer types (Gene-miRNA relations from TargetScanHuman Relsease 7.1, Conserved_Site_Context_Scores.txt.zip, 06.01.2016) (TCGA IlluminaHiSeq_miRNASeq, log2(RPM+1) data, version 2016-11-21) (TCGA IlluminaHiSeq_RNASeqV2, log2(normalized_count+1) data, version 2016-08-16) (Spearman’s Rank Correlation (p-value<0.05 and coefficient<-0.25)) |
| Cancer type | miRNA id | miRNA accession | P-val. | Coeff. | # samples |
| Top |
| TissGeneMut for SGOL2 |
| TissGeneSNV for SGOL2 |
| nsSNV counts per each loci. Different colors of circles represent different cancer types. Circle size denotes number of samples. (TCGA somatic mutation (SNPs and small INDELs) data, version 2016-04-25) * Click on the image to enlarge it in a new window. |
 |
| Somatic nucleotide variants of TissGene across 28 cancer types (X-axis: cancer type and Y-axis: % of mutated samples) The numbers in parentheses are numbers of samples with mutation (nsSNVs). (TCGA somatic mutation (SNPs and small INDELs) data, version 2016-04-25) |
 |
| - nsSNVs sorted by frequency. |
| AAchange | Cancer type | # samples |
| p.H242Y | SKCM | 2 |
| p.Q323X | COAD | 1 |
| p.S1187I | LUAD | 1 |
| p.N283S | SARC | 1 |
| p.N904Y | LUAD | 1 |
| p.R1156C | SKCM | 1 |
| p.M124I | HNSC | 1 |
| p.V858F | LGG | 1 |
| p.D892N | BLCA | 1 |
| p.K1106N | OV | 1 |
| p.E339* | UCEC | 1 |
| p.R675T | BRCA | 1 |
| p.E935Q | HNSC | 1 |
| p.Q256H | LUAD | 1 |
| p.R718W | UCEC | 1 |
| p.R1156C | UCEC | 1 |
| p.S334F | SKCM | 1 |
| p.E392Q | BLCA | 1 |
| p.S990P | UCEC | 1 |
| p.Q703R | KIRC | 1 |
| p.R675K | LIHC | 1 |
| p.R495I | STAD | 1 |
| p.R260H | LGG | 1 |
| p.R153C | COAD | 1 |
| p.S780F | SKCM | 1 |
| p.I1147R | SKCM | 1 |
| p.E85Q | LUSC | 1 |
| p.D634H | CESC | 1 |
| p.Q702* | LUAD | 1 |
| p.S226Y | UCEC | 1 |
| p.D940E | KIRC | 1 |
| p.I39K | ACC | 1 |
| p.S204L | UCS | 1 |
| p.S204L | STAD | 1 |
| p.E1236Q | CESC | 1 |
| p.T184P | STAD | 1 |
| p.Q347E | LUSC | 1 |
| p.M174K | LUAD | 1 |
| p.G449C | UCEC | 1 |
| p.E854Q | BLCA | 1 |
| p.S1235* | BLCA | 1 |
| p.S979F | SKCM | 1 |
| p.I496V | COAD | 1 |
| p.D866V | SKCM | 1 |
| p.D109G | LGG | 1 |
| p.E392K | BLCA | 1 |
| p.E659X | THYM | 1 |
| p.T565K | GBM | 1 |
| p.L592F | BLCA | 1 |
| p.K1054E | SKCM | 1 |
| p.E92* | OV | 1 |
| p.S247Y | UCEC | 1 |
| p.Y889C | LGG | 1 |
| p.D801E | UCS | 1 |
| p.E499K | HNSC | 1 |
| p.G449S | ESCA | 1 |
| p.S624Y | UCEC | 1 |
| p.L118F | BLCA | 1 |
| p.G644S | STAD | 1 |
| p.R415I | BLCA | 1 |
| p.R144Q | COAD | 1 |
| p.N904K | GBM | 1 |
| p.L868I | UCEC | 1 |
| p.H514Y | SKCM | 1 |
| p.D546G | LUAD | 1 |
| p.K1200N | LUAD | 1 |
| p.K472N | KIRP | 1 |
| p.R412I | READ | 1 |
| p.Q175X | THYM | 1 |
| p.K27N | ACC | 1 |
| p.N164S | KIRC | 1 |
| p.Q857E | OV | 1 |
| p.R260L | THYM | 1 |
| p.Q466P | STAD | 1 |
| p.I722L | ESCA | 1 |
| p.V638L | LUAD | 1 |
| p.N660S | COAD | 1 |
| p.I75V | LUAD | 1 |
| p.E655* | BLCA | 1 |
| p.V833L | THYM | 1 |
| p.K141X | CHOL | 1 |
| p.D170N | SKCM | 1 |
| p.N731K | LUSC | 1 |
| p.E392X | ESCA | 1 |
| p.I1210M | STAD | 1 |
| p.S525F | SKCM | 1 |
| p.L329R | UCEC | 1 |
| p.N1127H | COAD | 1 |
| p.E827D | STAD | 1 |
| p.G9D | COAD | 1 |
| p.R324I | UCEC | 1 |
| p.I558S | UCEC | 1 |
| p.L581V | UCS | 1 |
| p.Q694H | HNSC | 1 |
| p.Q1068H | LUSC | 1 |
| p.D353N | PAAD | 1 |
| p.L81I | UCEC | 1 |
| p.E516Q | LUAD | 1 |
| p.R809I | KIRC | 1 |
| p.N561K | UCEC | 1 |
| p.Q955K | LUAD | 1 |
| p.P820T | UCEC | 1 |
| p.Q863H | LUAD | 1 |
| p.D779Y | BLCA | 1 |
| p.L103F | LIHC | 1 |
| p.V701F | LUAD | 1 |
| p.D892Y | CESC | 1 |
| p.M626I | UCEC | 1 |
| p.E969K | GBM | 1 |
| p.E92D | UCEC | 1 |
| p.P1090L | SKCM | 1 |
| p.R809G | LUAD | 1 |
| p.I225F | LUAD | 1 |
| p.R97C | UCEC | 1 |
| p.F1254V | READ | 1 |
| p.M152V | LUAD | 1 |
| p.E310Q | BLCA | 1 |
| p.D422Y | LUSC | 1 |
| p.N874K | UCS | 1 |
| p.L844P | STAD | 1 |
| p.S204L | BLCA | 1 |
| p.S936R | UCEC | 1 |
| p.S1144L | CESC | 1 |
| p.C876* | SARC | 1 |
| p.D928Y | COAD | 1 |
| p.Q1185H | LUSC | 1 |
| p.L1252S | STAD | 1 |
| p.S1250F | ACC | 1 |
| p.K1200N | PRAD | 1 |
| p.Q955R | UCEC | 1 |
| p.K838N | STAD | 1 |
| p.T162N | LGG | 1 |
| p.K385I | UCEC | 1 |
| p.I818V | GBM | 1 |
| p.K988T | COAD | 1 |
| p.D760Y | STAD | 1 |
| p.D1149H | CESC | 1 |
| p.I1062V | LGG | 1 |
| p.H1093D | LUAD | 1 |
| p.L1162F | UCEC | 1 |
| p.K428N | READ | 1 |
| p.L118F | LIHC | 1 |
| p.S373N | PAAD | 1 |
| p.I825V | LIHC | 1 |
| p.S53F | SKCM | 1 |
| Top |
| TissGeneCNV for SGOL2 |
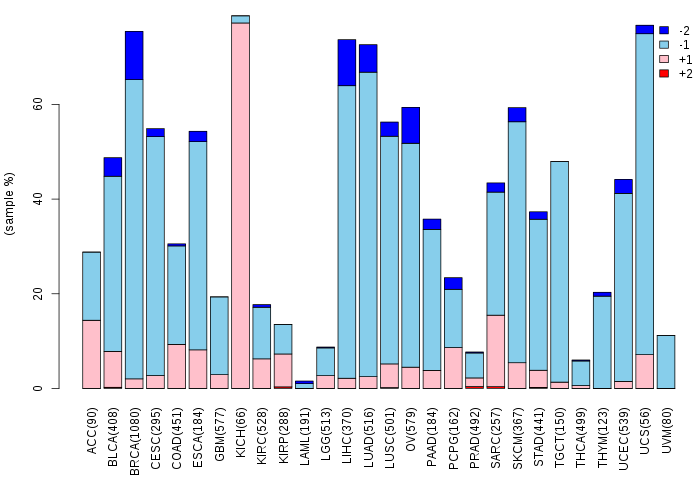
| Copy number variations of TissGene across 28 cancer types (X-axis: cancer type and Y-axis: % of CNV samples) (TCGA Gistic2_CopyNumber_Gistic2_all_data_by_genes, Gistic2 copy number data, version 2016-08-16) |
 |
| Top |
| TissGeneFusions for SGOL2 |
| Fusion genes including TissGene (ChimerDB 3.0, 2016-12-01 and TCGA fusion Portal 2015-12-01) |
| Database | Src | Cancer type | Sample | Fusion gene | ORF | 5'-gene BP | 3'-gene BP |
| Chimerdb3.0 | ChiTaRs | NA | AW182466 | SGOL2-SAAL1 | chr2:201406311 | chr11:18101900 |
| Top |
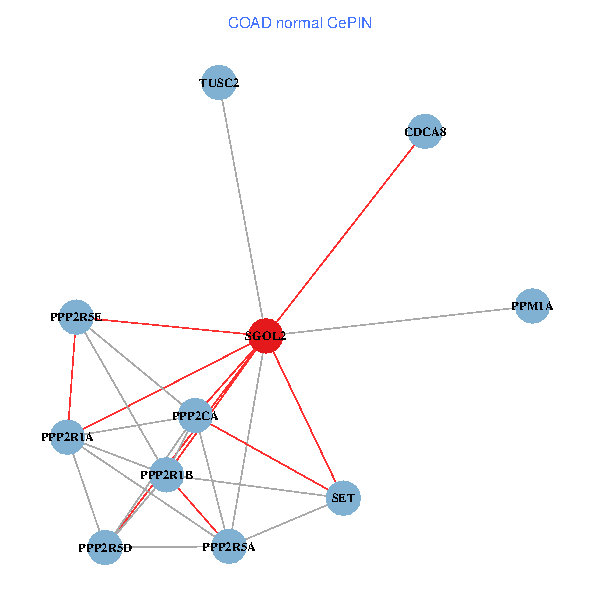
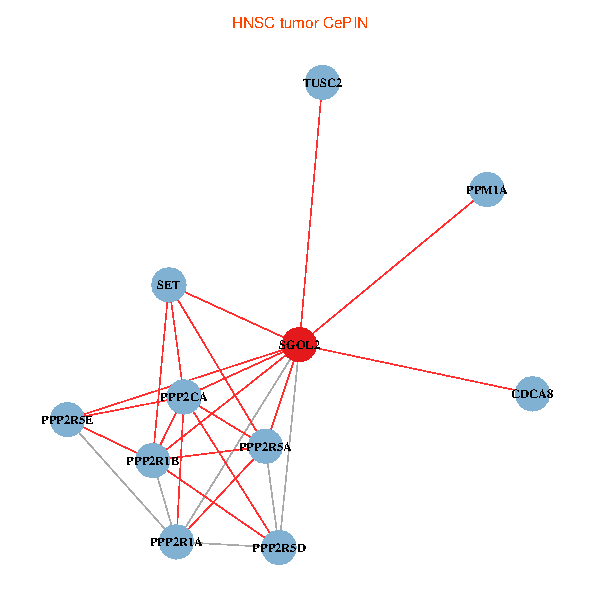
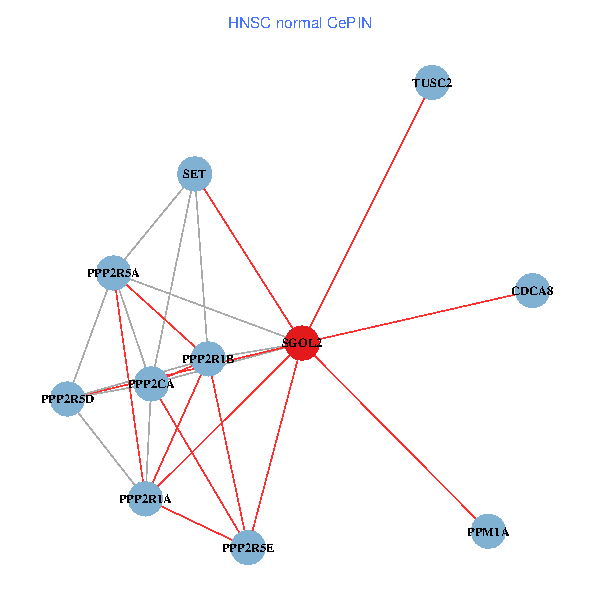
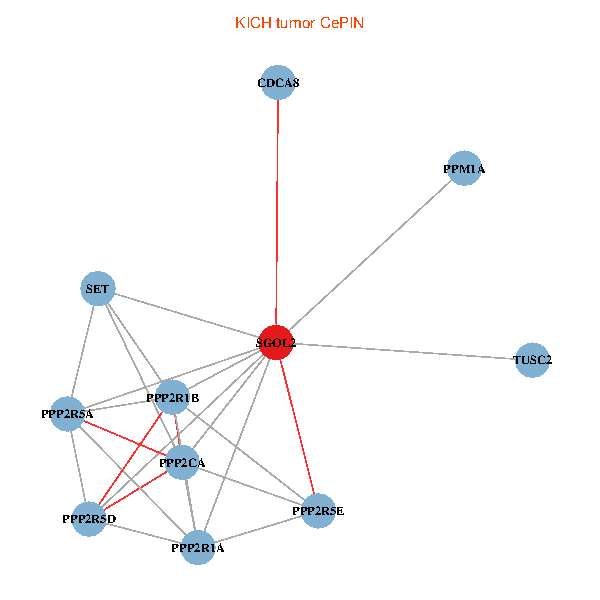
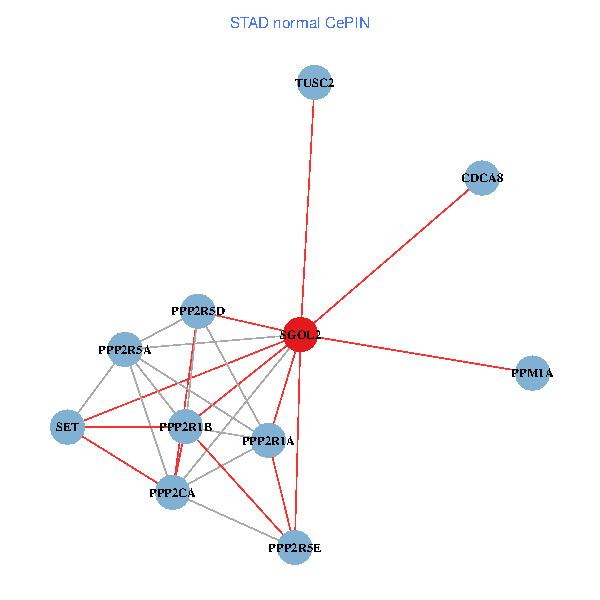
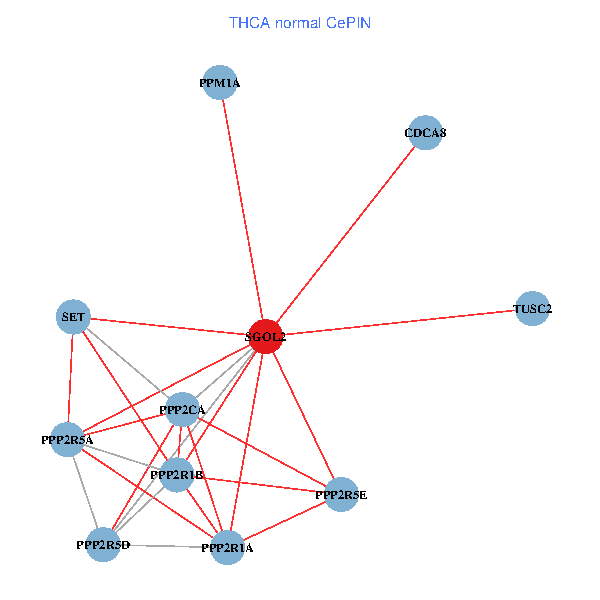
| TissGeneNet for SGOL2 |
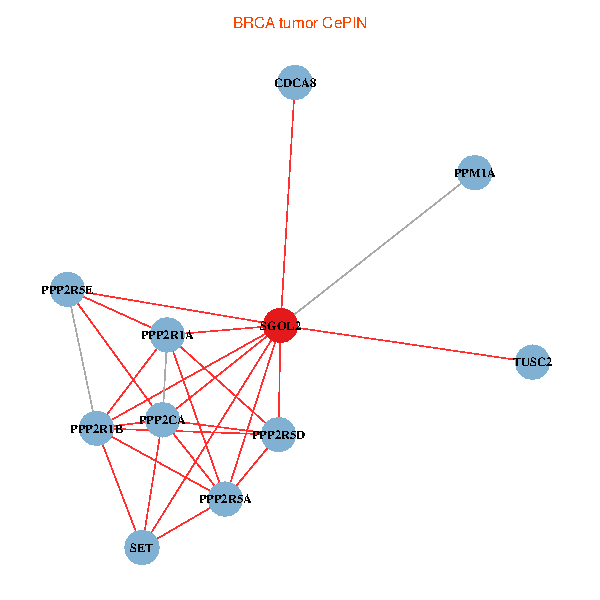
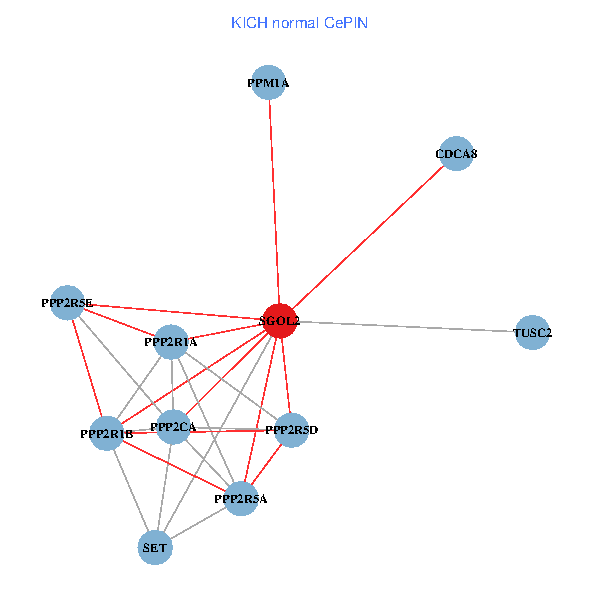
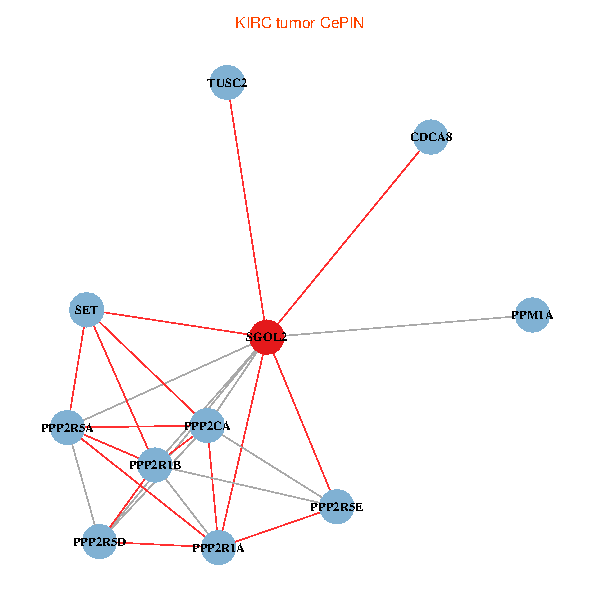
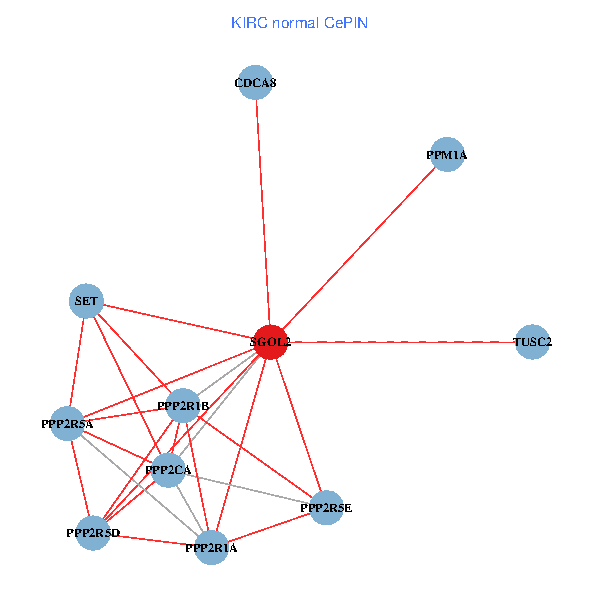
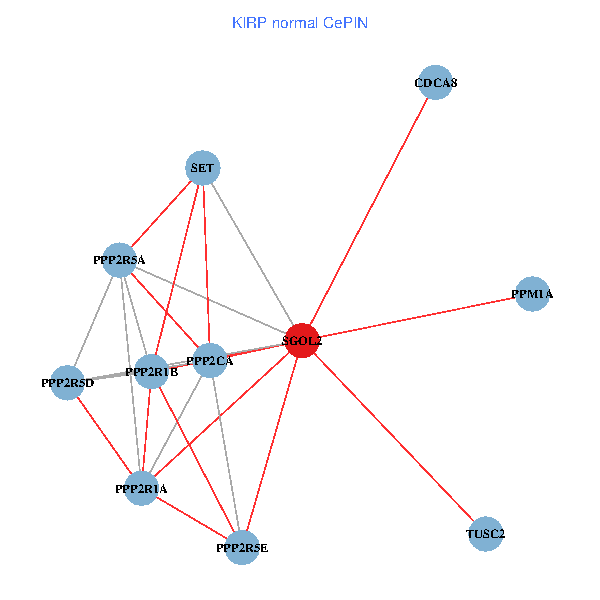
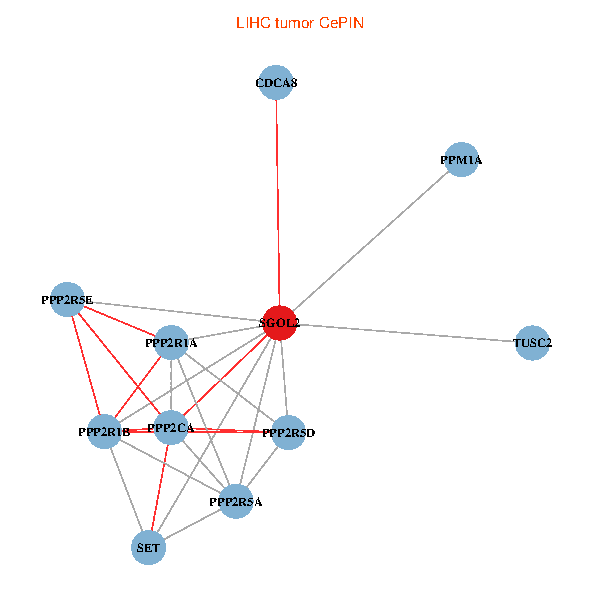
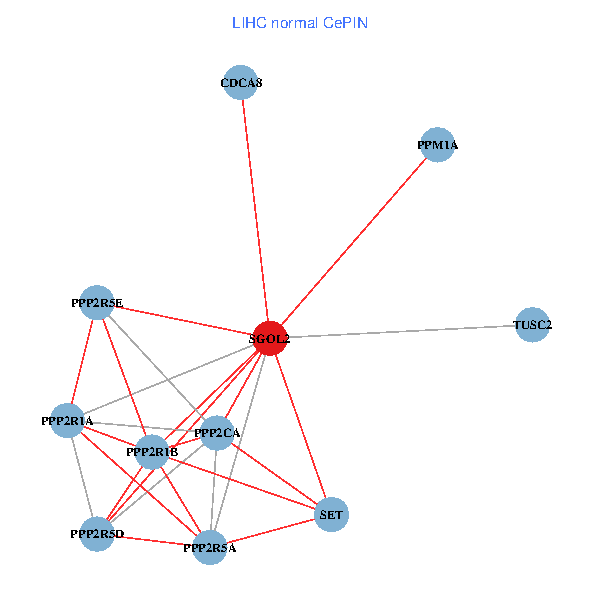
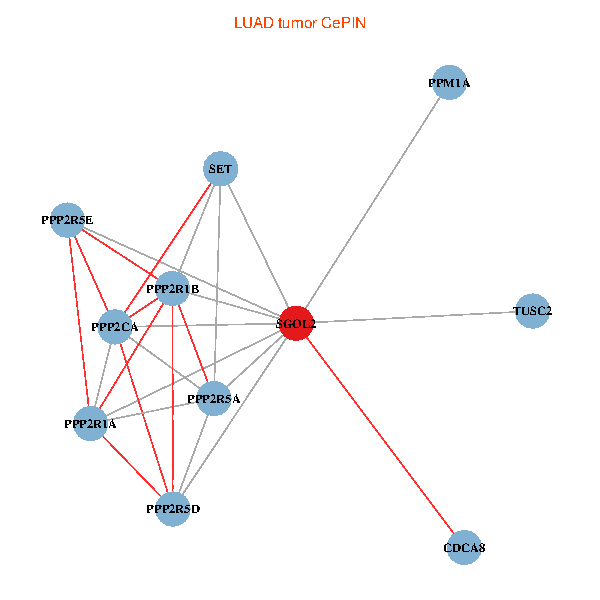
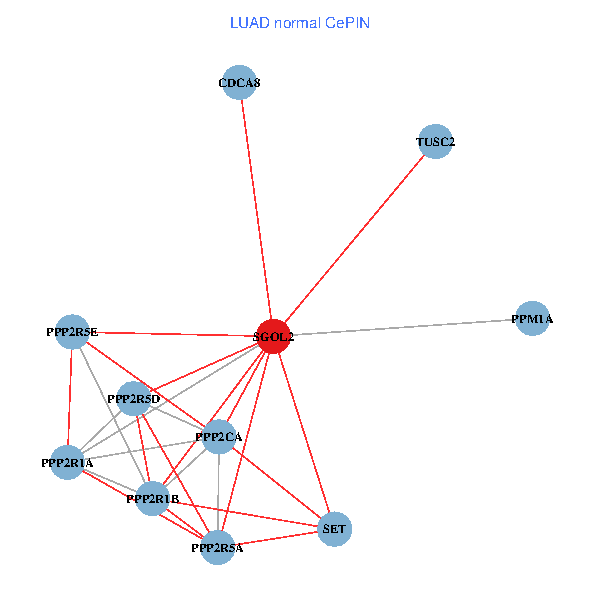
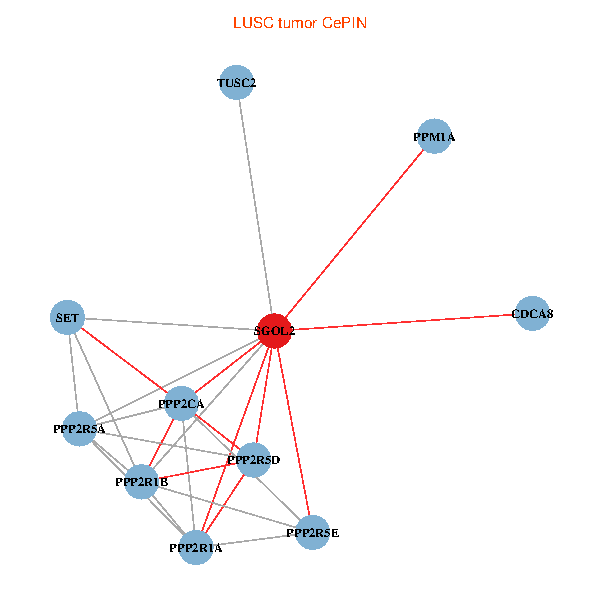
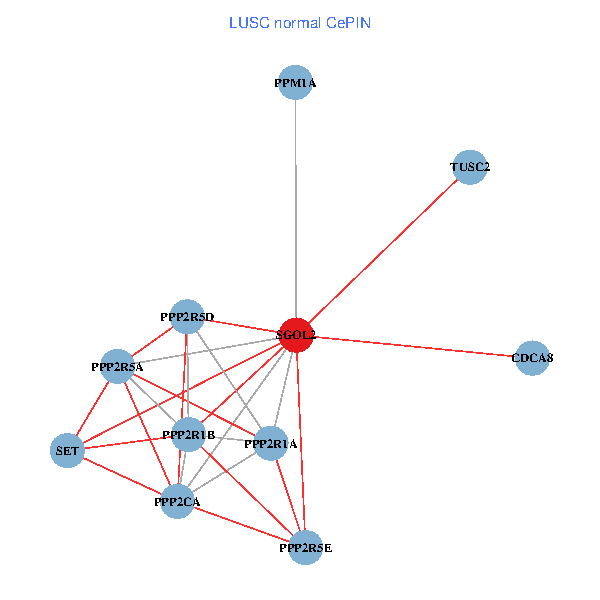
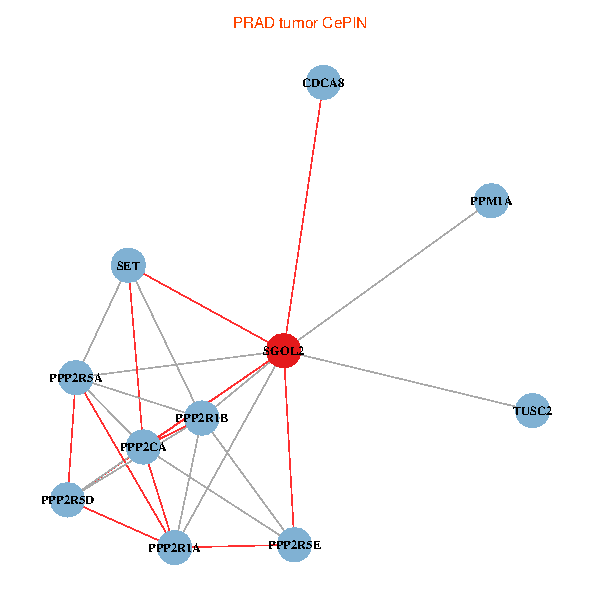
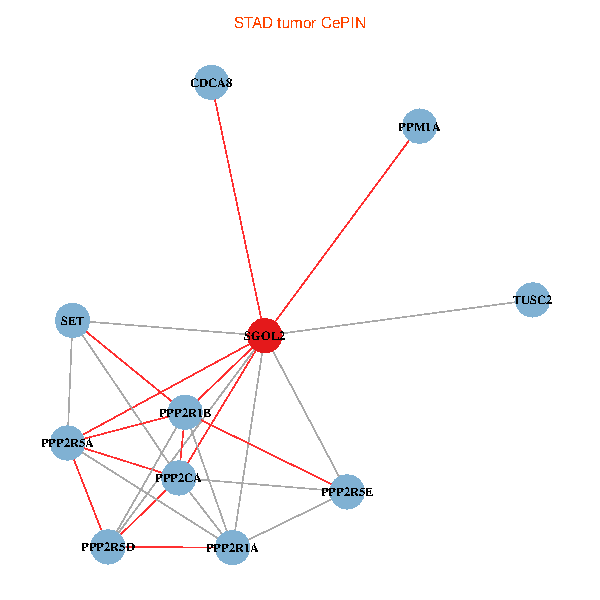
| Co-expressed gene networks based on protein-protein interaction data (CePIN) (TCGA IlluminaHiSeq_RNASeqV2, pan-cancer normalized log2(norm_counts+1) data, version 2016-08-16) (PINA2 ppi data) |
| BRCA (tumor) | BRCA (normal) |
| SGOL2, PPP2CA, PPP2R5A, PPP2R1A, SET, CDCA8, PPP2R1B, PPM1A, PPP2R5D, PPP2R5E, TUSC2 (tumor) | SGOL2, PPP2CA, PPP2R5A, PPP2R1A, SET, CDCA8, PPP2R1B, PPM1A, PPP2R5D, PPP2R5E, TUSC2 (normal) |
 |  |
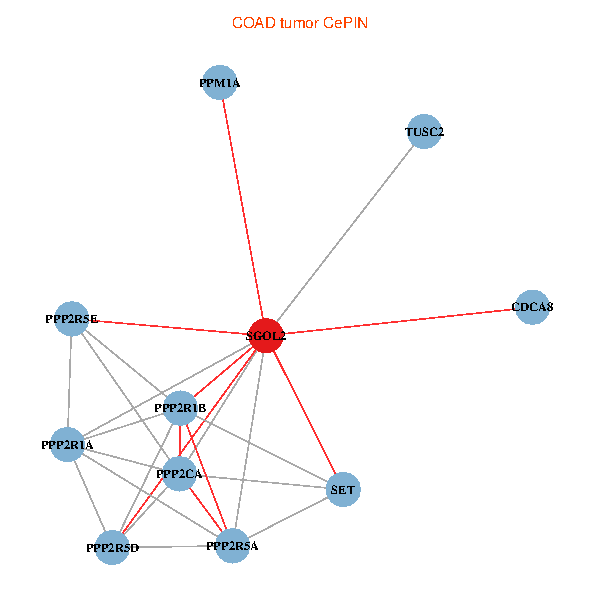
| COAD (tumor) | COAD (normal) |
| SGOL2, PPP2CA, PPP2R5A, PPP2R1A, SET, CDCA8, PPP2R1B, PPM1A, PPP2R5D, PPP2R5E, TUSC2 (tumor) | SGOL2, PPP2CA, PPP2R5A, PPP2R1A, SET, CDCA8, PPP2R1B, PPM1A, PPP2R5D, PPP2R5E, TUSC2 (normal) |
 |  |
| HNSC (tumor) | HNSC (normal) |
| SGOL2, PPP2CA, PPP2R5A, PPP2R1A, SET, CDCA8, PPP2R1B, PPM1A, PPP2R5D, PPP2R5E, TUSC2 (tumor) | SGOL2, PPP2CA, PPP2R5A, PPP2R1A, SET, CDCA8, PPP2R1B, PPM1A, PPP2R5D, PPP2R5E, TUSC2 (normal) |
 |  |
| KICH (tumor) | KICH (normal) |
| SGOL2, PPP2CA, PPP2R5A, PPP2R1A, SET, CDCA8, PPP2R1B, PPM1A, PPP2R5D, PPP2R5E, TUSC2 (tumor) | SGOL2, PPP2CA, PPP2R5A, PPP2R1A, SET, CDCA8, PPP2R1B, PPM1A, PPP2R5D, PPP2R5E, TUSC2 (normal) |
 |  |
| KIRC (tumor) | KIRC (normal) |
| SGOL2, PPP2CA, PPP2R5A, PPP2R1A, SET, CDCA8, PPP2R1B, PPM1A, PPP2R5D, PPP2R5E, TUSC2 (tumor) | SGOL2, PPP2CA, PPP2R5A, PPP2R1A, SET, CDCA8, PPP2R1B, PPM1A, PPP2R5D, PPP2R5E, TUSC2 (normal) |
 |  |
| KIRP (tumor) | KIRP (normal) |
| SGOL2, PPP2CA, PPP2R5A, PPP2R1A, SET, CDCA8, PPP2R1B, PPM1A, PPP2R5D, PPP2R5E, TUSC2 (tumor) | SGOL2, PPP2CA, PPP2R5A, PPP2R1A, SET, CDCA8, PPP2R1B, PPM1A, PPP2R5D, PPP2R5E, TUSC2 (normal) |
 |  |
| LIHC (tumor) | LIHC (normal) |
| SGOL2, PPP2CA, PPP2R5A, PPP2R1A, SET, CDCA8, PPP2R1B, PPM1A, PPP2R5D, PPP2R5E, TUSC2 (tumor) | SGOL2, PPP2CA, PPP2R5A, PPP2R1A, SET, CDCA8, PPP2R1B, PPM1A, PPP2R5D, PPP2R5E, TUSC2 (normal) |
 |  |
| LUAD (tumor) | LUAD (normal) |
| SGOL2, PPP2CA, PPP2R5A, PPP2R1A, SET, CDCA8, PPP2R1B, PPM1A, PPP2R5D, PPP2R5E, TUSC2 (tumor) | SGOL2, PPP2CA, PPP2R5A, PPP2R1A, SET, CDCA8, PPP2R1B, PPM1A, PPP2R5D, PPP2R5E, TUSC2 (normal) |
 |  |
| LUSC (tumor) | LUSC (normal) |
| SGOL2, PPP2CA, PPP2R5A, PPP2R1A, SET, CDCA8, PPP2R1B, PPM1A, PPP2R5D, PPP2R5E, TUSC2 (tumor) | SGOL2, PPP2CA, PPP2R5A, PPP2R1A, SET, CDCA8, PPP2R1B, PPM1A, PPP2R5D, PPP2R5E, TUSC2 (normal) |
 |  |
| PRAD (tumor) | PRAD (normal) |
| SGOL2, PPP2CA, PPP2R5A, PPP2R1A, SET, CDCA8, PPP2R1B, PPM1A, PPP2R5D, PPP2R5E, TUSC2 (tumor) | SGOL2, PPP2CA, PPP2R5A, PPP2R1A, SET, CDCA8, PPP2R1B, PPM1A, PPP2R5D, PPP2R5E, TUSC2 (normal) |
 |  |
| STAD (tumor) | STAD (normal) |
| SGOL2, PPP2CA, PPP2R5A, PPP2R1A, SET, CDCA8, PPP2R1B, PPM1A, PPP2R5D, PPP2R5E, TUSC2 (tumor) | SGOL2, PPP2CA, PPP2R5A, PPP2R1A, SET, CDCA8, PPP2R1B, PPM1A, PPP2R5D, PPP2R5E, TUSC2 (normal) |
 |  |
| THCA (tumor) | THCA (normal) |
| SGOL2, PPP2CA, PPP2R5A, PPP2R1A, SET, CDCA8, PPP2R1B, PPM1A, PPP2R5D, PPP2R5E, TUSC2 (tumor) | SGOL2, PPP2CA, PPP2R5A, PPP2R1A, SET, CDCA8, PPP2R1B, PPM1A, PPP2R5D, PPP2R5E, TUSC2 (normal) |
 |  |
| Top |
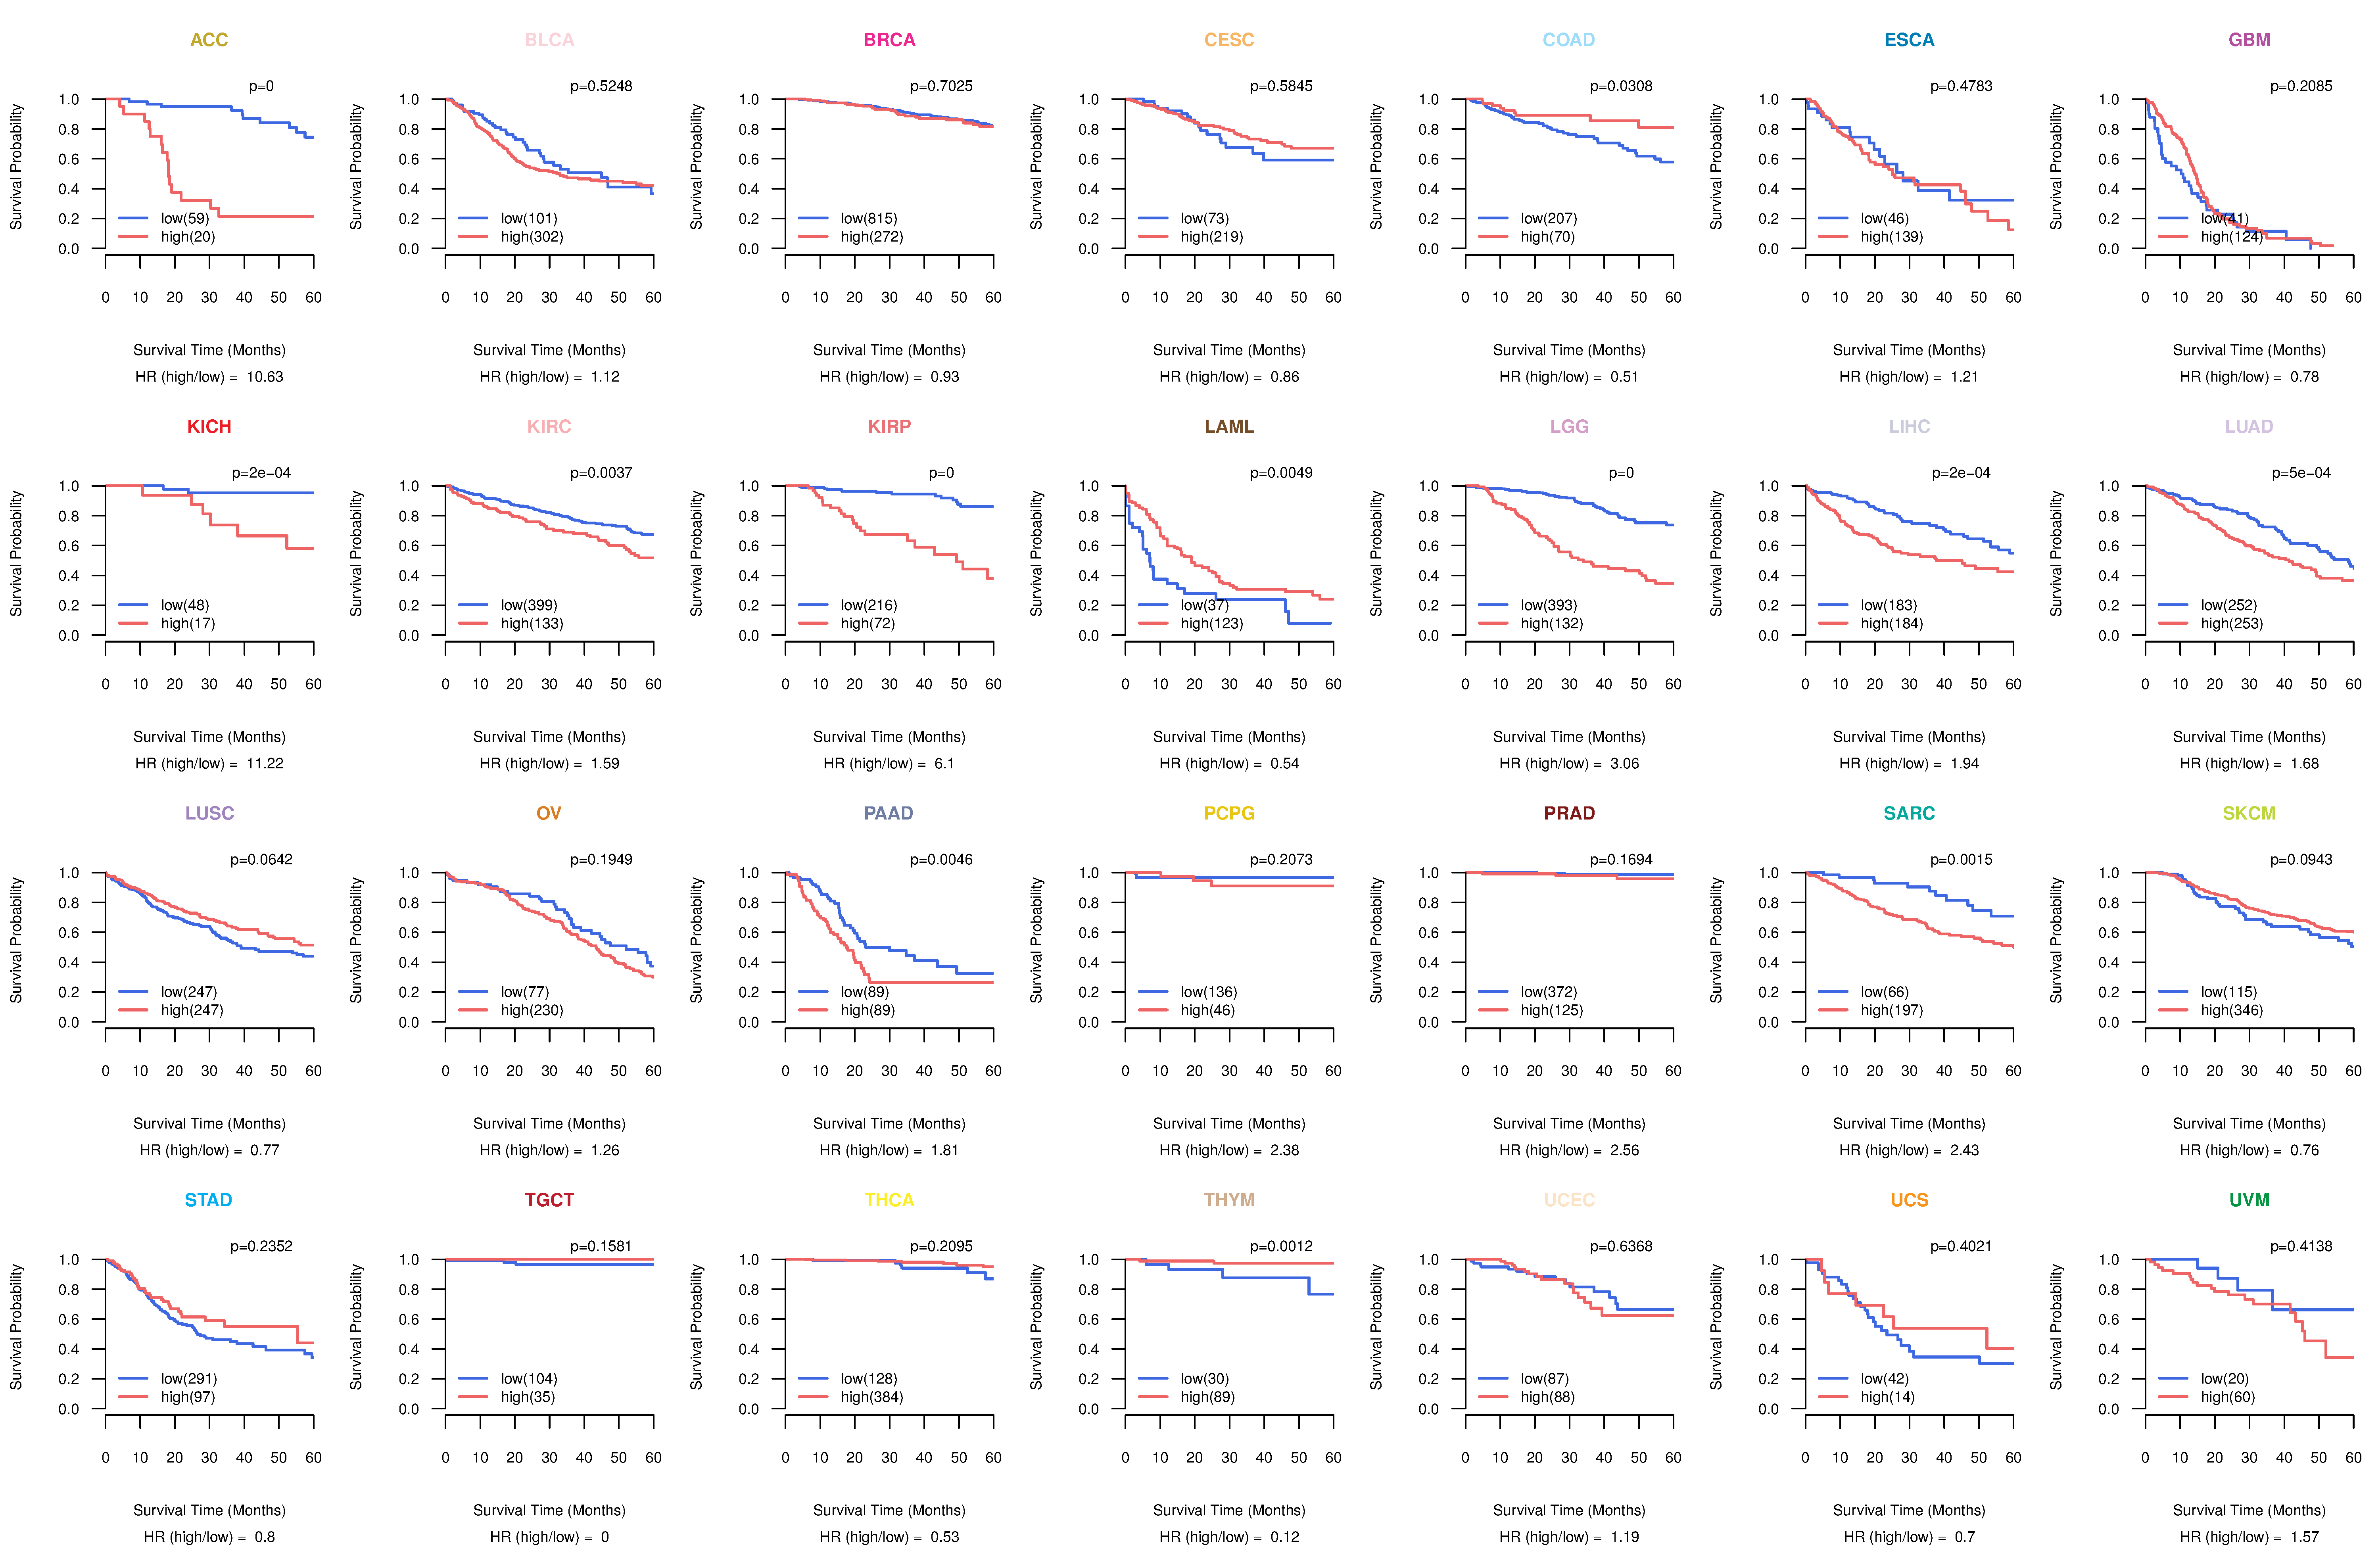
| TissGeneProg for SGOL2 |
| Kaplan-Meier plots with logrank tests of overall survival (OS) using 28 cancer types (TCGA IlluminaHiSeq_RNASeqV2, pan-cancer normalized log2(norm_counts+1) data, version 2016-08-16) (TCGA clinicalMatrix, phenotype data, version 2016-04-27) * Click on the image to enlarge it in a new window. |
 |
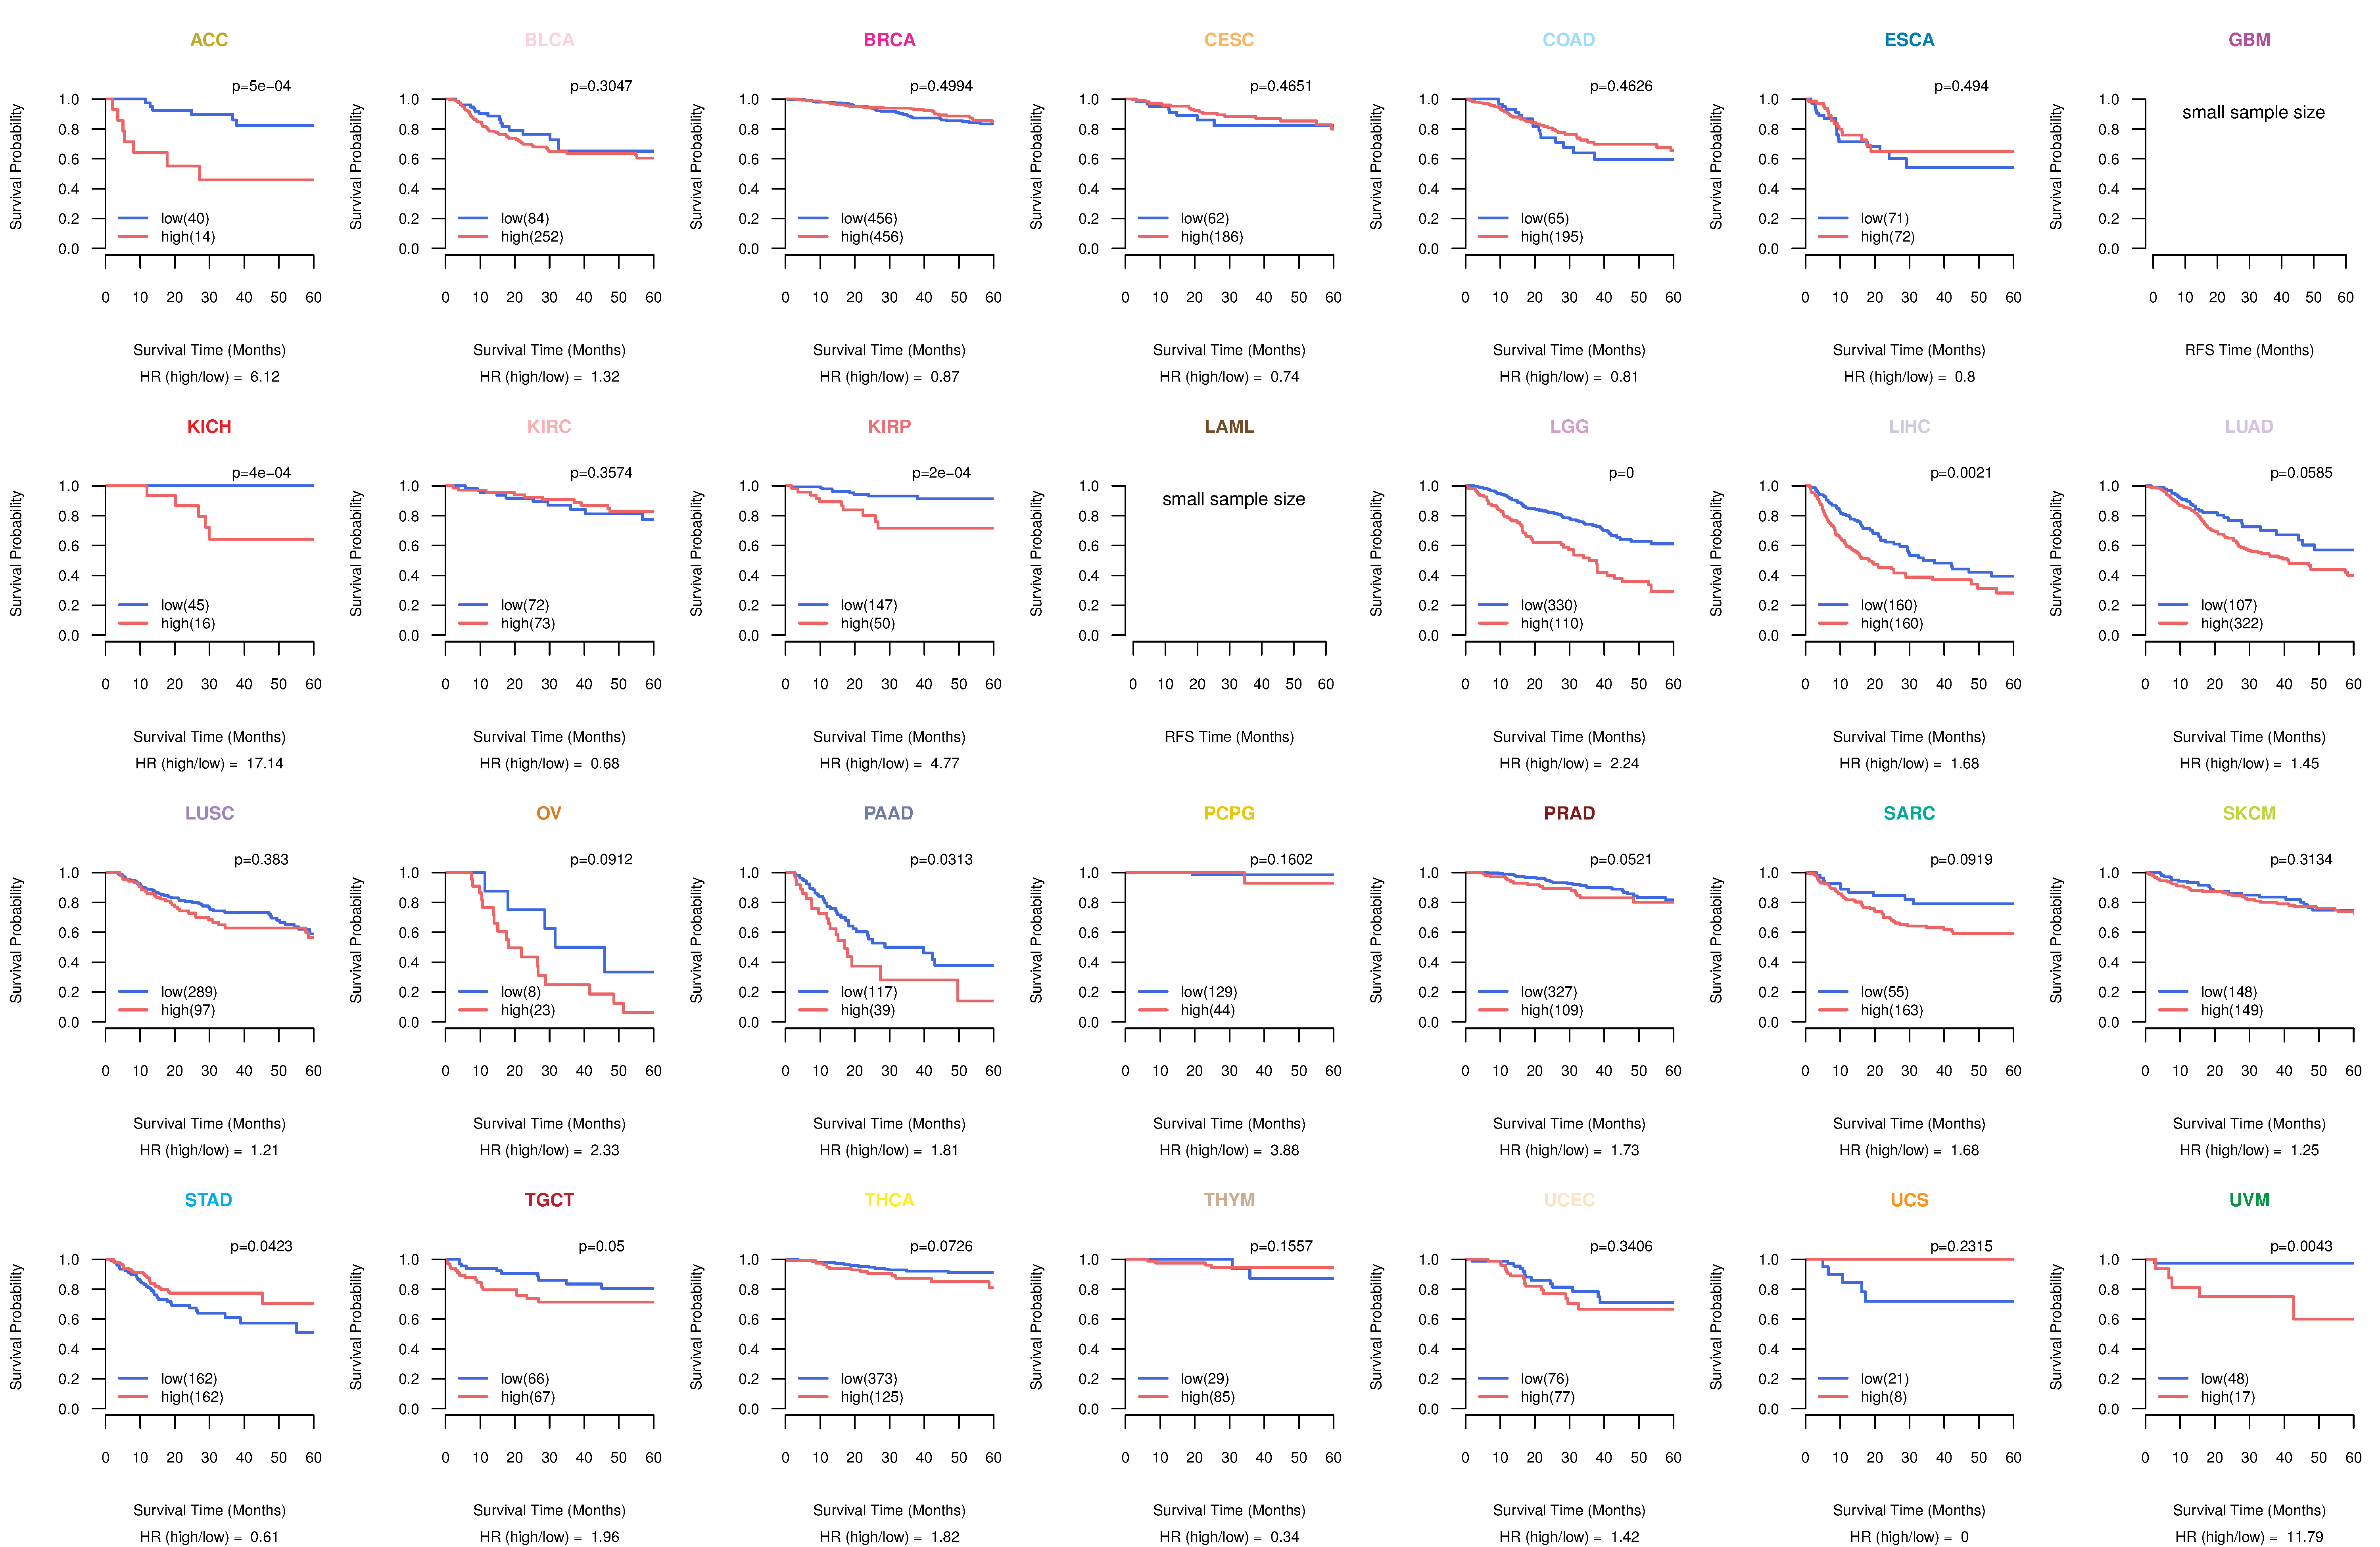
| Kaplan-Meier plots with logrank test of relapse free survival (RFS) using 28 cancer types (TCGA IlluminaHiSeq_RNASeqV2, pan-cancer normalized log2(norm_counts+1) data, version 2016-08-16) (TCGA clinicalMatrix, phenotype data, version 2016-04-27) * Click on the image enlarge it in a new window. |
 |
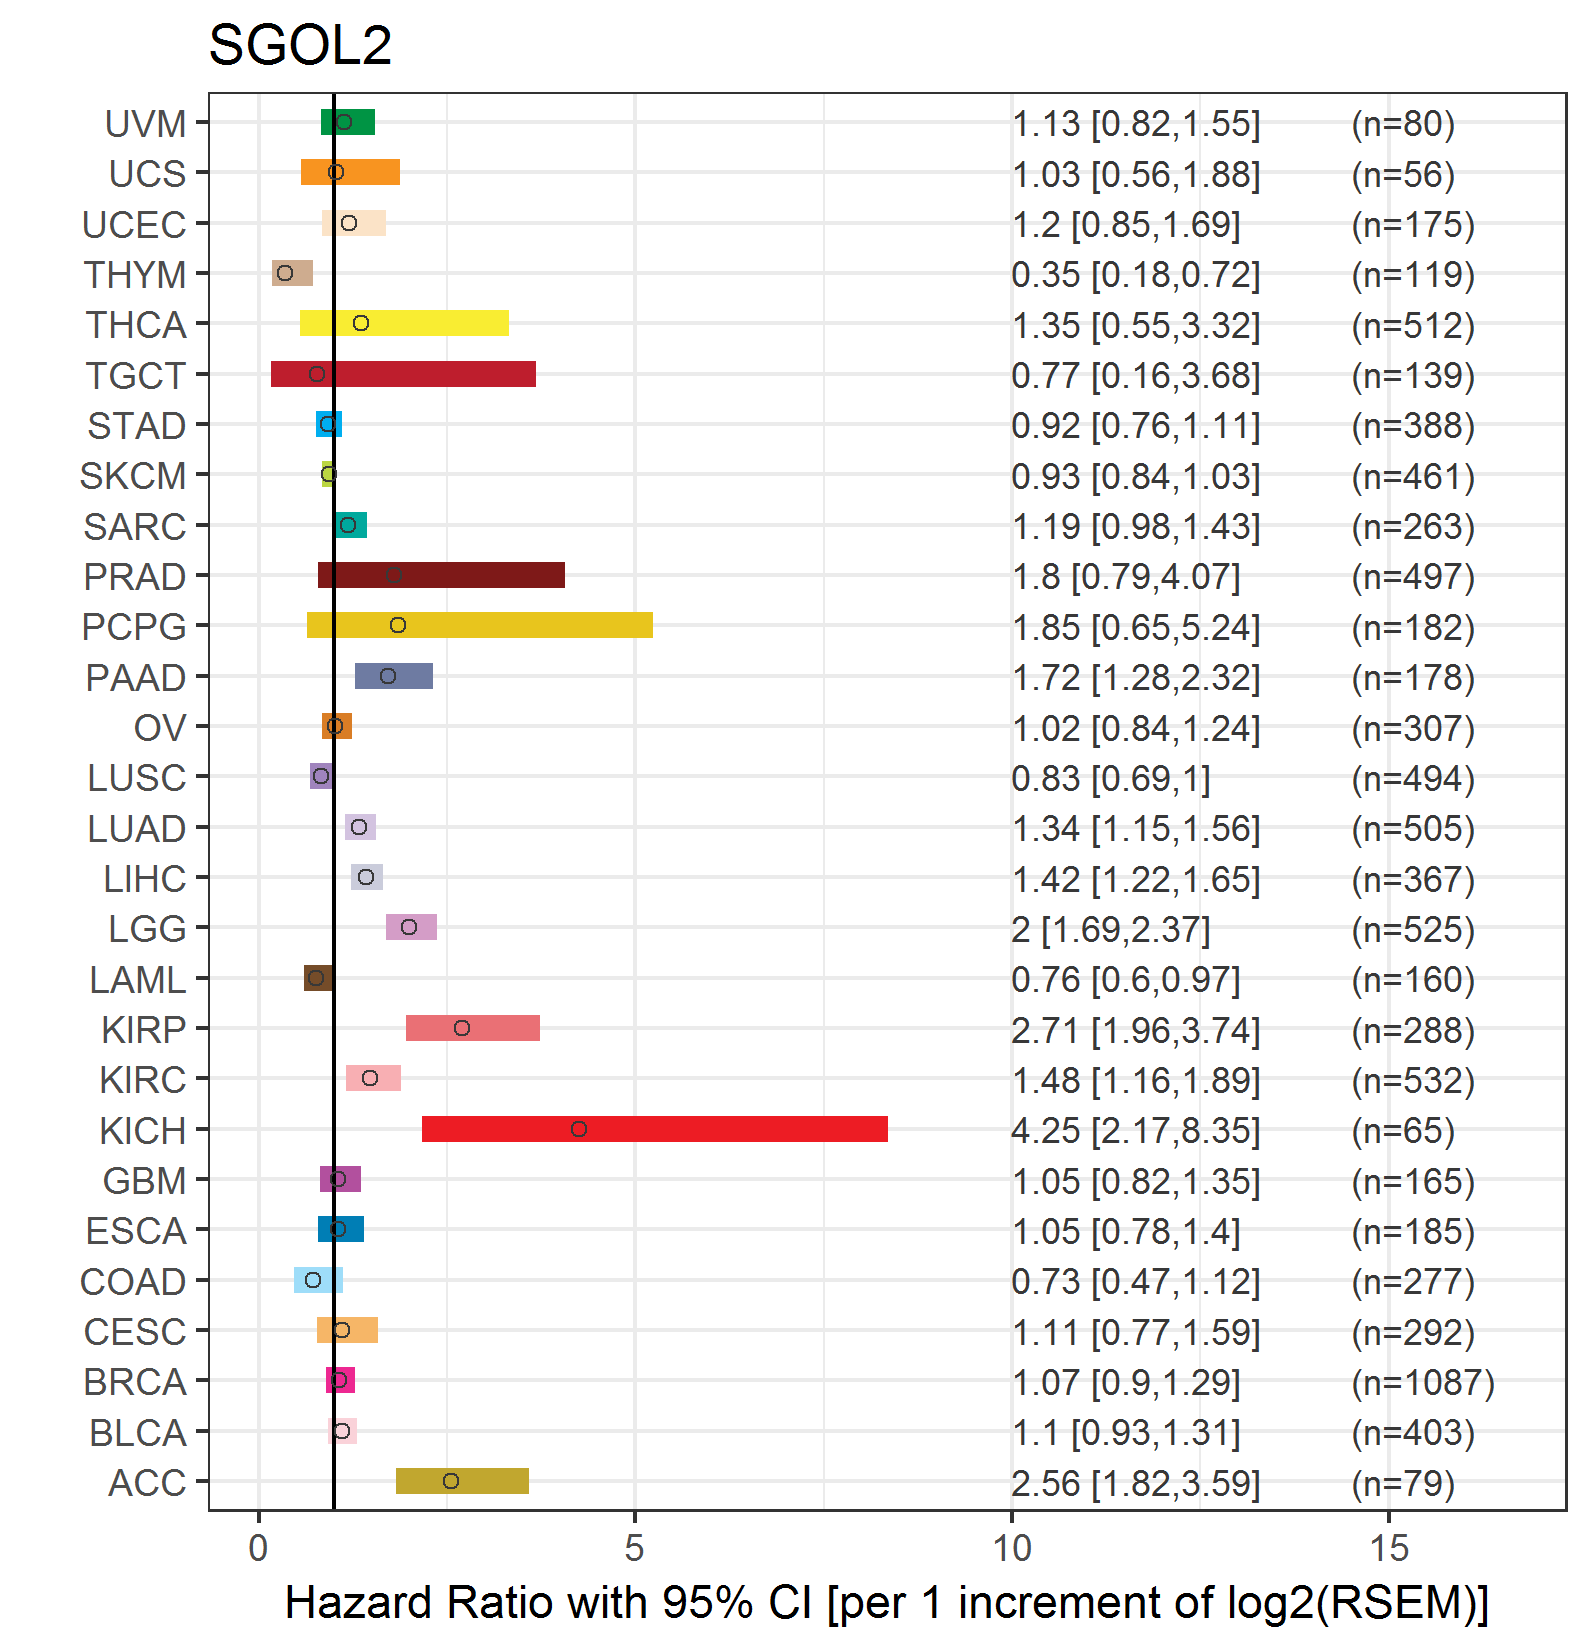
| Forest plot of Cox proportional hazard ratio (HR) and 95% CI of overall survival (OS) using 28 cancer types (TCGA IlluminaHiSeq_RNASeqV2, pan-cancer normalized log2(norm_counts+1) data, version 2016-08-16) (TCGA clinicalMatrix, phenotype data, version 2016-04-27) * Click on the image enlarge it in a new window. |
 |
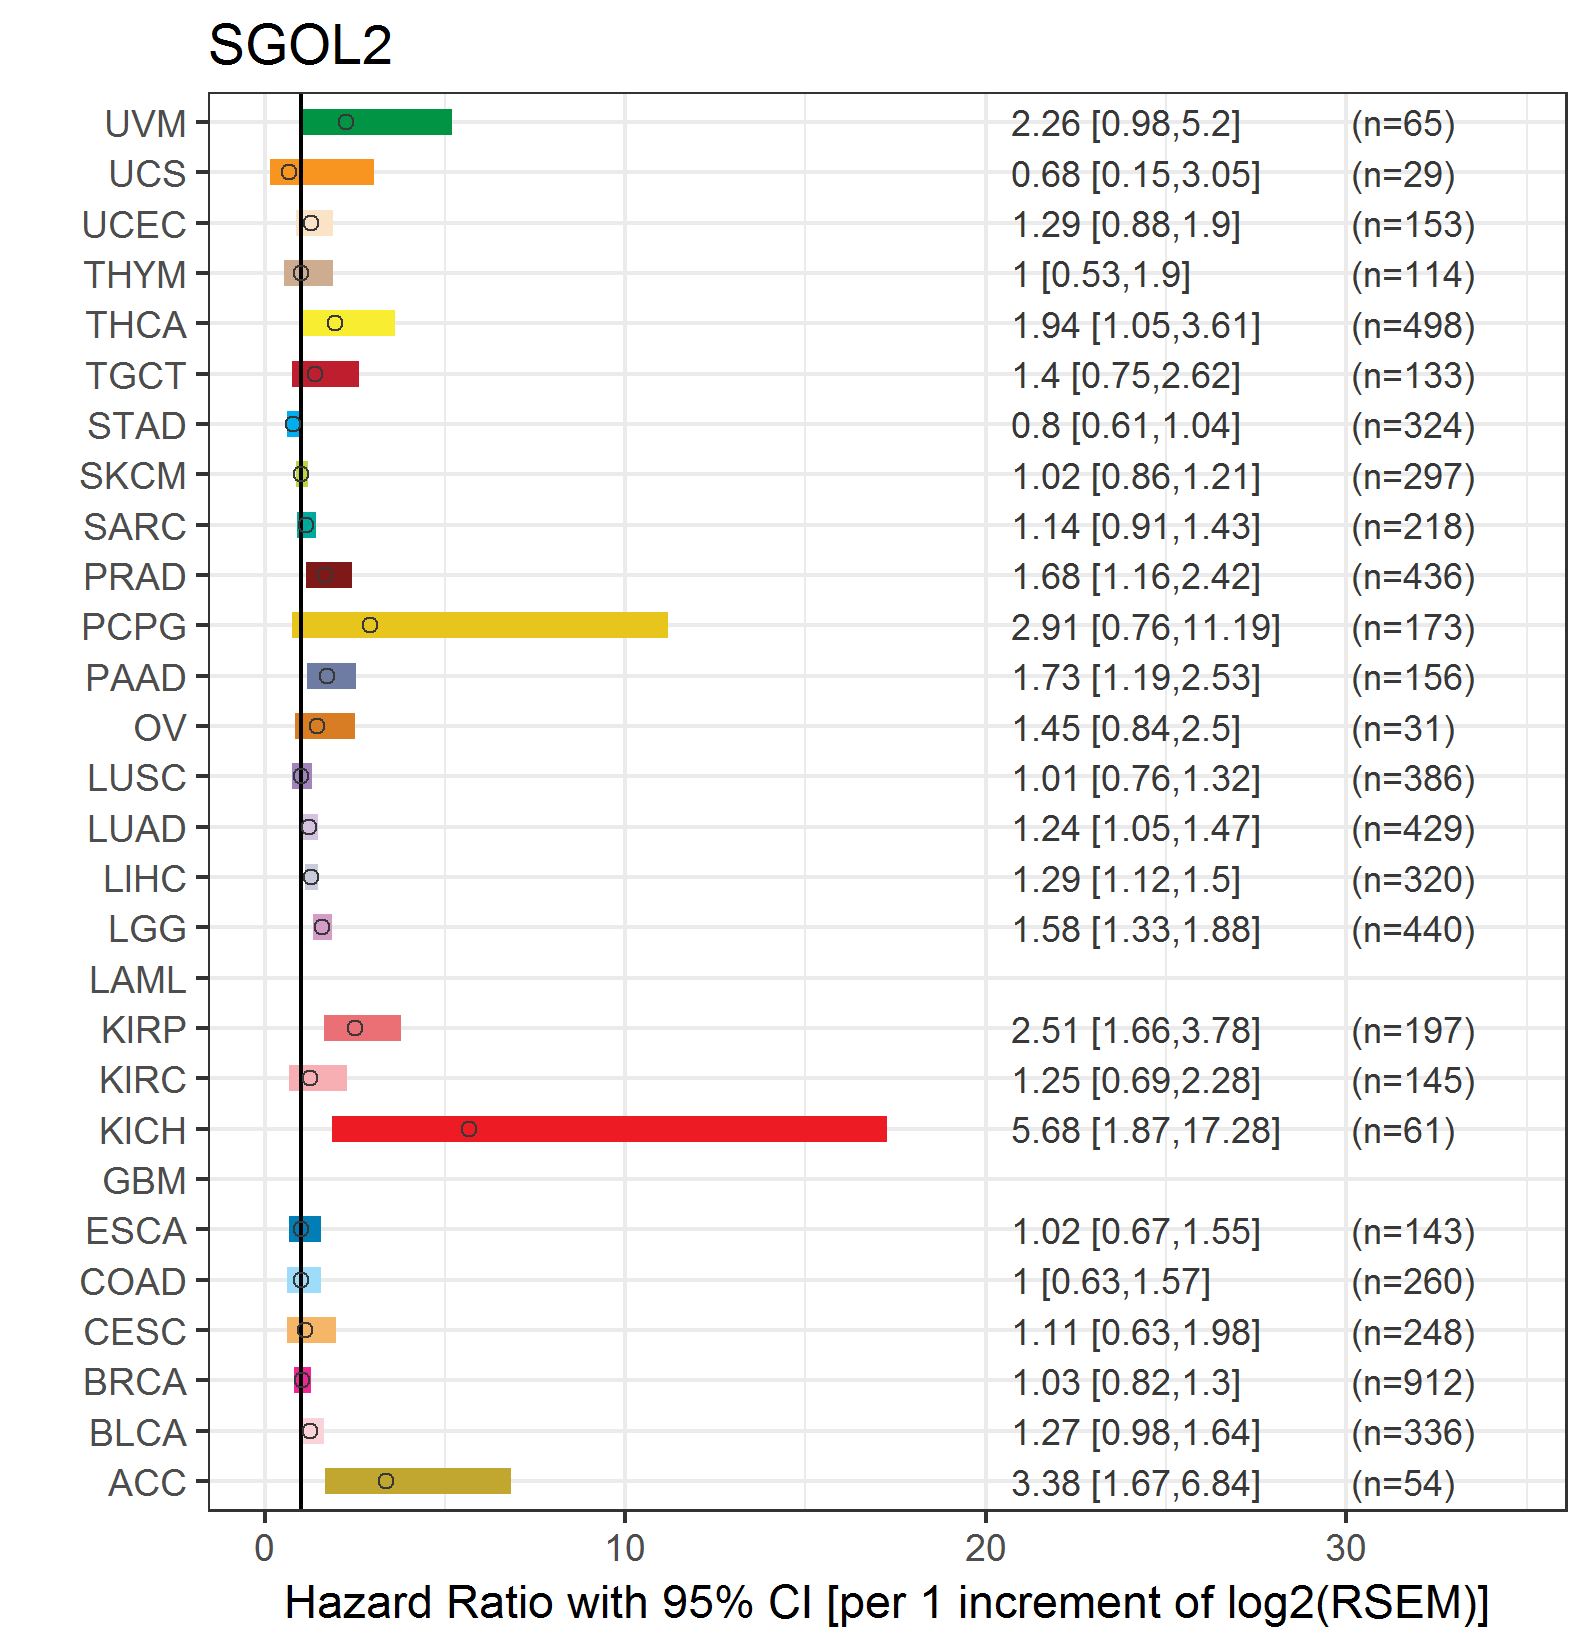
| Forest plot of Cox proportional hazard ratio (HR) and 95% CI of relapse free survival (RFS) using 28 cancer types (TCGA IlluminaHiSeq_RNASeqV2, pan-cancer normalized log2(norm_counts+1) data, version 2016-08-16) (TCGA clinicalMatrix, phenotype data, version 2016-04-27) * Click on the image enlarge it in a new window. |
 |
| Top |
| TissGeneClin for SGOL2 |
| TissGeneDrug for SGOL2 |
| Drug information targeting TissGene (DrugBank Version 5.0.6, 2017-04-01) |
| DrugBank ID | Drug name | Drug activity | Drug type | Drug status |
| Top |
| TissGeneDisease for SGOL2 |
| Disease information associated with TissGene (DisGeNet, 2016-06-01) |
| Disease ID | Disease name | # pubmeds | Source |
| umls:C0011053 | Deafness | 1 | GAD |
| umls:C0018772 | Hearing Loss, Partial | 1 | GAD |
| umls:C1384666 | hearing impairment | 1 | GAD |
| umls:C3887873 | Hearing Loss | 1 | GAD |
|
Copyright 2016-Present - The University of Texas Health Science Center at Houston (UTHealth) Web File Viewing | How to Report, Fraud, Waste and Abuse | State of Texas | Statewide Search | Texas Homeland Security | Site Policies |