 |
| |
| |
| |
| |
| |
| |
|

| TissGeneSummary for ASPRV1 |
 Gene summary Gene summary |
| Basic gene information | Gene symbol | ASPRV1 |
| Gene name | aspartic peptidase, retroviral-like 1 | |
| Synonyms | MUNO|SASP|SASPase|Taps | |
| Cytomap | UCSC genome browser: 2p13.3 | |
| Type of gene | protein-coding | |
| RefGenes | NM_152792.2, | |
| Description | TPA-inducible aspartic proteinase-like proteinretroviral-like aspartic protease 1skin aspartic proteaseskin-specific retroviral-like aspartic protease | |
| Modification date | 20141215 | |
| dbXrefs | MIM : 611765 | |
| HGNC : HGNC | ||
| Ensembl : ENSG00000244617 | ||
| HPRD : 08683 | ||
| Vega : OTTHUMG00000129647 | ||
| Protein | UniProt: go to UniProt's Cross Reference DB Table | |
| Expression | CleanEX: HS_ASPRV1 | |
| BioGPS: 151516 | ||
| Pathway | NCI Pathway Interaction Database: ASPRV1 | |
| KEGG: ASPRV1 | ||
| REACTOME: ASPRV1 | ||
| Pathway Commons: ASPRV1 | ||
| Context | iHOP: ASPRV1 | |
| ligand binding site mutation search in PubMed: ASPRV1 | ||
| UCL Cancer Institute: ASPRV1 | ||
| Assigned class in TissGDB* | C | |
| Included tissue-specific gene expression resources | HPA,GTEx | |
| Specific-tissues in normal samples (assigned by TissGDB using HPA, TiGER, and GTEx) | Skin | |
| Cancer types related to the specific-tissues in cancer samples (assigned by TissGDB using TCGA) | SKCM | |
| Reference showing the relevant tissue of ASPRV1 | ||
| Description by TissGene annotations | TissgsLTS | |
| * Class A consists of genes with literature evidence and is part of the cTissGenes. Class B consists of only cTissGenes without additional evidence. The remaining genes belong to Class C. |
| Gene ontology having evidence of Inferred from Direct Assay (IDA) from Entrez |
| GO ID | GO term | PubMed ID | GO:0016485 | protein processing | 16098038 | GO:0016485 | protein processing | 16098038 |
| Top |
| TissGeneExp for ASPRV1 |
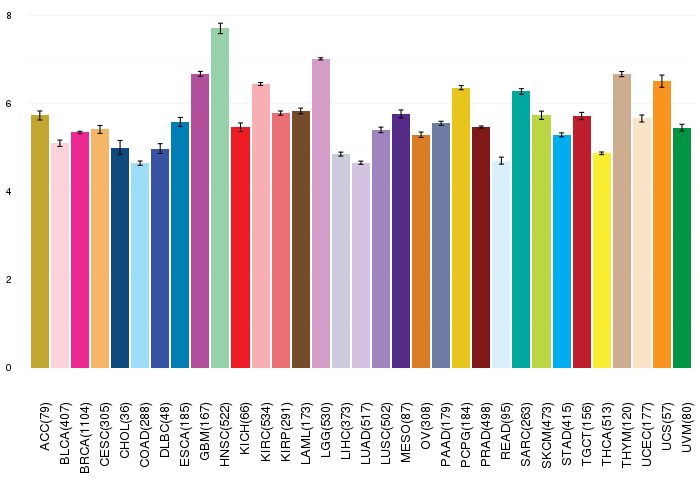
| Gene expressions across 28 cancer types (X-axis: cancer type and Y-axis: log2(norm_counts+1)) (TCGA IlluminaHiSeq_RNASeqV2, pan-cancer normalized log2(norm_counts+1) data, version 2016-08-16) |
 |
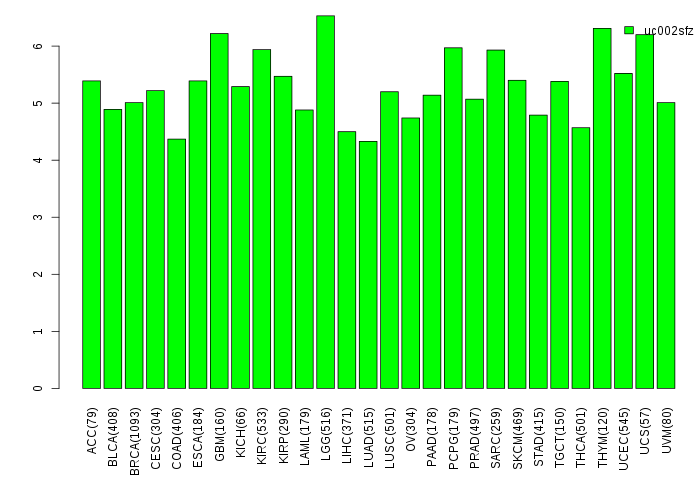
| Gene isoform expressions across 28 cancer types (X-axis: cancer type and Y-axis: log2(norm_counts+1)) (TCGA pan-cancer tcga_rsem_isoform_tpm, version 2016-09-01) |
 |
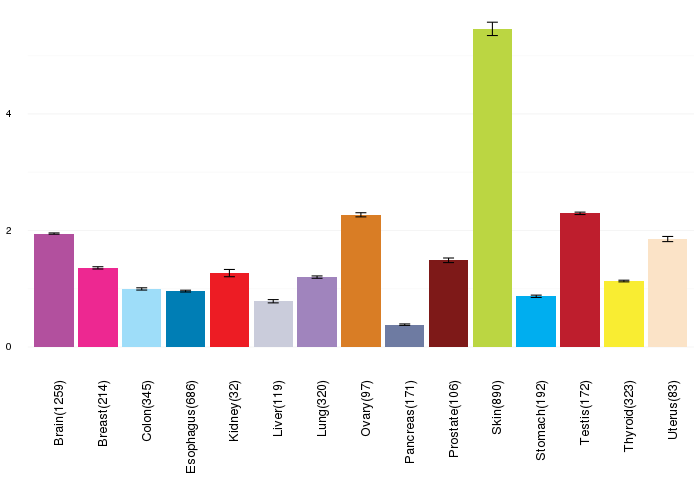
| Gene expressions across normal tissues of GTEx data (GTEx GTEx_Analysis_v6_RNA-seq_RNA-SeQCv1.1.8_gene_rpkm.gct) - Here, we shows the matched tissue types only among our 28 cancer types. |
 |
| Different expressions across 14 cancer types with more than 10 samples between matched tumors and normals (X-axis: cancer type and Y-axis: log2(norm_counts+1)) (TCGA IlluminaHiSeq_RNASeqV2, pan-cancer normalized log2(norm_counts+1) data, version 2016-08-16) |
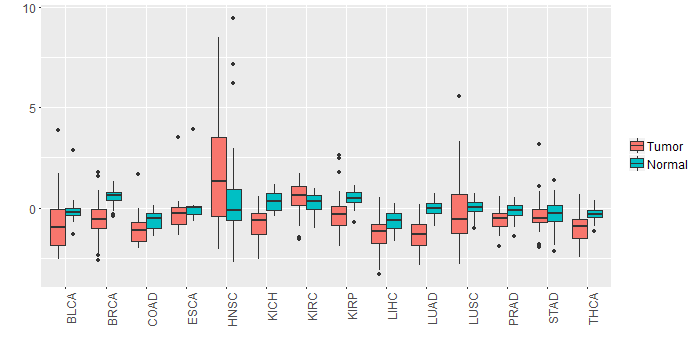 |
| - Significantly differentially expressed cancer types and information. (|Fold change|>1 and FDR<0.05) |
| Cancer type | Mean(exp) in tumor | Mean(exp) in matched normal | Log2FC | P-val. | FDR |
| LUAD | -1.303691651 | -0.020095099 | -1.283596552 | 6.74E-18 | 9.11E-17 |
| BRCA | -0.560588112 | 0.560639081 | -1.121227193 | 5.67E-30 | 7.61E-29 |
| KICH | -0.731525375 | 0.346806625 | -1.078332 | 5.90E-07 | 2.31E-06 |
| Top |
| TissGene-miRNA for ASPRV1 |
| Significantly anti-correlated miRNAs of TissGene across 28 cancer types (Gene-miRNA relations from TargetScanHuman Relsease 7.1, Conserved_Site_Context_Scores.txt.zip, 06.01.2016) (TCGA IlluminaHiSeq_miRNASeq, log2(RPM+1) data, version 2016-11-21) (TCGA IlluminaHiSeq_RNASeqV2, log2(normalized_count+1) data, version 2016-08-16) (Spearman’s Rank Correlation (p-value<0.05 and coefficient<-0.25)) |
| Cancer type | miRNA id | miRNA accession | P-val. | Coeff. | # samples |
| Top |
| TissGeneMut for ASPRV1 |
| TissGeneSNV for ASPRV1 |
| nsSNV counts per each loci. Different colors of circles represent different cancer types. Circle size denotes number of samples. (TCGA somatic mutation (SNPs and small INDELs) data, version 2016-04-25) * Click on the image to enlarge it in a new window. |
 |
| Somatic nucleotide variants of TissGene across 28 cancer types (X-axis: cancer type and Y-axis: % of mutated samples) The numbers in parentheses are numbers of samples with mutation (nsSNVs). (TCGA somatic mutation (SNPs and small INDELs) data, version 2016-04-25) |
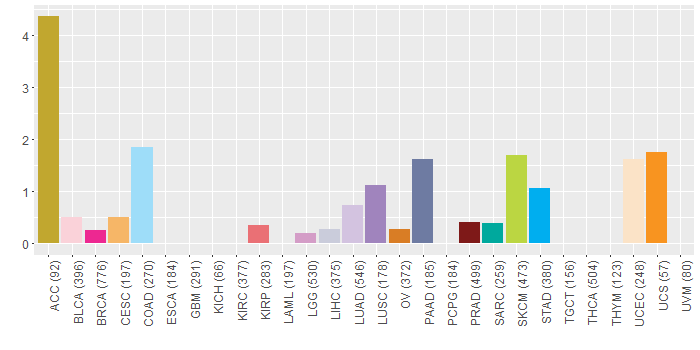 |
| - nsSNVs sorted by frequency. |
| AAchange | Cancer type | # samples |
| p.D287N | SKCM | 2 |
| p.A26G | LUAD | 1 |
| p.L65P | KIRP | 1 |
| p.S213F | BRCA | 1 |
| p.V187I | STAD | 1 |
| p.E140K | SKCM | 1 |
| p.G87R | ACC | 1 |
| p.W116* | PAAD | 1 |
| p.E104Q | BLCA | 1 |
| p.P175L | BRCA | 1 |
| p.K244N | LUAD | 1 |
| p.D232N | ACC | 1 |
| p.G5V | ACC | 1 |
| p.A171V | CHOL | 1 |
| p.P113S | SKCM | 1 |
| p.P35H | UCEC | 1 |
| p.V187I | PAAD | 1 |
| p.A277V | PRAD | 1 |
| p.G44W | LUAD | 1 |
| p.I284T | STAD | 1 |
| p.R301S | ACC | 1 |
| p.V187I | COAD | 1 |
| p.W257* | HNSC | 1 |
| p.A178S | HNSC | 1 |
| p.A178S | LUAD | 1 |
| p.R338W | UCS | 1 |
| p.D287E | PRAD | 1 |
| p.L153P | LIHC | 1 |
| p.V207M | LGG | 1 |
| p.A189S | STAD | 1 |
| p.E329K | BRCA | 1 |
| p.R301C | UCEC | 1 |
| p.K265R | SARC | 1 |
| p.T133I | SKCM | 1 |
| p.K204N | BLCA | 1 |
| p.A61V | COAD | 1 |
| p.R311C | SKCM | 1 |
| p.H118R | COAD | 1 |
| p.D230G | STAD | 1 |
| p.G195D | BLCA | 1 |
| p.E121Q | BLCA | 1 |
| p.R301H | PAAD | 1 |
| p.E145K | SKCM | 1 |
| p.G2W | UCEC | 1 |
| p.V102I | OV | 1 |
| p.S334* | LUSC | 1 |
| p.V102I | COAD | 1 |
| p.L142I | UCEC | 1 |
| p.K194N | COAD | 1 |
| p.R97W | CESC | 1 |
| p.H343Q | LUSC | 1 |
| p.H221Y | SKCM | 1 |
| Top |
| TissGeneCNV for ASPRV1 |
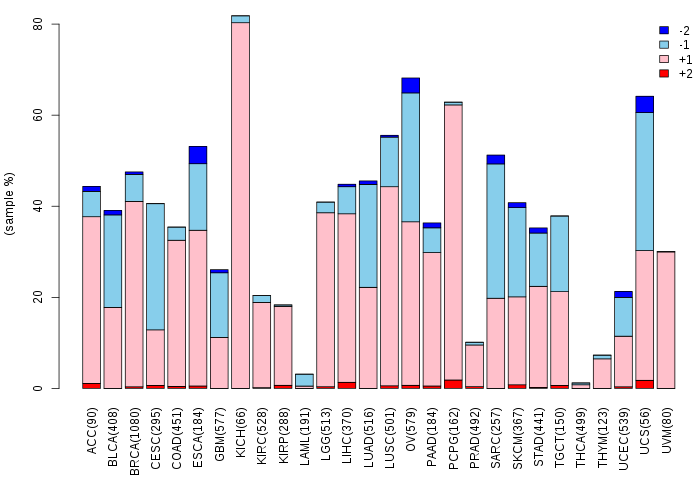
| Copy number variations of TissGene across 28 cancer types (X-axis: cancer type and Y-axis: % of CNV samples) (TCGA Gistic2_CopyNumber_Gistic2_all_data_by_genes, Gistic2 copy number data, version 2016-08-16) |
 |
| Top |
| TissGeneFusions for ASPRV1 |
| Fusion genes including TissGene (ChimerDB 3.0, 2016-12-01 and TCGA fusion Portal 2015-12-01) |
| Database | Src | Cancer type | Sample | Fusion gene | ORF | 5'-gene BP | 3'-gene BP |
| Top |
| TissGeneNet for ASPRV1 |
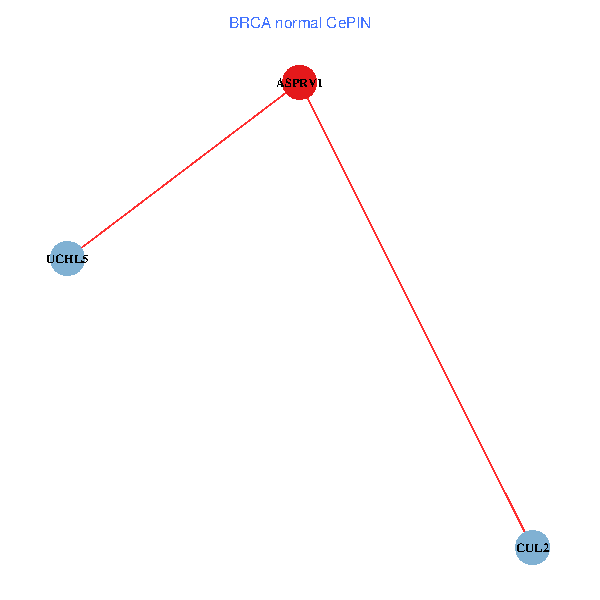
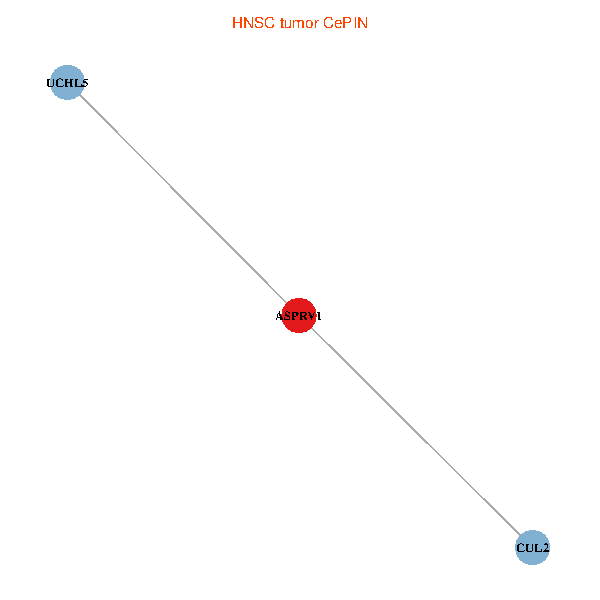
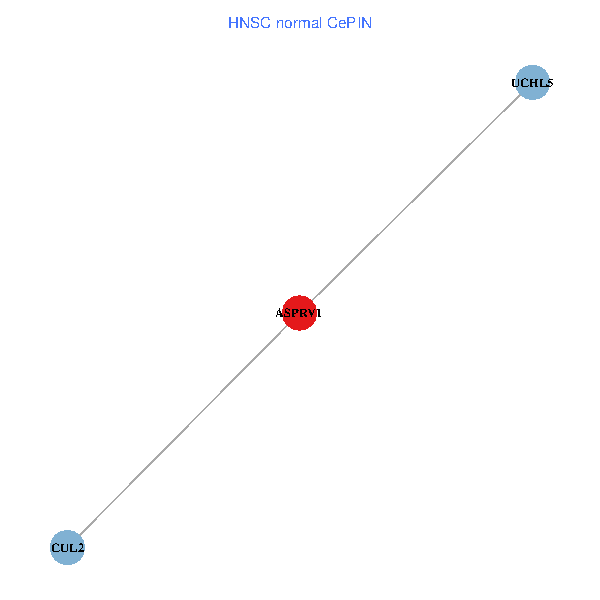
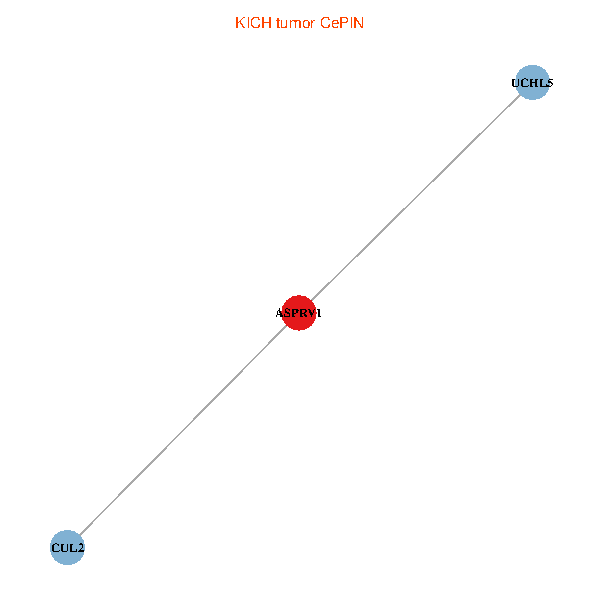
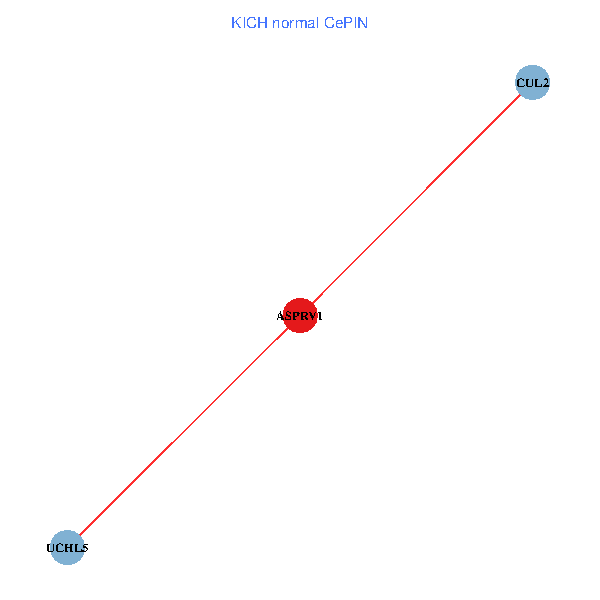
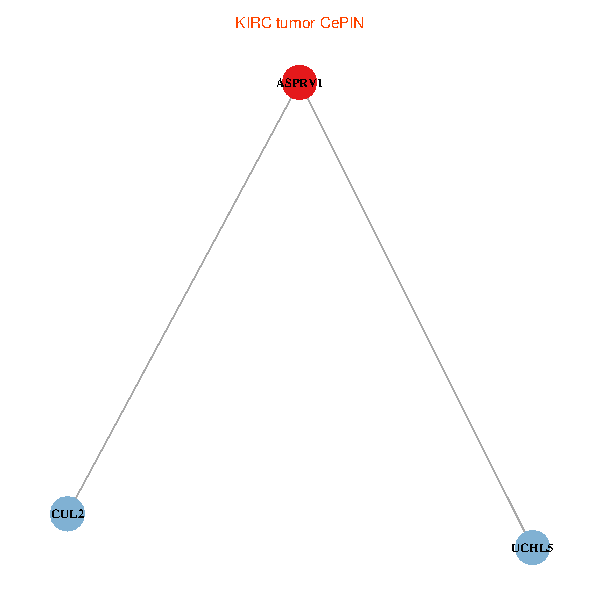
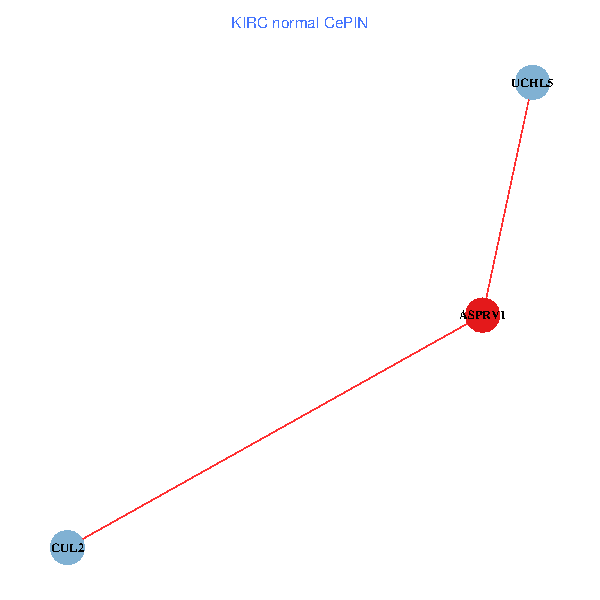
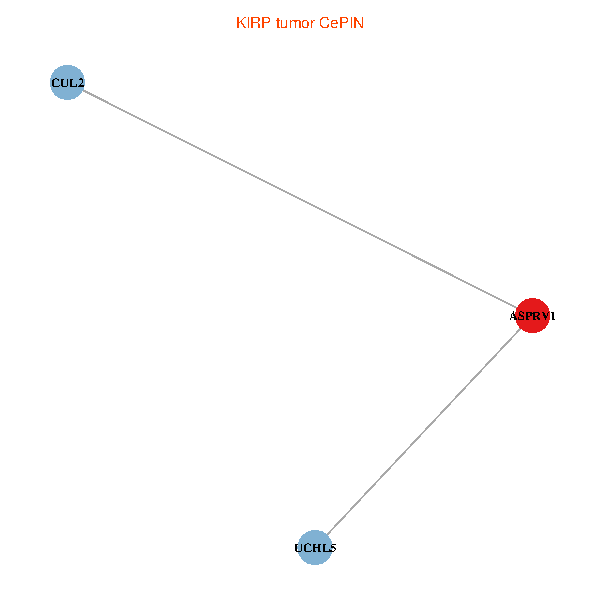
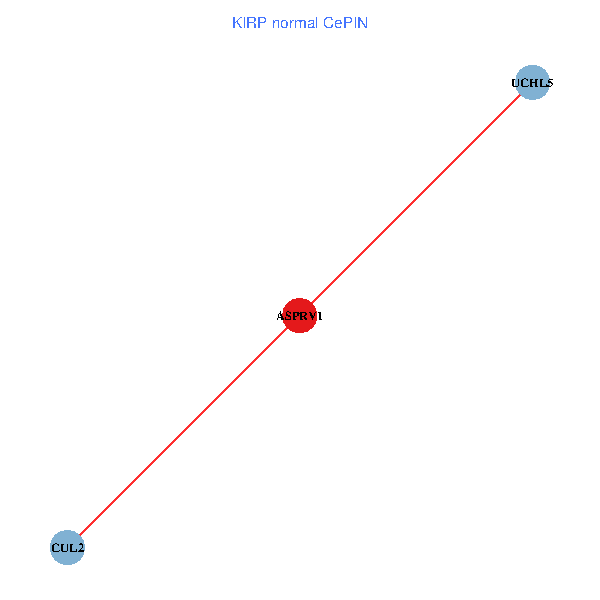
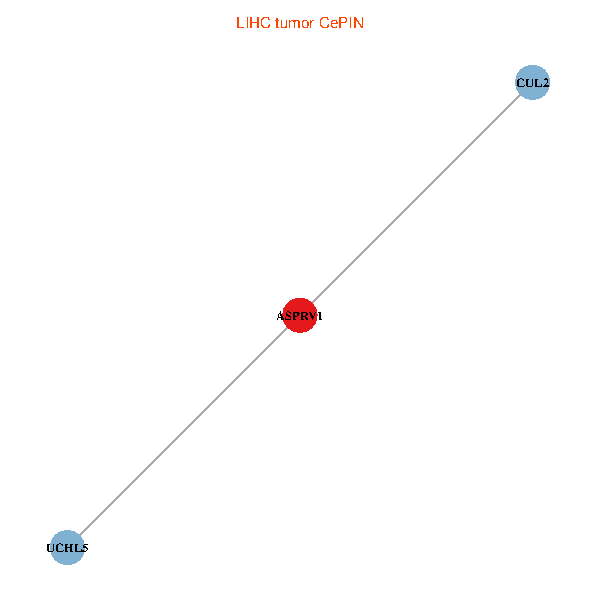
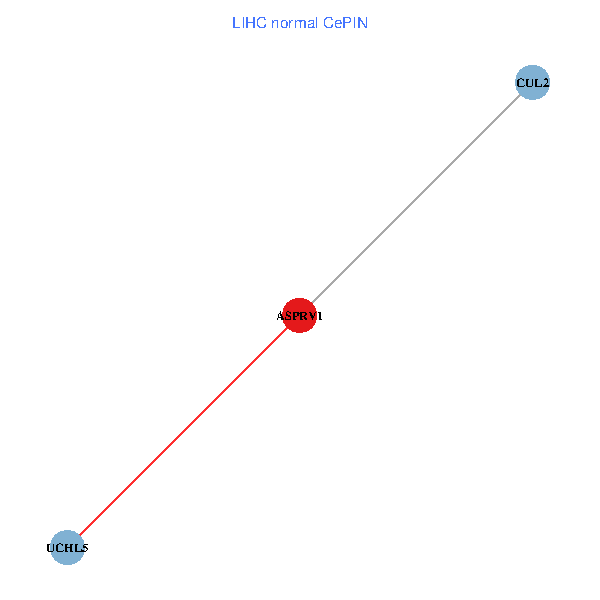
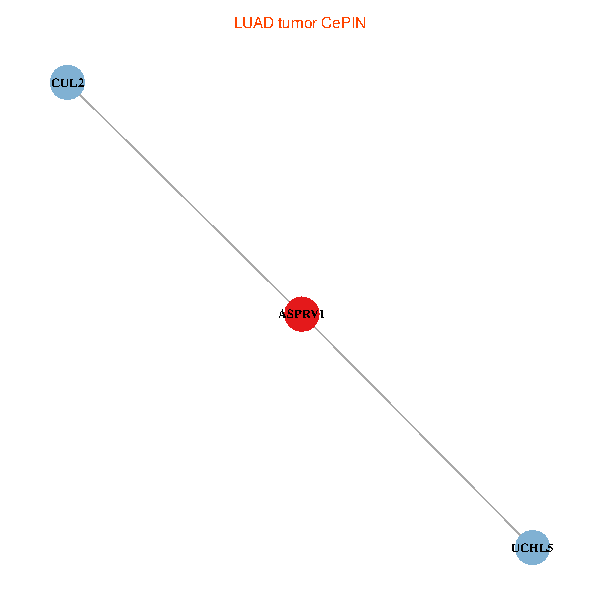
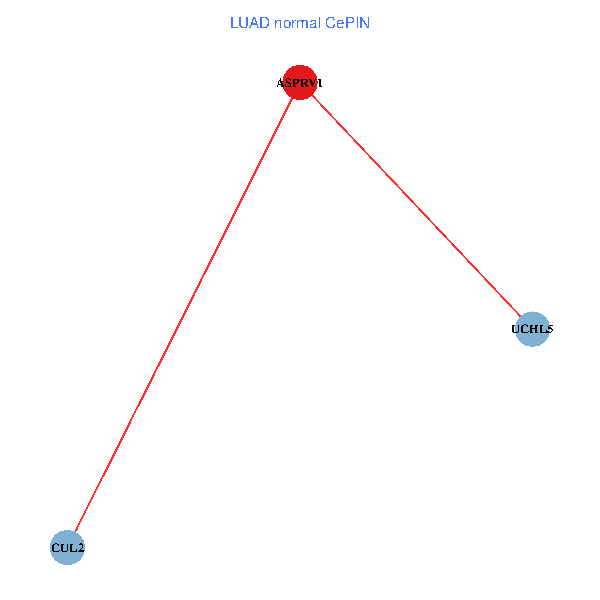
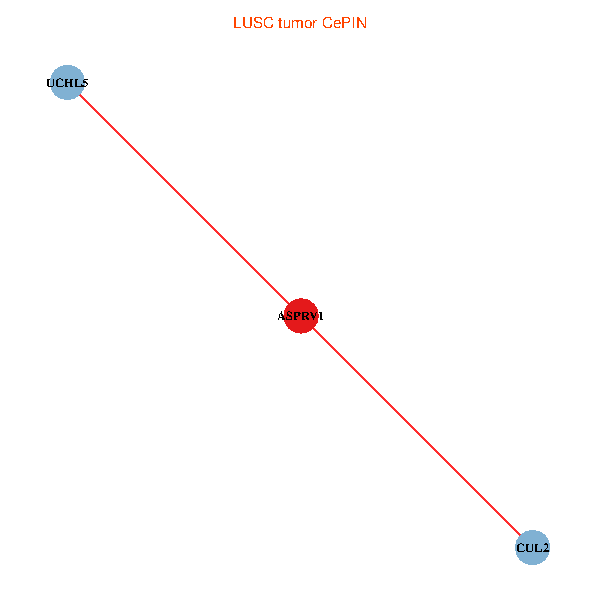
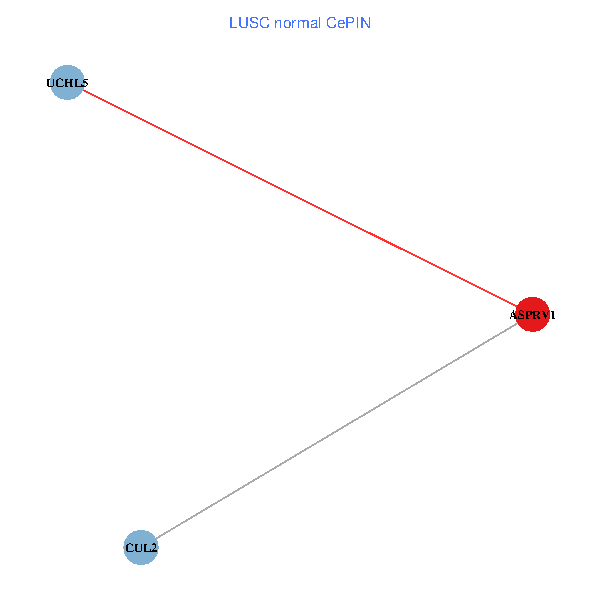
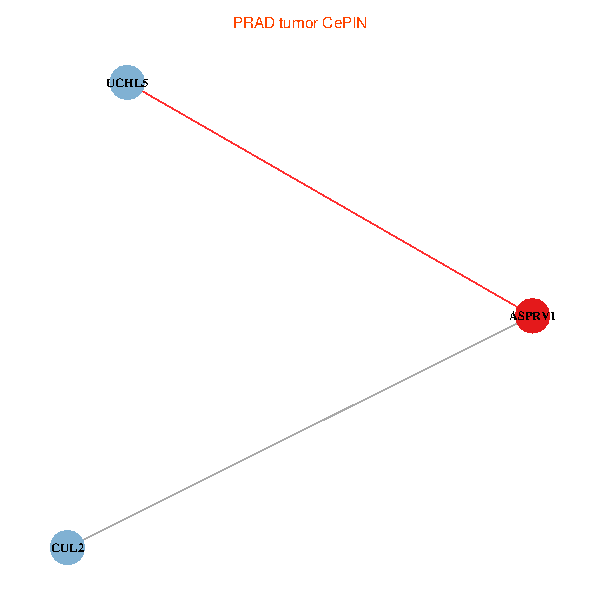
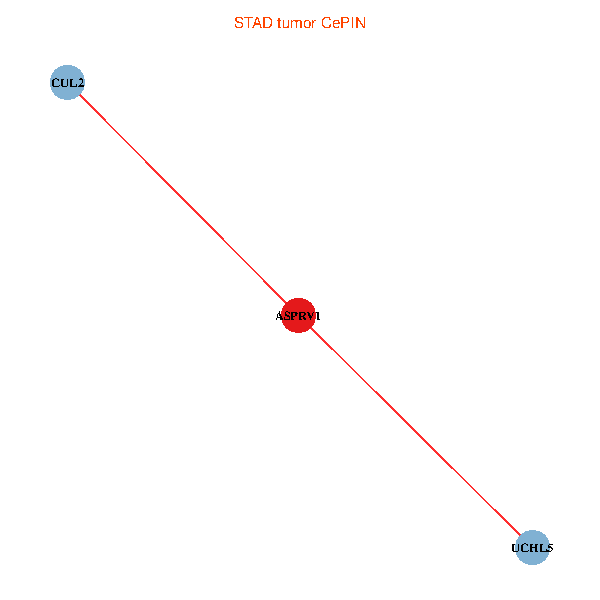
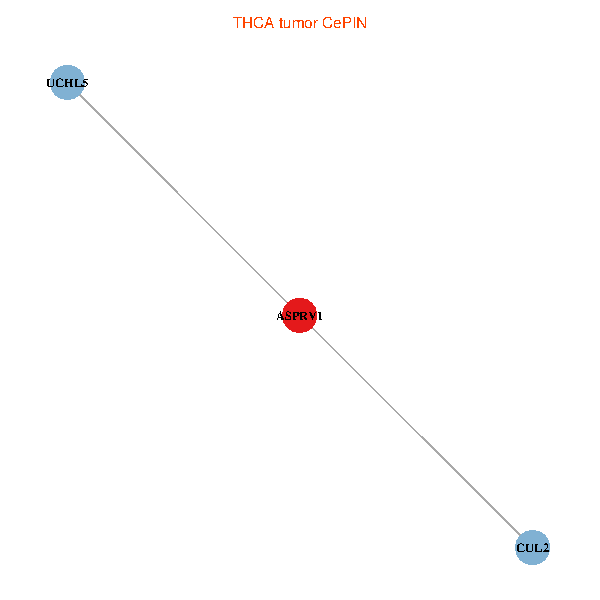
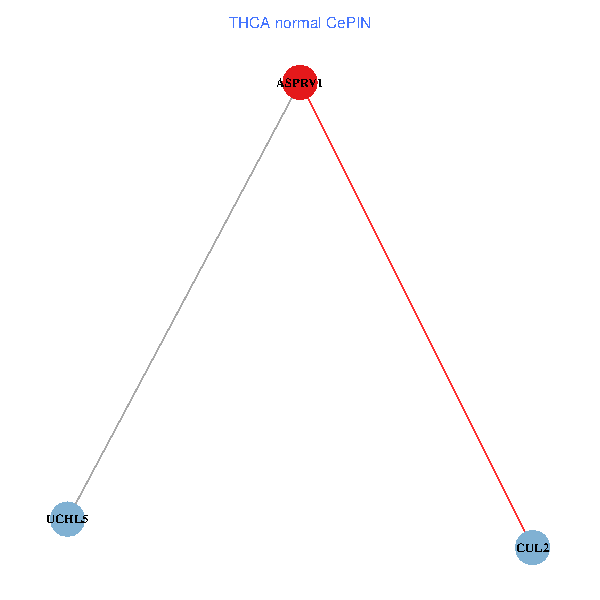
| Co-expressed gene networks based on protein-protein interaction data (CePIN) (TCGA IlluminaHiSeq_RNASeqV2, pan-cancer normalized log2(norm_counts+1) data, version 2016-08-16) (PINA2 ppi data) |
| BRCA (tumor) | BRCA (normal) |
| ASPRV1, CUL2, UCHL5 (tumor) | ASPRV1, CUL2, UCHL5 (normal) |
 |  |
| COAD (tumor) | COAD (normal) |
| ASPRV1, CUL2, UCHL5 (tumor) | ASPRV1, CUL2, UCHL5 (normal) |
 |  |
| HNSC (tumor) | HNSC (normal) |
| ASPRV1, CUL2, UCHL5 (tumor) | ASPRV1, CUL2, UCHL5 (normal) |
 |  |
| KICH (tumor) | KICH (normal) |
| ASPRV1, CUL2, UCHL5 (tumor) | ASPRV1, CUL2, UCHL5 (normal) |
 |  |
| KIRC (tumor) | KIRC (normal) |
| ASPRV1, CUL2, UCHL5 (tumor) | ASPRV1, CUL2, UCHL5 (normal) |
 |  |
| KIRP (tumor) | KIRP (normal) |
| ASPRV1, CUL2, UCHL5 (tumor) | ASPRV1, CUL2, UCHL5 (normal) |
 |  |
| LIHC (tumor) | LIHC (normal) |
| ASPRV1, CUL2, UCHL5 (tumor) | ASPRV1, CUL2, UCHL5 (normal) |
 |  |
| LUAD (tumor) | LUAD (normal) |
| ASPRV1, CUL2, UCHL5 (tumor) | ASPRV1, CUL2, UCHL5 (normal) |
 |  |
| LUSC (tumor) | LUSC (normal) |
| ASPRV1, CUL2, UCHL5 (tumor) | ASPRV1, CUL2, UCHL5 (normal) |
 |  |
| PRAD (tumor) | PRAD (normal) |
| ASPRV1, CUL2, UCHL5 (tumor) | ASPRV1, CUL2, UCHL5 (normal) |
 |  |
| STAD (tumor) | STAD (normal) |
| ASPRV1, CUL2, UCHL5 (tumor) | ASPRV1, CUL2, UCHL5 (normal) |
 |  |
| THCA (tumor) | THCA (normal) |
| ASPRV1, CUL2, UCHL5 (tumor) | ASPRV1, CUL2, UCHL5 (normal) |
 |  |
| Top |
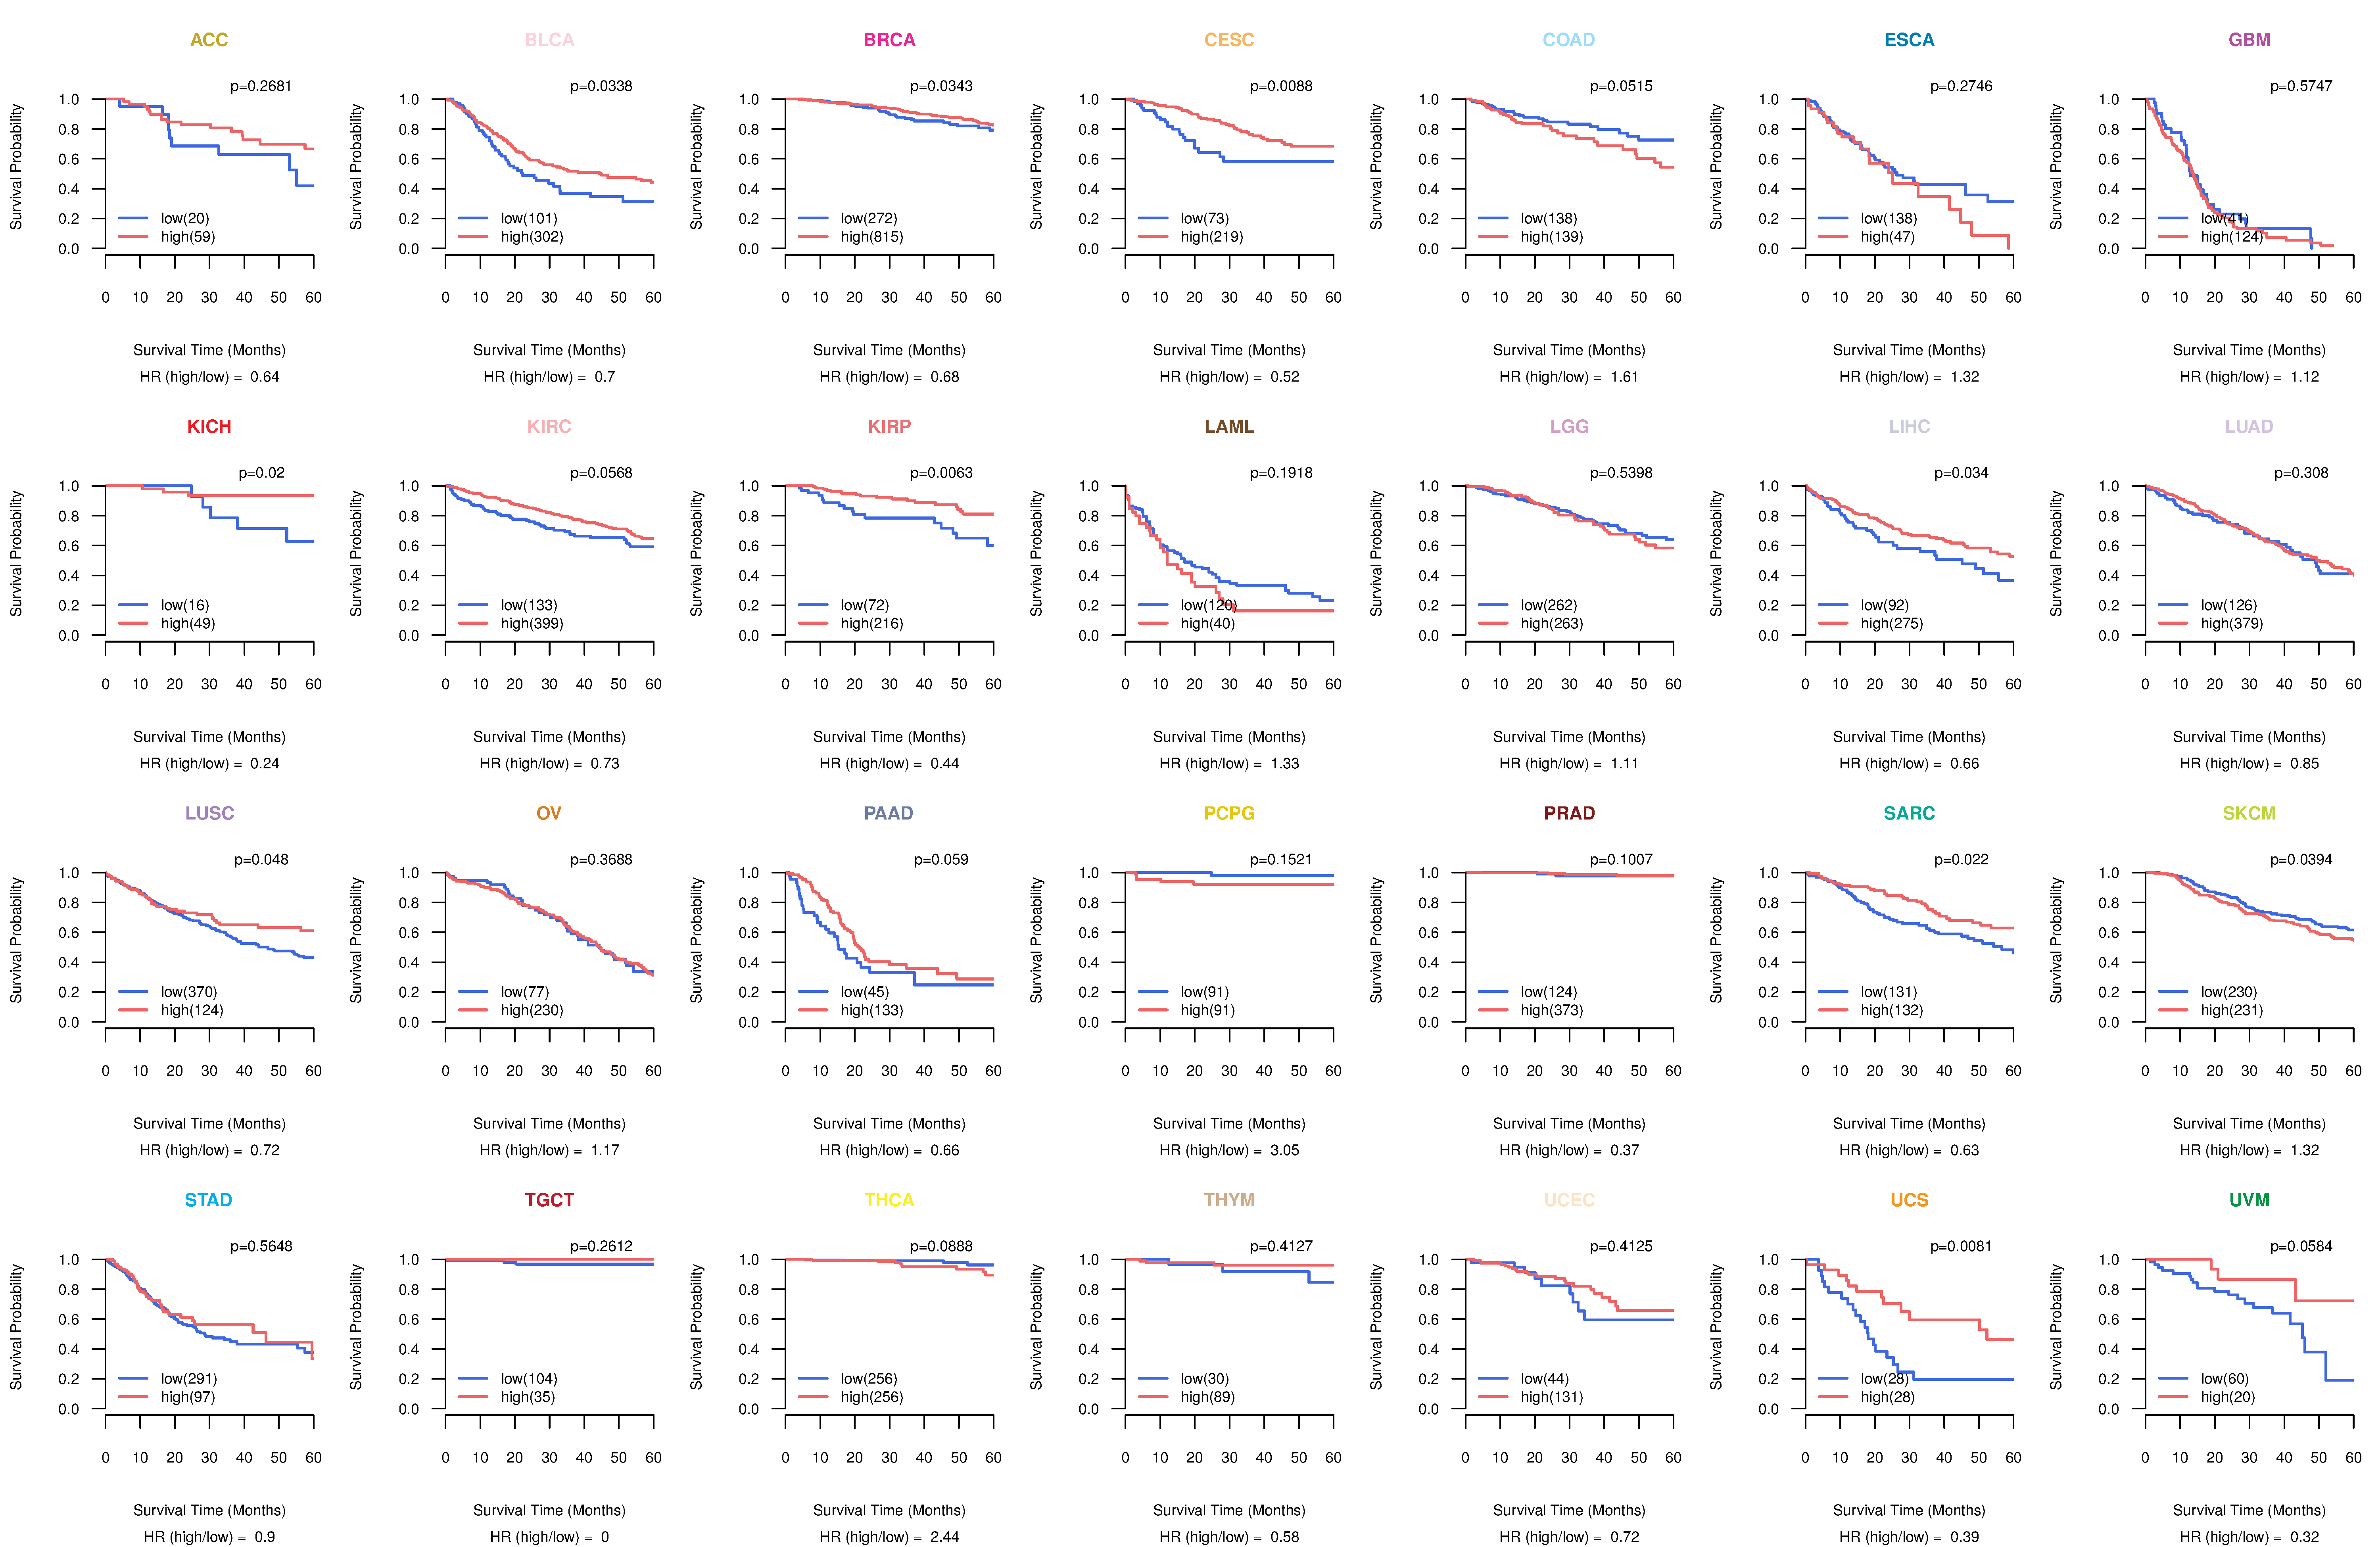
| TissGeneProg for ASPRV1 |
| Kaplan-Meier plots with logrank tests of overall survival (OS) using 28 cancer types (TCGA IlluminaHiSeq_RNASeqV2, pan-cancer normalized log2(norm_counts+1) data, version 2016-08-16) (TCGA clinicalMatrix, phenotype data, version 2016-04-27) * Click on the image to enlarge it in a new window. |
 |
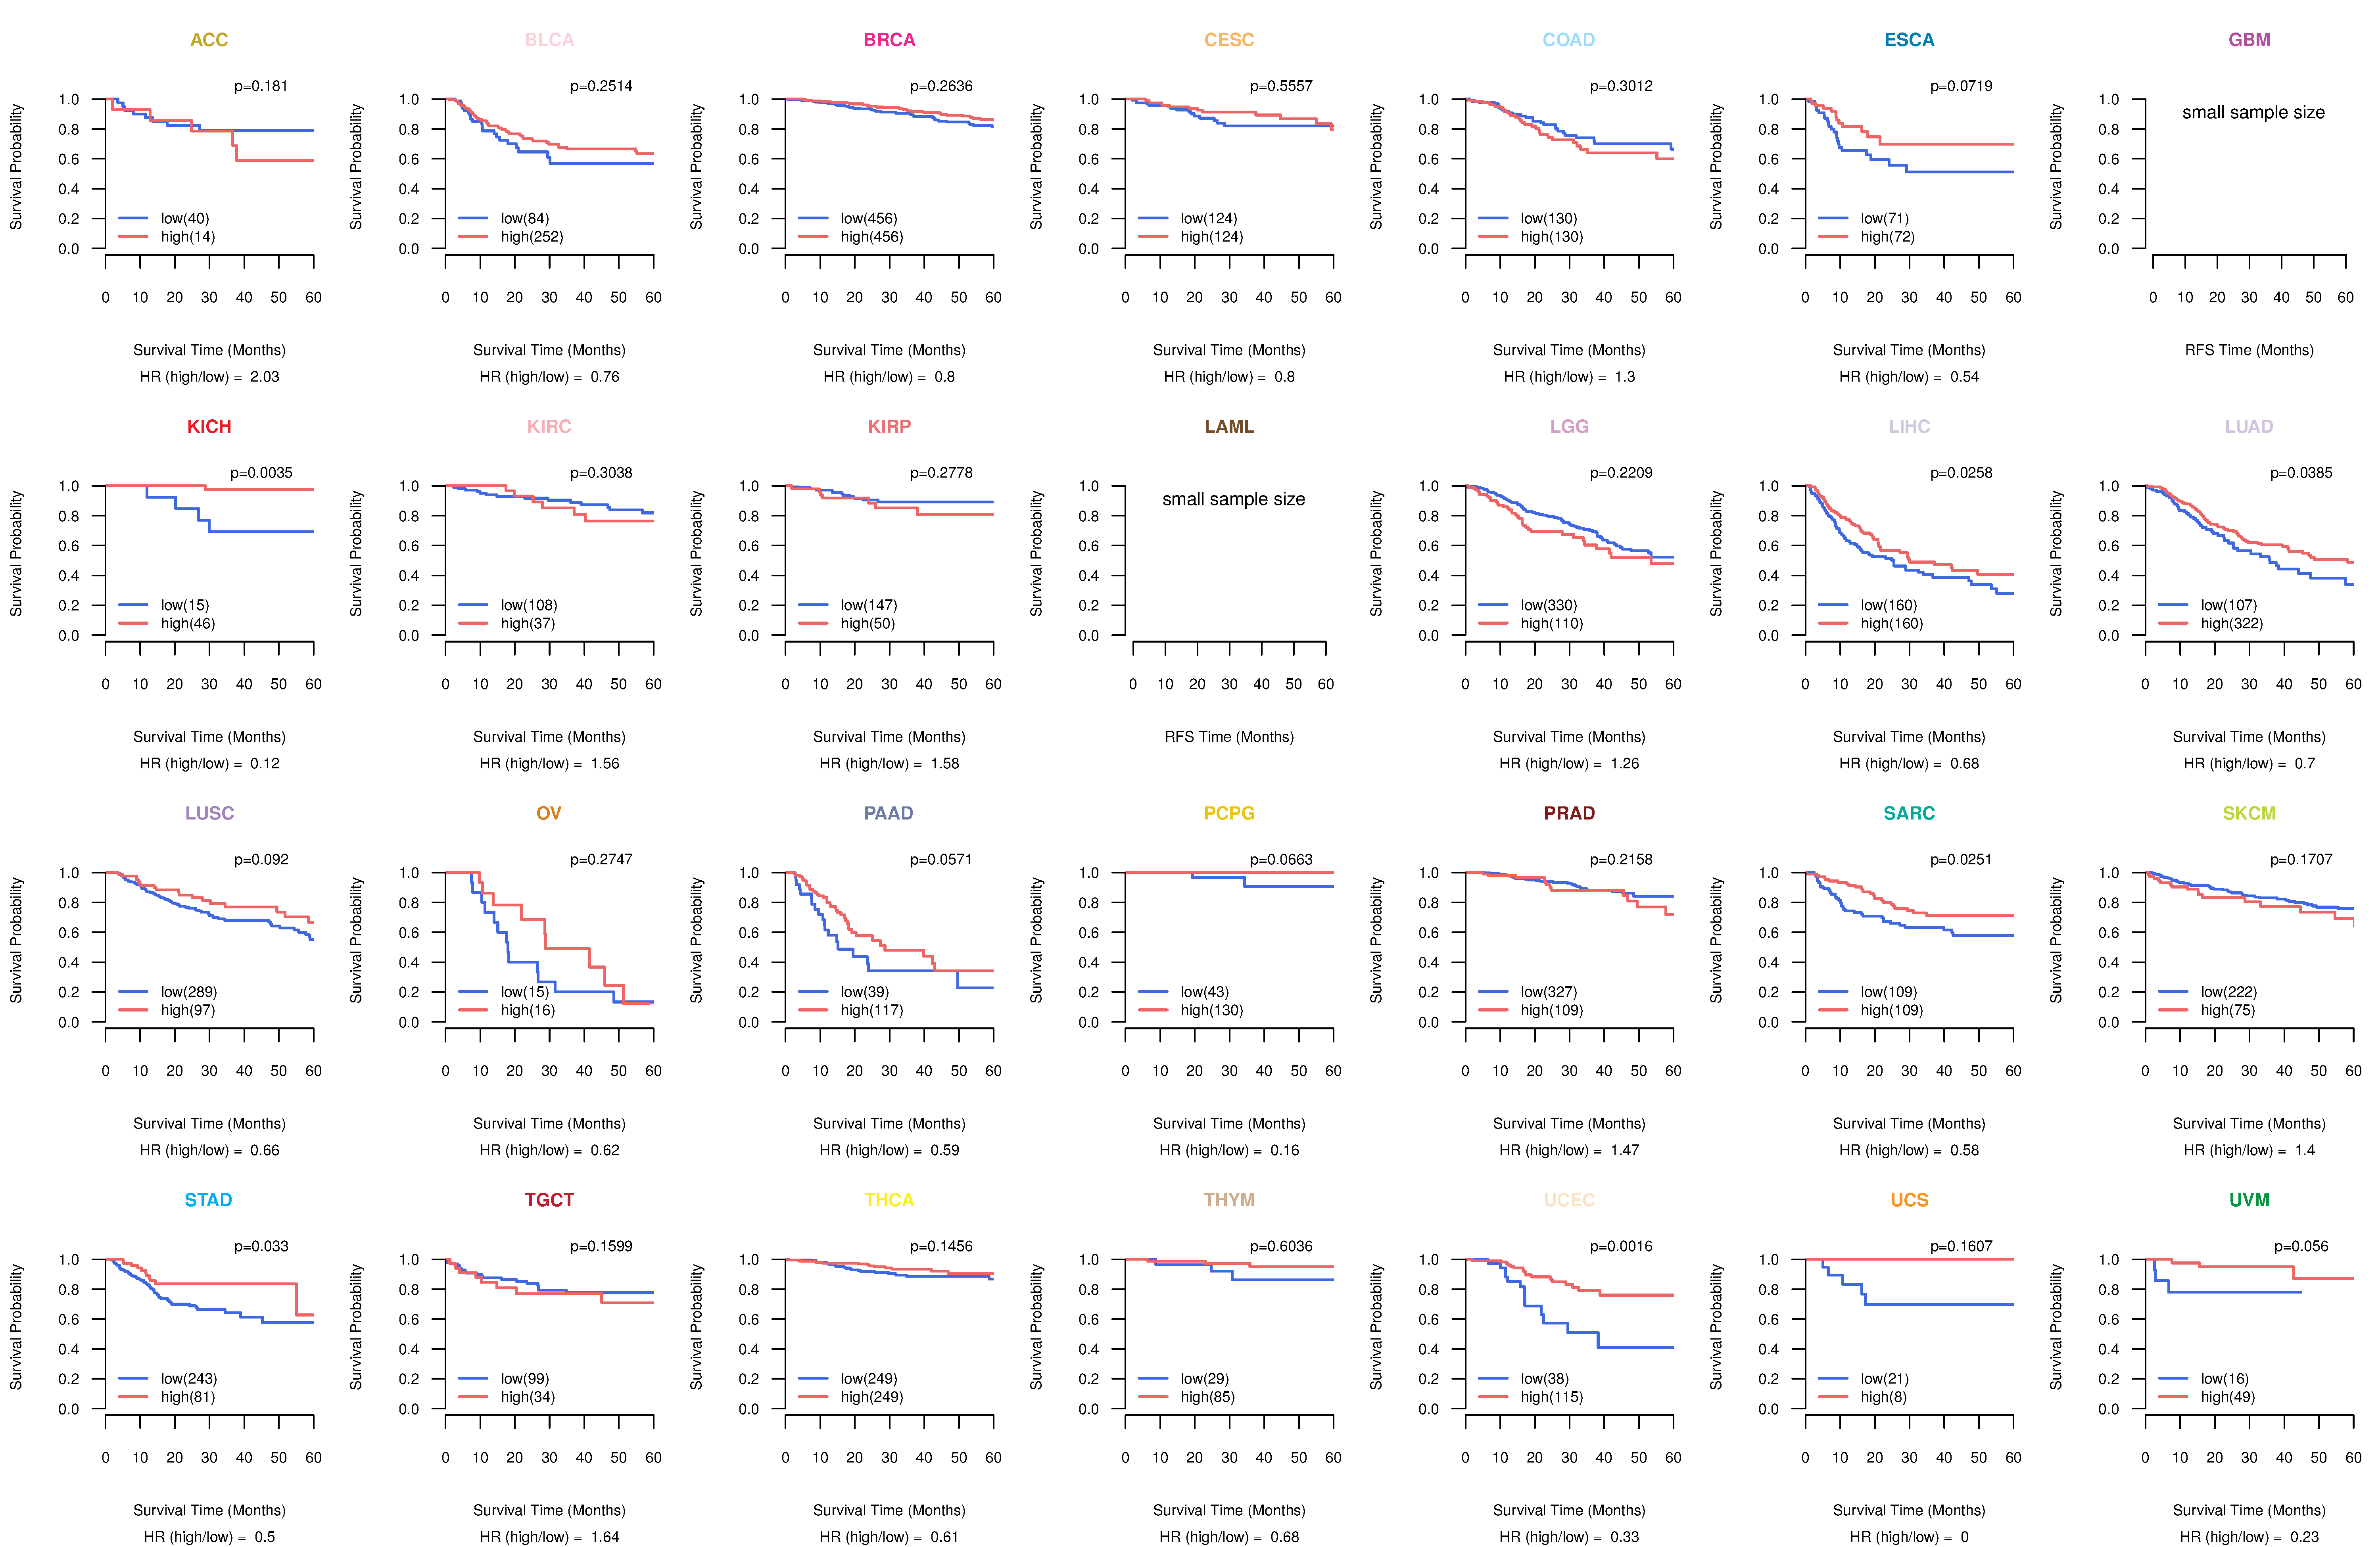
| Kaplan-Meier plots with logrank test of relapse free survival (RFS) using 28 cancer types (TCGA IlluminaHiSeq_RNASeqV2, pan-cancer normalized log2(norm_counts+1) data, version 2016-08-16) (TCGA clinicalMatrix, phenotype data, version 2016-04-27) * Click on the image enlarge it in a new window. |
 |
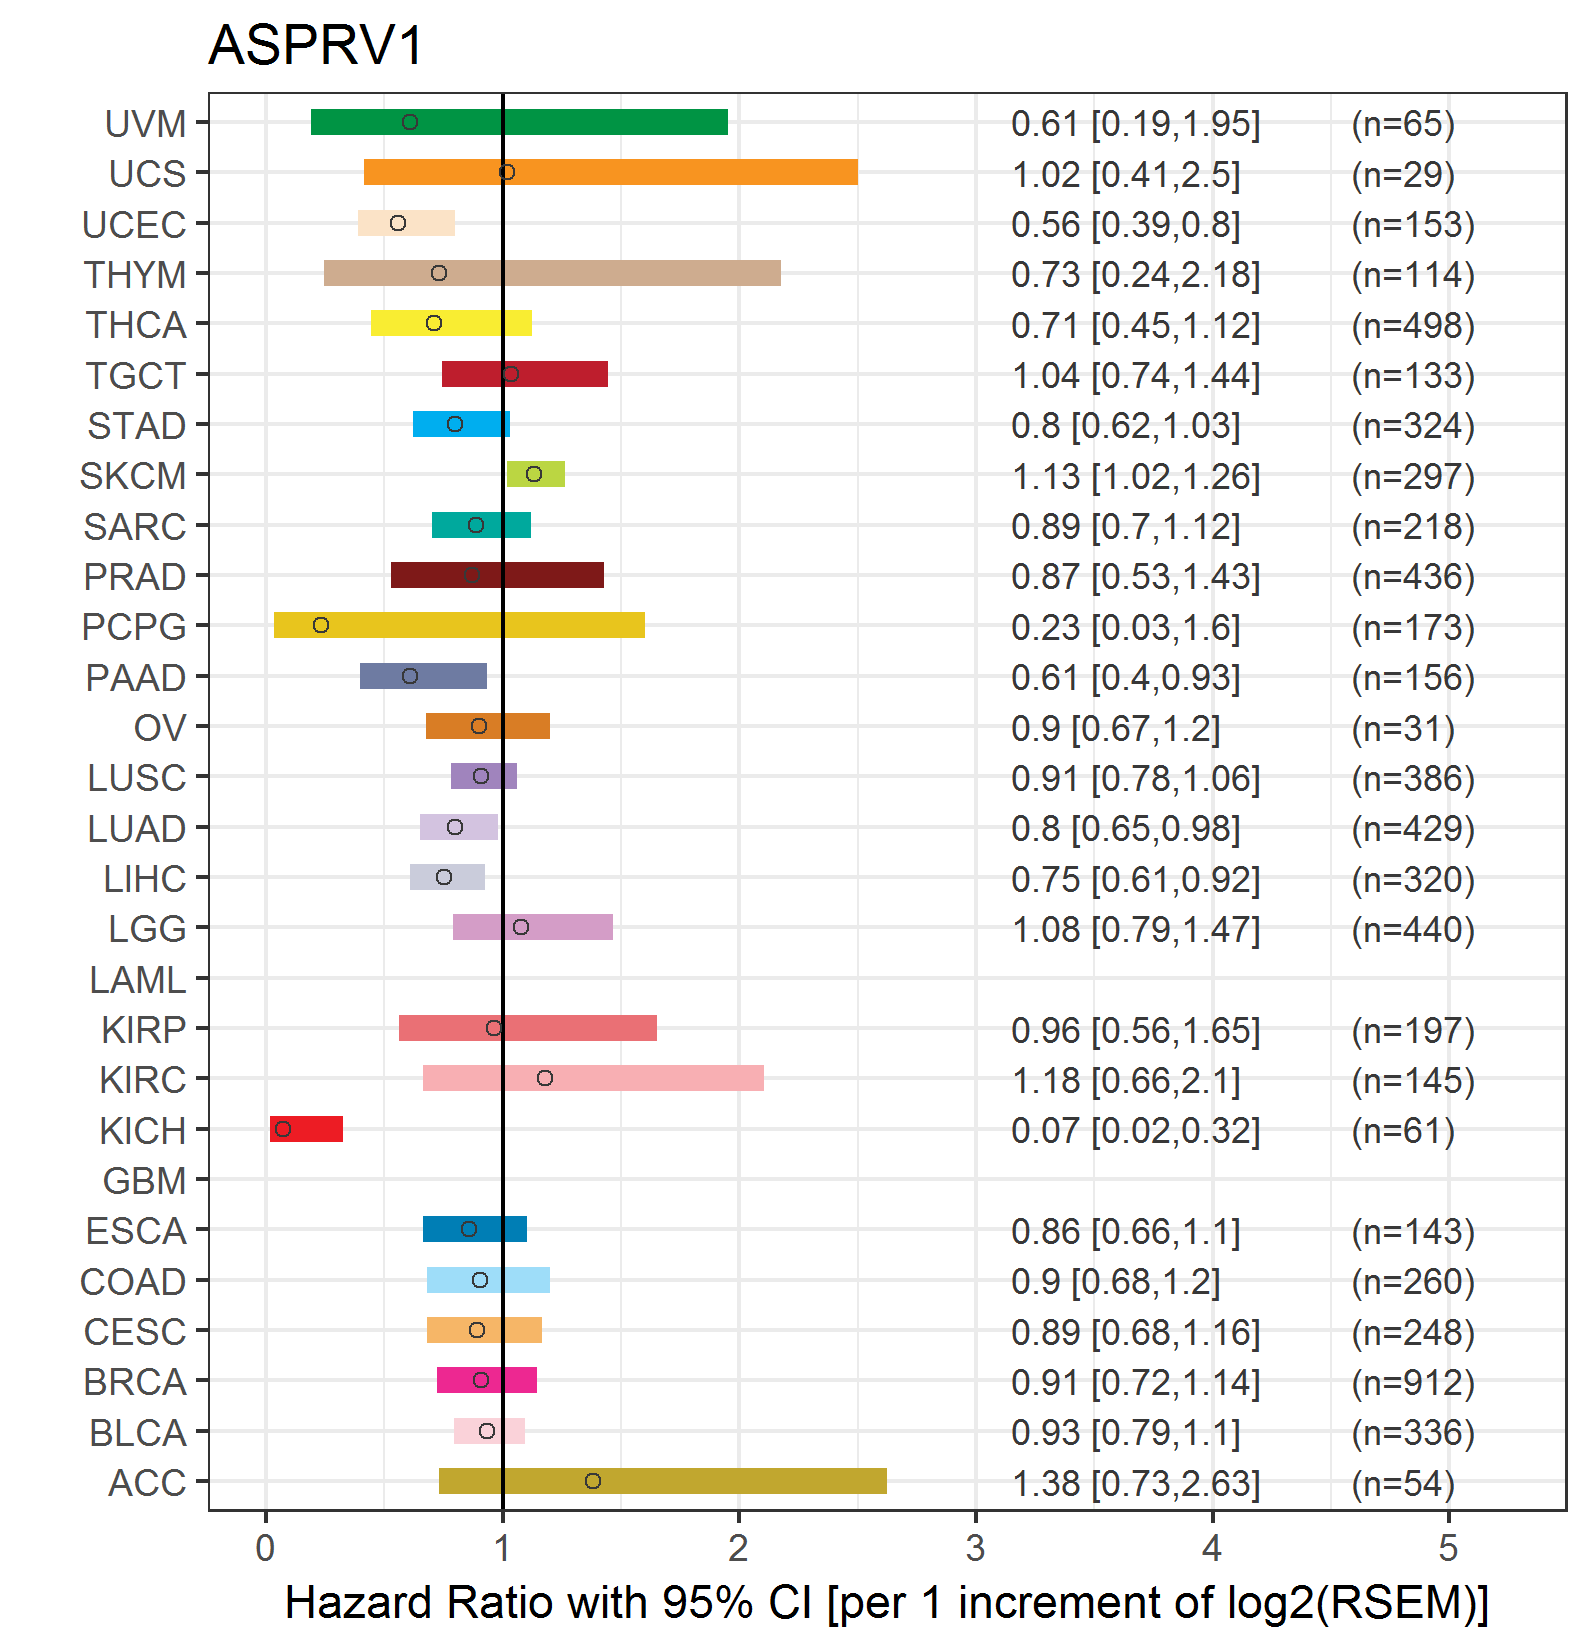
| Forest plot of Cox proportional hazard ratio (HR) and 95% CI of overall survival (OS) using 28 cancer types (TCGA IlluminaHiSeq_RNASeqV2, pan-cancer normalized log2(norm_counts+1) data, version 2016-08-16) (TCGA clinicalMatrix, phenotype data, version 2016-04-27) * Click on the image enlarge it in a new window. |
 |
| Forest plot of Cox proportional hazard ratio (HR) and 95% CI of relapse free survival (RFS) using 28 cancer types (TCGA IlluminaHiSeq_RNASeqV2, pan-cancer normalized log2(norm_counts+1) data, version 2016-08-16) (TCGA clinicalMatrix, phenotype data, version 2016-04-27) * Click on the image enlarge it in a new window. |
 |
| Top |
| TissGeneClin for ASPRV1 |
| TissGeneDrug for ASPRV1 |
| Drug information targeting TissGene (DrugBank Version 5.0.6, 2017-04-01) |
| DrugBank ID | Drug name | Drug activity | Drug type | Drug status |
| Top |
| TissGeneDisease for ASPRV1 |
| Disease information associated with TissGene (DisGeNet, 2016-06-01) |
| Disease ID | Disease name | # pubmeds | Source |
| umls:C0006142 | Malignant neoplasm of breast | 1 | BeFree |
| umls:C0007137 | Squamous cell carcinoma | 1 | LHGDN |
| umls:C0029463 | Osteosarcoma | 1 | BeFree |
| umls:C0032927 | Precancerous Conditions | 1 | BeFree |
| umls:C0151908 | Dry skin | 1 | BeFree |
| umls:C0678222 | Breast Carcinoma | 1 | BeFree |
|
Copyright 2016-Present - The University of Texas Health Science Center at Houston (UTHealth) Web File Viewing | How to Report, Fraud, Waste and Abuse | State of Texas | Statewide Search | Texas Homeland Security | Site Policies |