 |
| |
| |
| |
| |
| |
| |
|

| TissGeneSummary for CPNE9 |
 Gene summary Gene summary |
| Basic gene information | Gene symbol | CPNE9 |
| Gene name | copine family member IX | |
| Synonyms | - | |
| Cytomap | UCSC genome browser: 3p25.3 | |
| Type of gene | protein-coding | |
| RefGenes | NM_153635.2, | |
| Description | copine IXcopine-9copine-like protein | |
| Modification date | 20141207 | |
| dbXrefs | HGNC : HGNC | |
| Ensembl : ENSG00000144550 | ||
| HPRD : 17307 | ||
| Vega : OTTHUMG00000128418 | ||
| Protein | UniProt: go to UniProt's Cross Reference DB Table | |
| Expression | CleanEX: HS_CPNE9 | |
| BioGPS: 151835 | ||
| Pathway | NCI Pathway Interaction Database: CPNE9 | |
| KEGG: CPNE9 | ||
| REACTOME: CPNE9 | ||
| Pathway Commons: CPNE9 | ||
| Context | iHOP: CPNE9 | |
| ligand binding site mutation search in PubMed: CPNE9 | ||
| UCL Cancer Institute: CPNE9 | ||
| Assigned class in TissGDB* | C | |
| Included tissue-specific gene expression resources | HPA,TiGER | |
| Specific-tissues in normal samples (assigned by TissGDB using HPA, TiGER, and GTEx) | BrainPancreas | |
| Cancer types related to the specific-tissues in cancer samples (assigned by TissGDB using TCGA) | GBM,LGGPAAD | |
| Reference showing the relevant tissue of CPNE9 | ||
| Description by TissGene annotations | Protective TissGene in OS Protective TissGene in RFS | |
| * Class A consists of genes with literature evidence and is part of the cTissGenes. Class B consists of only cTissGenes without additional evidence. The remaining genes belong to Class C. |
| Gene ontology having evidence of Inferred from Direct Assay (IDA) from Entrez |
| GO ID | GO term | PubMed ID |
| Top |
| TissGeneExp for CPNE9 |
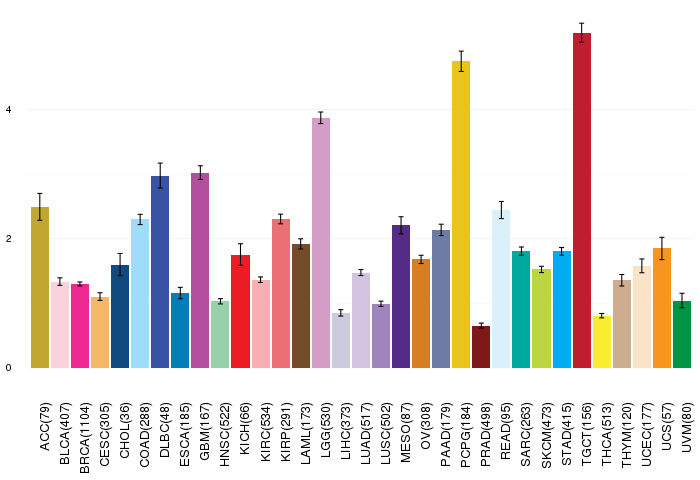
| Gene expressions across 28 cancer types (X-axis: cancer type and Y-axis: log2(norm_counts+1)) (TCGA IlluminaHiSeq_RNASeqV2, pan-cancer normalized log2(norm_counts+1) data, version 2016-08-16) |
 |
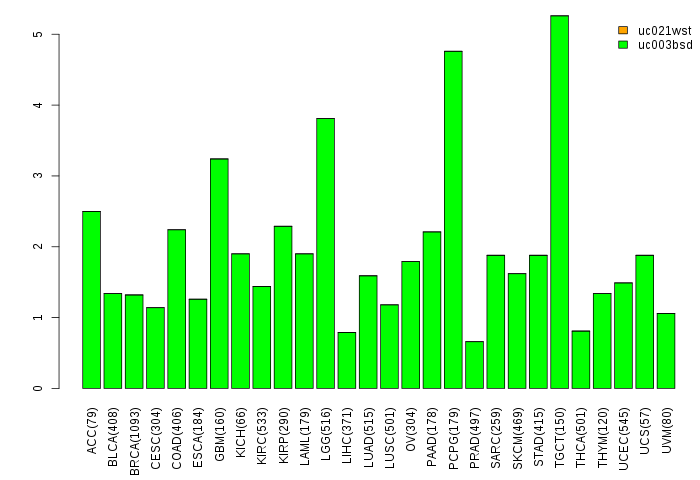
| Gene isoform expressions across 28 cancer types (X-axis: cancer type and Y-axis: log2(norm_counts+1)) (TCGA pan-cancer tcga_rsem_isoform_tpm, version 2016-09-01) |
 |
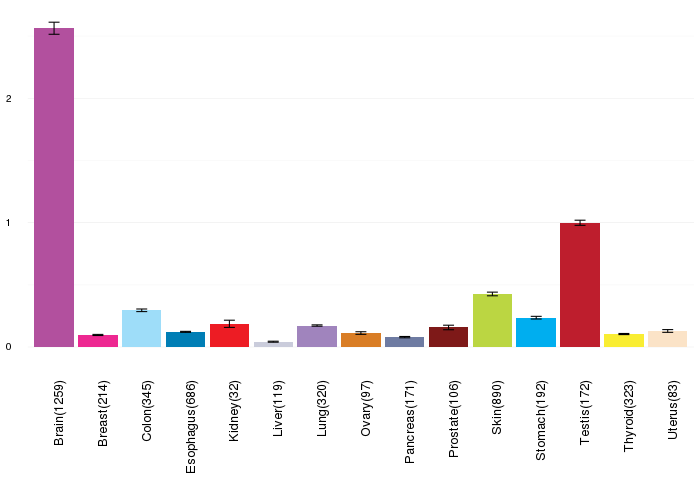
| Gene expressions across normal tissues of GTEx data (GTEx GTEx_Analysis_v6_RNA-seq_RNA-SeQCv1.1.8_gene_rpkm.gct) - Here, we shows the matched tissue types only among our 28 cancer types. |
 |
| Different expressions across 14 cancer types with more than 10 samples between matched tumors and normals (X-axis: cancer type and Y-axis: log2(norm_counts+1)) (TCGA IlluminaHiSeq_RNASeqV2, pan-cancer normalized log2(norm_counts+1) data, version 2016-08-16) |
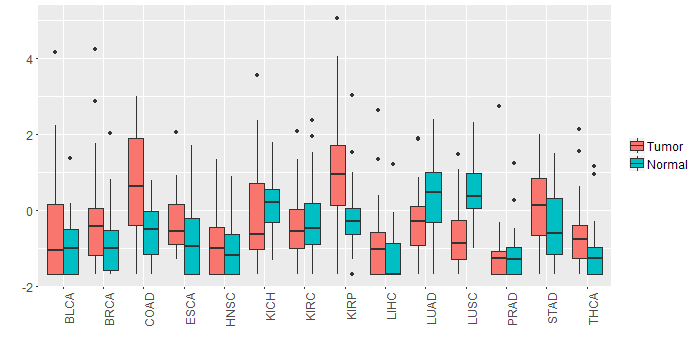 |
| - Significantly differentially expressed cancer types and information. (|Fold change|>1 and FDR<0.05) |
| Cancer type | Mean(exp) in tumor | Mean(exp) in matched normal | Log2FC | P-val. | FDR |
| LUSC | -0.752819126 | 0.499559306 | -1.252378431 | 1.84E-13 | 9.23E-13 |
| COAD | 0.720193092 | -0.580091524 | 1.300284615 | 8.85E-05 | 0.00032754 |
| KIRP | 1.103634919 | -0.177524456 | 1.281159375 | 5.93E-05 | 0.000213747 |
| Top |
| TissGene-miRNA for CPNE9 |
| Significantly anti-correlated miRNAs of TissGene across 28 cancer types (Gene-miRNA relations from TargetScanHuman Relsease 7.1, Conserved_Site_Context_Scores.txt.zip, 06.01.2016) (TCGA IlluminaHiSeq_miRNASeq, log2(RPM+1) data, version 2016-11-21) (TCGA IlluminaHiSeq_RNASeqV2, log2(normalized_count+1) data, version 2016-08-16) (Spearman’s Rank Correlation (p-value<0.05 and coefficient<-0.25)) |
| Cancer type | miRNA id | miRNA accession | P-val. | Coeff. | # samples |
| Top |
| TissGeneMut for CPNE9 |
| TissGeneSNV for CPNE9 |
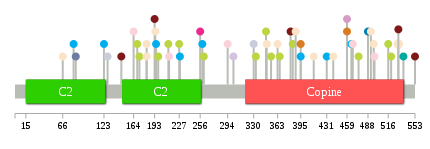
| nsSNV counts per each loci. Different colors of circles represent different cancer types. Circle size denotes number of samples. (TCGA somatic mutation (SNPs and small INDELs) data, version 2016-04-25) * Click on the image to enlarge it in a new window. |
 |
 |
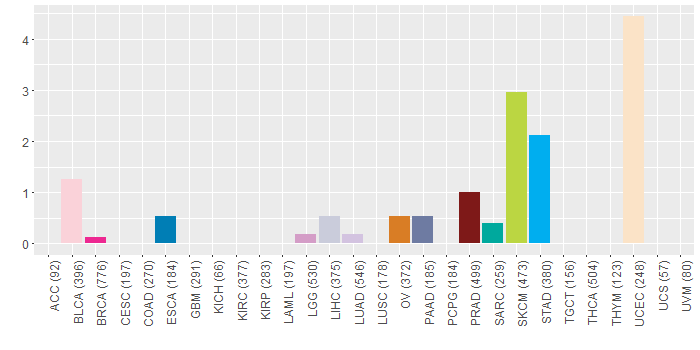
| Somatic nucleotide variants of TissGene across 28 cancer types (X-axis: cancer type and Y-axis: % of mutated samples) The numbers in parentheses are numbers of samples with mutation (nsSNVs). (TCGA somatic mutation (SNPs and small INDELs) data, version 2016-04-25) |
 |
| - nsSNVs sorted by frequency. |
| AAchange | Cancer type | # samples |
| p.R530C | UCEC | 2 |
| p.R395C | STAD | 1 |
| p.G363* | UCEC | 1 |
| p.D66E | UCEC | 1 |
| p.R395G | HNSC | 1 |
| p.R537W | SARC | 1 |
| p.E384K | SKCM | 1 |
| p.F164L | BLCA | 1 |
| p.E256V | BRCA | 1 |
| p.G354S | SKCM | 1 |
| p.V128A | LIHC | 1 |
| p.D475N | SKCM | 1 |
| p.R395C | OV | 1 |
| p.T195M | STAD | 1 |
| p.L25V | CHOL | 1 |
| p.Y330C | LIHC | 1 |
| p.D227E | SKCM | 1 |
| p.Q492H | UCEC | 1 |
| p.R84C | PAAD | 1 |
| p.L172F | SKCM | 1 |
| p.N194S | UCEC | 1 |
| p.D516N | SKCM | 1 |
| p.E467Q | BLCA | 1 |
| p.T182M | UCEC | 1 |
| p.P553L | PRAD | 1 |
| p.N259K | STAD | 1 |
| p.R261W | SKCM | 1 |
| p.R228Q | STAD | 1 |
| p.E388D | UCEC | 1 |
| p.V459I | OV | 1 |
| p.Q81* | STAD | 1 |
| p.A381V | PRAD | 1 |
| p.T182_splice | UCEC | 1 |
| p.V302E | LUAD | 1 |
| p.A333T | SKCM | 1 |
| p.K193N | PRAD | 1 |
| p.R488W | ESCA | 1 |
| p.V459I | LGG | 1 |
| p.R147W | PRAD | 1 |
| p.P198S | SKCM | 1 |
| p.D347N | SKCM | 1 |
| p.R123* | STAD | 1 |
| p.E520K | SKCM | 1 |
| p.R497Q | BLCA | 1 |
| p.G294E | BLCA | 1 |
| p.S366F | SKCM | 1 |
| p.F496V | UCEC | 1 |
| p.M465T | STAD | 1 |
| p.K267M | HNSC | 1 |
| p.A413V | UCEC | 1 |
| p.N212T | SKCM | 1 |
| p.D169N | SKCM | 1 |
| p.G115A | HNSC | 1 |
| p.T440M | UCEC | 1 |
| p.K348T | UCEC | 1 |
| p.G213E | BLCA | 1 |
| p.R530C | PRAD | 1 |
| p.I431V | STAD | 1 |
| Top |
| TissGeneCNV for CPNE9 |
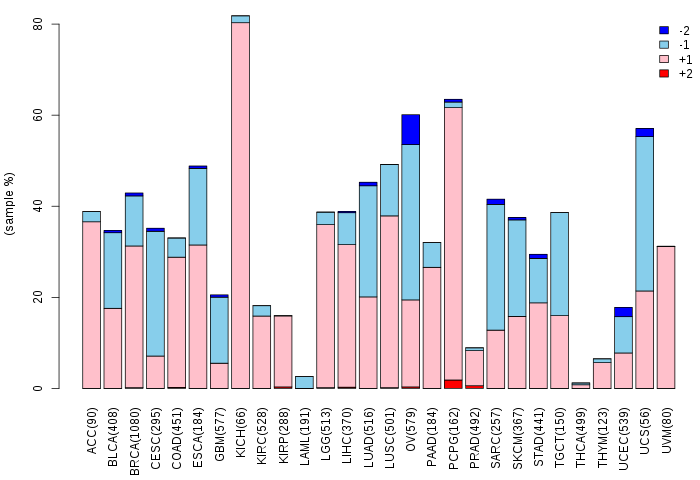
| Copy number variations of TissGene across 28 cancer types (X-axis: cancer type and Y-axis: % of CNV samples) (TCGA Gistic2_CopyNumber_Gistic2_all_data_by_genes, Gistic2 copy number data, version 2016-08-16) |
 |
| Top |
| TissGeneFusions for CPNE9 |
| Fusion genes including TissGene (ChimerDB 3.0, 2016-12-01 and TCGA fusion Portal 2015-12-01) |
| Database | Src | Cancer type | Sample | Fusion gene | ORF | 5'-gene BP | 3'-gene BP |
| Chimerdb3.0 | TopHat-Fusion | PRAD | TCGA-EJ-7788-01A | LINC01237-CPNE9 | Out-of-Frame | chr2:242824785 | chr3:9754224 |
| Chimerdb3.0 | TopHat-Fusion | PRAD | TCGA-EJ-7788-01A | LINC01237-CPNE9 | Out-of-Frame | chr2:242829999 | chr3:9754224 |
| Top |
| TissGeneNet for CPNE9 |
| Co-expressed gene networks based on protein-protein interaction data (CePIN) (TCGA IlluminaHiSeq_RNASeqV2, pan-cancer normalized log2(norm_counts+1) data, version 2016-08-16) (PINA2 ppi data) |
| Top |
| TissGeneProg for CPNE9 |
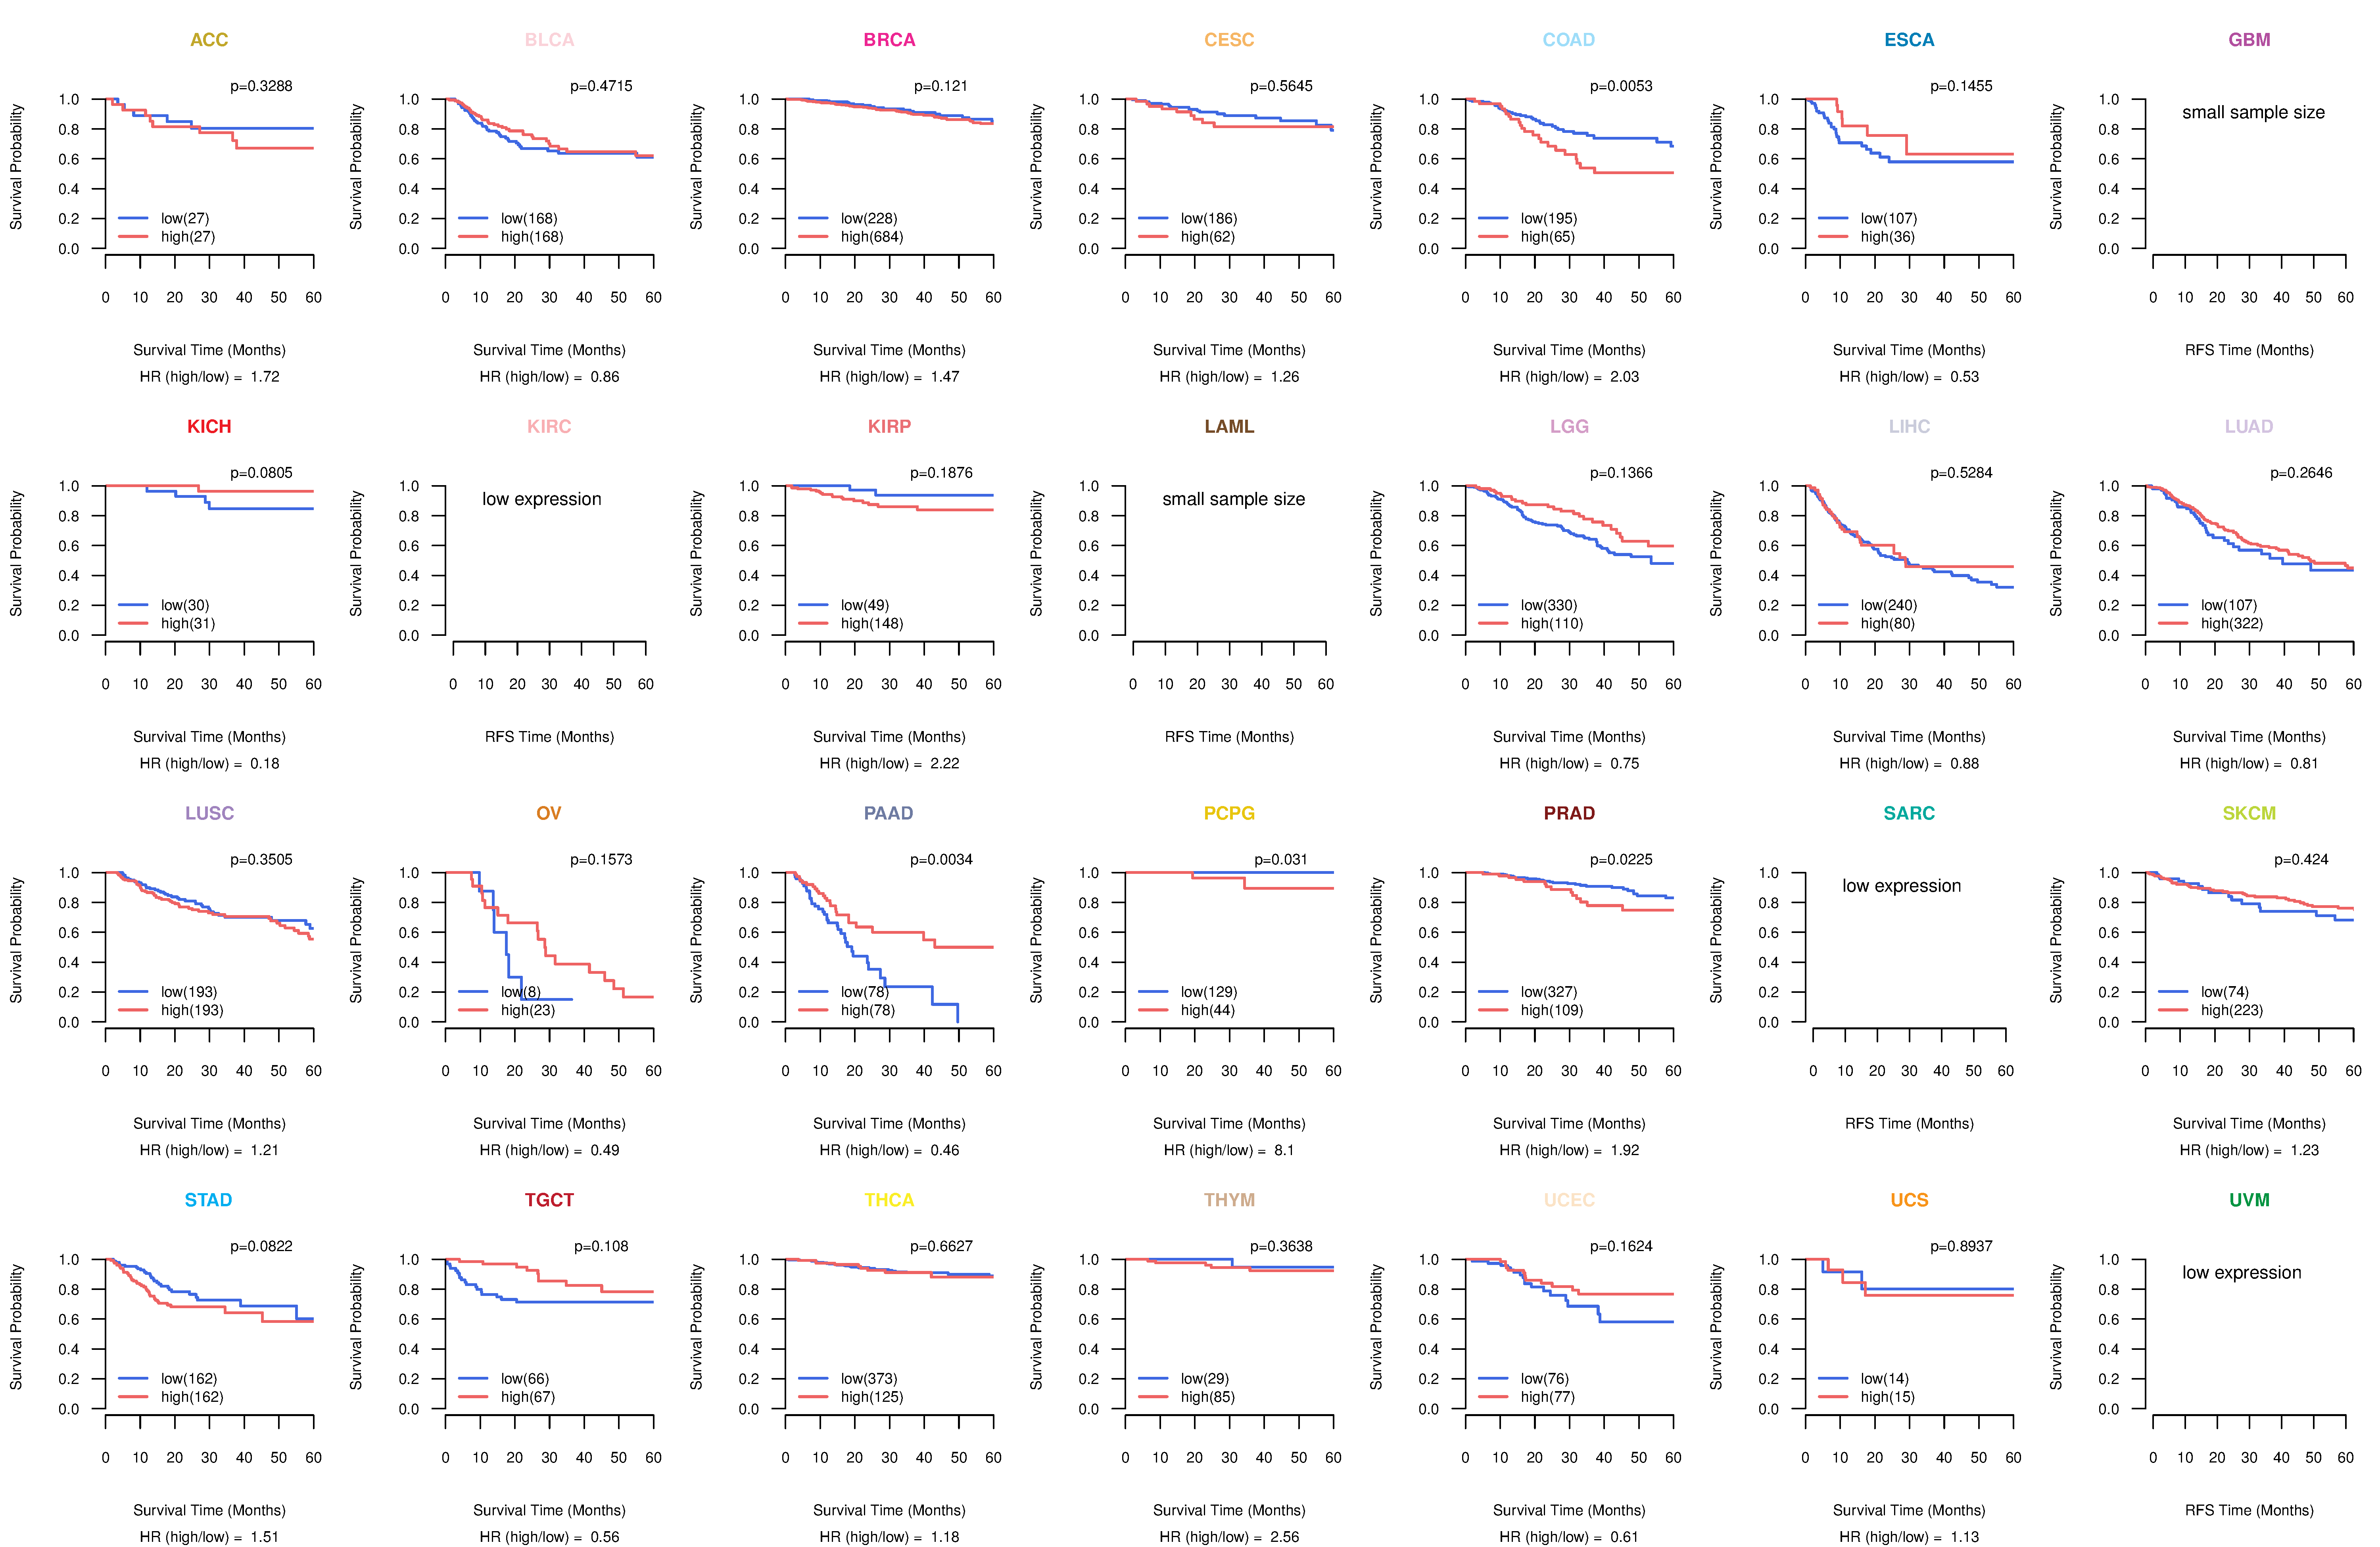
| Kaplan-Meier plots with logrank tests of overall survival (OS) using 28 cancer types (TCGA IlluminaHiSeq_RNASeqV2, pan-cancer normalized log2(norm_counts+1) data, version 2016-08-16) (TCGA clinicalMatrix, phenotype data, version 2016-04-27) * Click on the image to enlarge it in a new window. |
 |
| Kaplan-Meier plots with logrank test of relapse free survival (RFS) using 28 cancer types (TCGA IlluminaHiSeq_RNASeqV2, pan-cancer normalized log2(norm_counts+1) data, version 2016-08-16) (TCGA clinicalMatrix, phenotype data, version 2016-04-27) * Click on the image enlarge it in a new window. |
 |
| Forest plot of Cox proportional hazard ratio (HR) and 95% CI of overall survival (OS) using 28 cancer types (TCGA IlluminaHiSeq_RNASeqV2, pan-cancer normalized log2(norm_counts+1) data, version 2016-08-16) (TCGA clinicalMatrix, phenotype data, version 2016-04-27) * Click on the image enlarge it in a new window. |
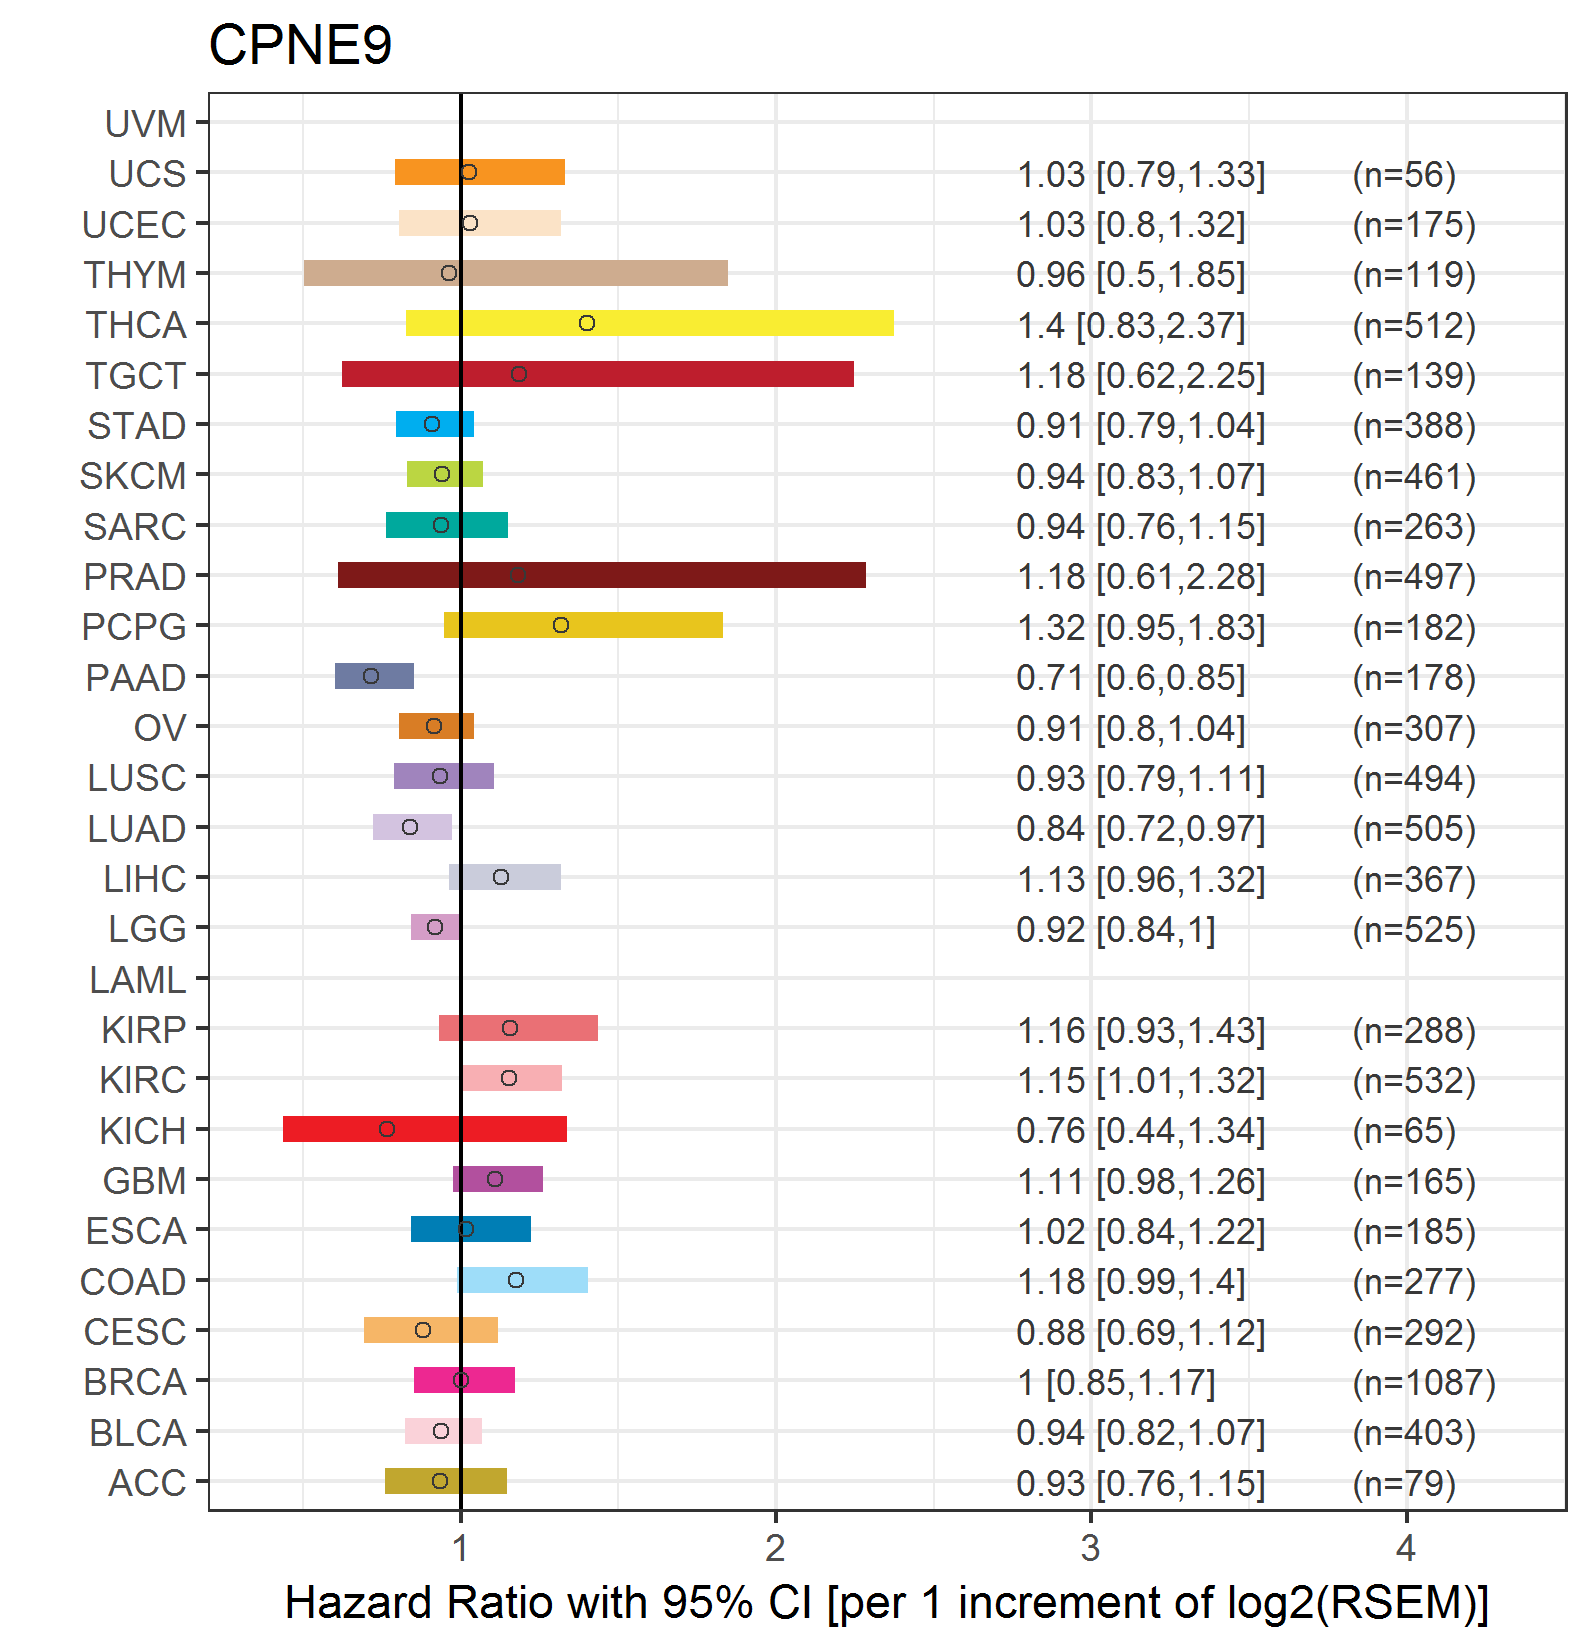 |
| Forest plot of Cox proportional hazard ratio (HR) and 95% CI of relapse free survival (RFS) using 28 cancer types (TCGA IlluminaHiSeq_RNASeqV2, pan-cancer normalized log2(norm_counts+1) data, version 2016-08-16) (TCGA clinicalMatrix, phenotype data, version 2016-04-27) * Click on the image enlarge it in a new window. |
 |
| Top |
| TissGeneClin for CPNE9 |
| TissGeneDrug for CPNE9 |
| Drug information targeting TissGene (DrugBank Version 5.0.6, 2017-04-01) |
| DrugBank ID | Drug name | Drug activity | Drug type | Drug status |
| Top |
| TissGeneDisease for CPNE9 |
| Disease information associated with TissGene (DisGeNet, 2016-06-01) |
| Disease ID | Disease name | # pubmeds | Source |
|
Copyright 2016-Present - The University of Texas Health Science Center at Houston (UTHealth) Web File Viewing | How to Report, Fraud, Waste and Abuse | State of Texas | Statewide Search | Texas Homeland Security | Site Policies |