 |
| |
| |
| |
| |
| |
| |
|

| TissGeneSummary for SLC2A12 |
 Gene summary Gene summary |
| Basic gene information | Gene symbol | SLC2A12 |
| Gene name | solute carrier family 2 (facilitated glucose transporter), member 12 | |
| Synonyms | GLUT12|GLUT8 | |
| Cytomap | UCSC genome browser: 6q23.2 | |
| Type of gene | protein-coding | |
| RefGenes | NM_145176.2, | |
| Description | GLUT-12glucose transporter type 12solute carrier family 2, facilitated glucose transporter member 12 | |
| Modification date | 20141207 | |
| dbXrefs | MIM : 610372 | |
| HGNC : HGNC | ||
| HPRD : 11572 | ||
| Protein | UniProt: go to UniProt's Cross Reference DB Table | |
| Expression | CleanEX: HS_SLC2A12 | |
| BioGPS: 154091 | ||
| Pathway | NCI Pathway Interaction Database: SLC2A12 | |
| KEGG: SLC2A12 | ||
| REACTOME: SLC2A12 | ||
| Pathway Commons: SLC2A12 | ||
| Context | iHOP: SLC2A12 | |
| ligand binding site mutation search in PubMed: SLC2A12 | ||
| UCL Cancer Institute: SLC2A12 | ||
| Assigned class in TissGDB* | C | |
| Included tissue-specific gene expression resources | TiGER,GTEx | |
| Specific-tissues in normal samples (assigned by TissGDB using HPA, TiGER, and GTEx) | ProstateStomach | |
| Cancer types related to the specific-tissues in cancer samples (assigned by TissGDB using TCGA) | PRADSTAD | |
| Reference showing the relevant tissue of SLC2A12 | ||
| Description by TissGene annotations | Have significant anti-correlated miRNA Fused withOncogene | |
| * Class A consists of genes with literature evidence and is part of the cTissGenes. Class B consists of only cTissGenes without additional evidence. The remaining genes belong to Class C. |
| Gene ontology having evidence of Inferred from Direct Assay (IDA) from Entrez |
| GO ID | GO term | PubMed ID |
| Top |
| TissGeneExp for SLC2A12 |
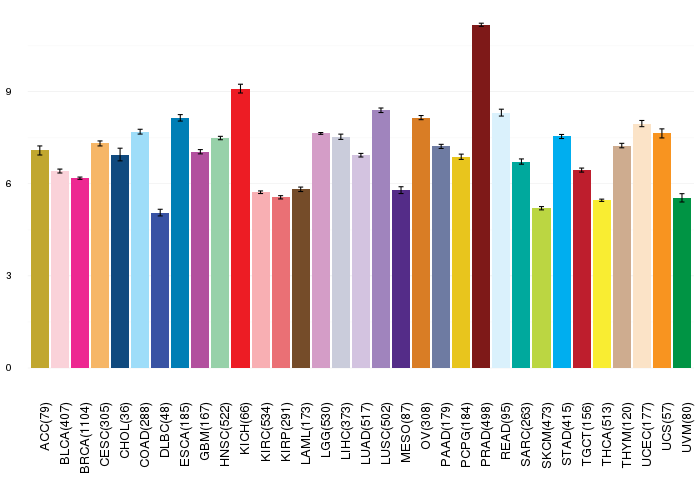
| Gene expressions across 28 cancer types (X-axis: cancer type and Y-axis: log2(norm_counts+1)) (TCGA IlluminaHiSeq_RNASeqV2, pan-cancer normalized log2(norm_counts+1) data, version 2016-08-16) |
 |
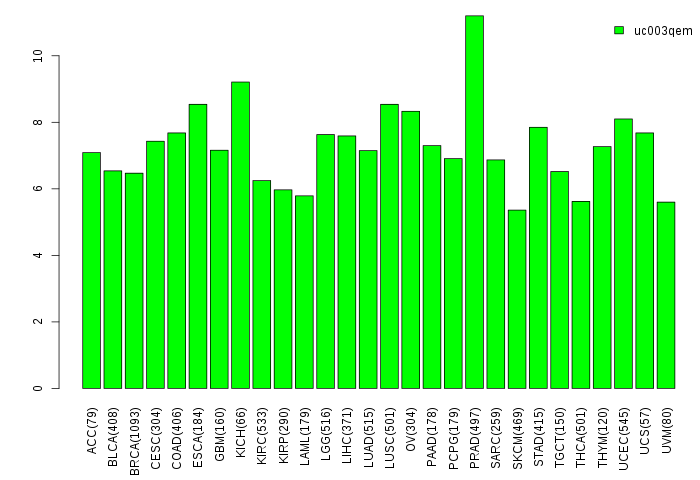
| Gene isoform expressions across 28 cancer types (X-axis: cancer type and Y-axis: log2(norm_counts+1)) (TCGA pan-cancer tcga_rsem_isoform_tpm, version 2016-09-01) |
 |
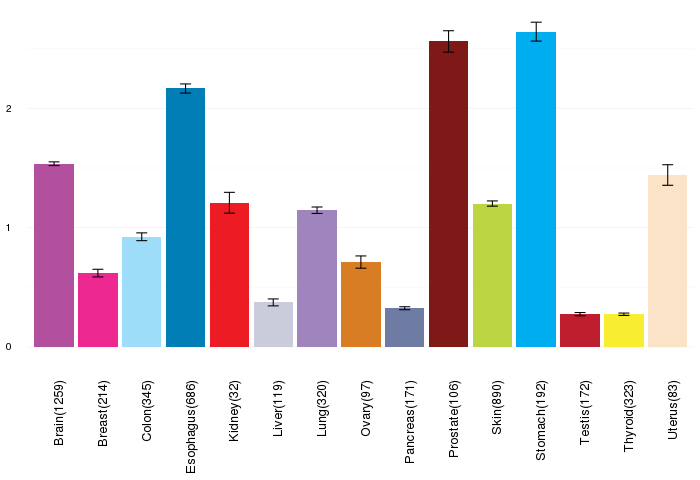
| Gene expressions across normal tissues of GTEx data (GTEx GTEx_Analysis_v6_RNA-seq_RNA-SeQCv1.1.8_gene_rpkm.gct) - Here, we shows the matched tissue types only among our 28 cancer types. |
 |
| Different expressions across 14 cancer types with more than 10 samples between matched tumors and normals (X-axis: cancer type and Y-axis: log2(norm_counts+1)) (TCGA IlluminaHiSeq_RNASeqV2, pan-cancer normalized log2(norm_counts+1) data, version 2016-08-16) |
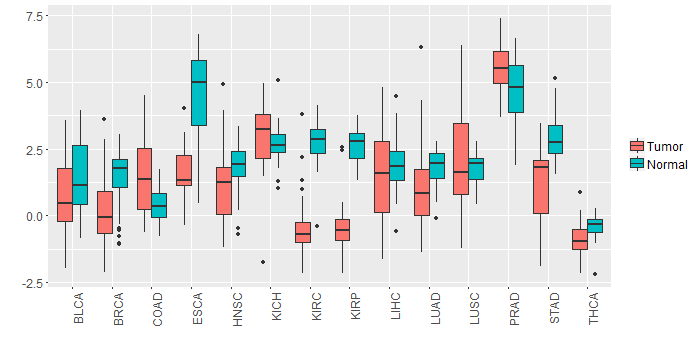 |
| - Significantly differentially expressed cancer types and information. (|Fold change|>1 and FDR<0.05) |
| Cancer type | Mean(exp) in tumor | Mean(exp) in matched normal | Log2FC | P-val. | FDR |
| STAD | 1.281268726 | 2.930621851 | -1.649353125 | 2.98E-07 | 6.44E-06 |
| KIRP | -0.434281274 | 2.634981226 | -3.0692625 | 4.33E-20 | 2.77E-18 |
| KIRC | -0.534240996 | 2.803774282 | -3.338015278 | 1.64E-53 | 2.64E-51 |
| BRCA | 0.105491095 | 1.486631445 | -1.381140351 | 3.10E-19 | 2.09E-18 |
| ESCA | 1.695784635 | 4.495002817 | -2.799218182 | 0.00137 | 0.017922824 |
| COAD | 1.439462957 | 0.385655265 | 1.053807692 | 0.0016 | 0.004387484 |
| Top |
| TissGene-miRNA for SLC2A12 |
| Significantly anti-correlated miRNAs of TissGene across 28 cancer types (Gene-miRNA relations from TargetScanHuman Relsease 7.1, Conserved_Site_Context_Scores.txt.zip, 06.01.2016) (TCGA IlluminaHiSeq_miRNASeq, log2(RPM+1) data, version 2016-11-21) (TCGA IlluminaHiSeq_RNASeqV2, log2(normalized_count+1) data, version 2016-08-16) (Spearman’s Rank Correlation (p-value<0.05 and coefficient<-0.25)) |
| Cancer type | miRNA id | miRNA accession | P-val. | Coeff. | # samples |
| UCS | hsa-let-7i-5p | MIMAT0000415 | 0.049 | -0.27 | 56 |
| UCS | hsa-miR-98-5p | MIMAT0000096 | 0.047 | -0.27 | 56 |
| UCS | hsa-let-7f-5p | MIMAT0000067 | 0.022 | -0.31 | 56 |
| LUSC | hsa-miR-22-3p | MIMAT0000077 | 0.0003 | -0.32 | 128 |
| UCS | hsa-let-7e-5p | MIMAT0000066 | 0.012 | -0.33 | 56 |
| UCS | hsa-let-7c-5p | MIMAT0000064 | 0.003 | -0.39 | 56 |
| Top |
| TissGeneMut for SLC2A12 |
| TissGeneSNV for SLC2A12 |
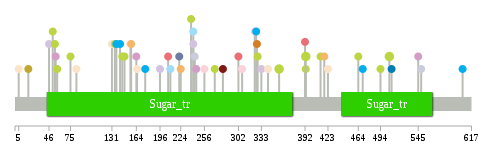
| nsSNV counts per each loci. Different colors of circles represent different cancer types. Circle size denotes number of samples. (TCGA somatic mutation (SNPs and small INDELs) data, version 2016-04-25) * Click on the image to enlarge it in a new window. |
 |
 |
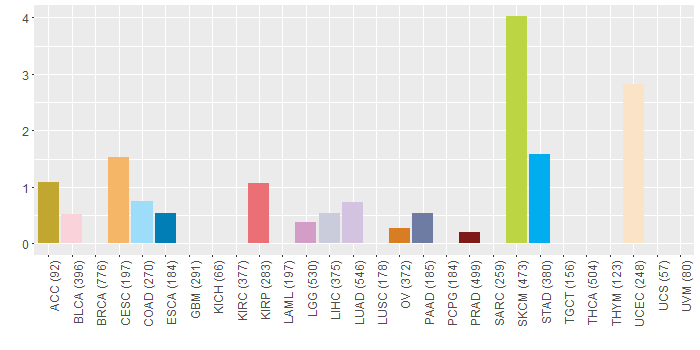
| Somatic nucleotide variants of TissGene across 28 cancer types (X-axis: cancer type and Y-axis: % of mutated samples) The numbers in parentheses are numbers of samples with mutation (nsSNVs). (TCGA somatic mutation (SNPs and small INDELs) data, version 2016-04-25) |
 |
| - nsSNVs sorted by frequency. |
| AAchange | Cancer type | # samples |
| p.G393R | SKCM | 2 |
| p.M506I | SKCM | 2 |
| p.S357L | SKCM | 2 |
| p.W196C | HNSC | 1 |
| p.L243V | LIHC | 1 |
| p.D267G | HNSC | 1 |
| p.I281M | PRAD | 1 |
| p.V328I | SKCM | 1 |
| p.K327N | OV | 1 |
| p.V326I | STAD | 1 |
| p.G393E | SKCM | 1 |
| p.V545I | LGG | 1 |
| p.G51S | SKCM | 1 |
| p.G55A | LGG | 1 |
| p.G207V | KIRP | 1 |
| p.V176A | STAD | 1 |
| p.S256F | BLCA | 1 |
| p.P333L | LUAD | 1 |
| p.G509S | ESCA | 1 |
| p.R423K | UCEC | 1 |
| p.S302L | KIRP | 1 |
| p.V83M | UCEC | 1 |
| p.G238R | SKCM | 1 |
| p.R164I | LGG | 1 |
| p.G165A | UCEC | 1 |
| p.W196* | LUAD | 1 |
| p.S307* | BLCA | 1 |
| p.P221R | HNSC | 1 |
| p.C605R | STAD | 1 |
| p.L224M | CESC | 1 |
| p.T131M | UCEC | 1 |
| p.Q590E | HNSC | 1 |
| p.R270C | SKCM | 1 |
| p.S464F | SKCM | 1 |
| p.Y392F | KIRP | 1 |
| p.V135G | SKCM | 1 |
| p.D102N | HNSC | 1 |
| p.T18S | ACC | 1 |
| p.D245Y | LGG | 1 |
| p.G324* | BLCA | 1 |
| p.E157D | CESC | 1 |
| p.R241G | LUAD | 1 |
| p.E57K | SKCM | 1 |
| p.V450I | READ | 1 |
| p.A440V | HNSC | 1 |
| p.A156T | UCEC | 1 |
| p.V470I | STAD | 1 |
| p.C555* | HNSC | 1 |
| p.S148F | SKCM | 1 |
| p.G342S | UCEC | 1 |
| p.I549L | LIHC | 1 |
| p.R222Q | PAAD | 1 |
| p.V54M | SKCM | 1 |
| p.S413F | SKCM | 1 |
| p.Q210R | COAD | 1 |
| p.G494E | SKCM | 1 |
| p.V142I | STAD | 1 |
| p.R241K | COAD | 1 |
| p.S75N | SKCM | 1 |
| p.E5G | UCEC | 1 |
| p.T46S | LUAD | 1 |
| p.S418* | CESC | 1 |
| p.S145F | SKCM | 1 |
| p.R137C | STAD | 1 |
| Top |
| TissGeneCNV for SLC2A12 |
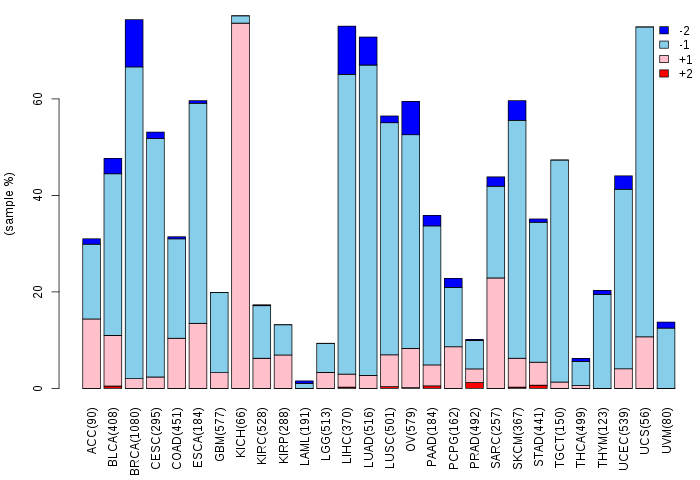
| Copy number variations of TissGene across 28 cancer types (X-axis: cancer type and Y-axis: % of CNV samples) (TCGA Gistic2_CopyNumber_Gistic2_all_data_by_genes, Gistic2 copy number data, version 2016-08-16) |
 |
| Top |
| TissGeneFusions for SLC2A12 |
| Fusion genes including TissGene (ChimerDB 3.0, 2016-12-01 and TCGA fusion Portal 2015-12-01) |
| Database | Src | Cancer type | Sample | Fusion gene | ORF | 5'-gene BP | 3'-gene BP |
| Chimerdb3.0 | ChiTaRs | NA | AA665574 | SLC2A12-ZNF236 | chr6:134311343 | chr18:74624220 | |
| Chimerdb3.0 | FusionScan | ESCA | TCGA-JY-A938-01A | SLC2A12-SAMD3 | CDS-5'UTR | chr6:134373515 | chr6:130634238 |
| TCGAfusionPortal | PRADA | HNSC | TCGA-BA-4078-01A | SLC2A12-SGK1 | Out-of-frame | Chr6:134373516 | Chr6:134583286 |
| Top |
| TissGeneNet for SLC2A12 |
| Co-expressed gene networks based on protein-protein interaction data (CePIN) (TCGA IlluminaHiSeq_RNASeqV2, pan-cancer normalized log2(norm_counts+1) data, version 2016-08-16) (PINA2 ppi data) |
| Top |
| TissGeneProg for SLC2A12 |
| Kaplan-Meier plots with logrank tests of overall survival (OS) using 28 cancer types (TCGA IlluminaHiSeq_RNASeqV2, pan-cancer normalized log2(norm_counts+1) data, version 2016-08-16) (TCGA clinicalMatrix, phenotype data, version 2016-04-27) * Click on the image to enlarge it in a new window. |
 |
| Kaplan-Meier plots with logrank test of relapse free survival (RFS) using 28 cancer types (TCGA IlluminaHiSeq_RNASeqV2, pan-cancer normalized log2(norm_counts+1) data, version 2016-08-16) (TCGA clinicalMatrix, phenotype data, version 2016-04-27) * Click on the image enlarge it in a new window. |
 |
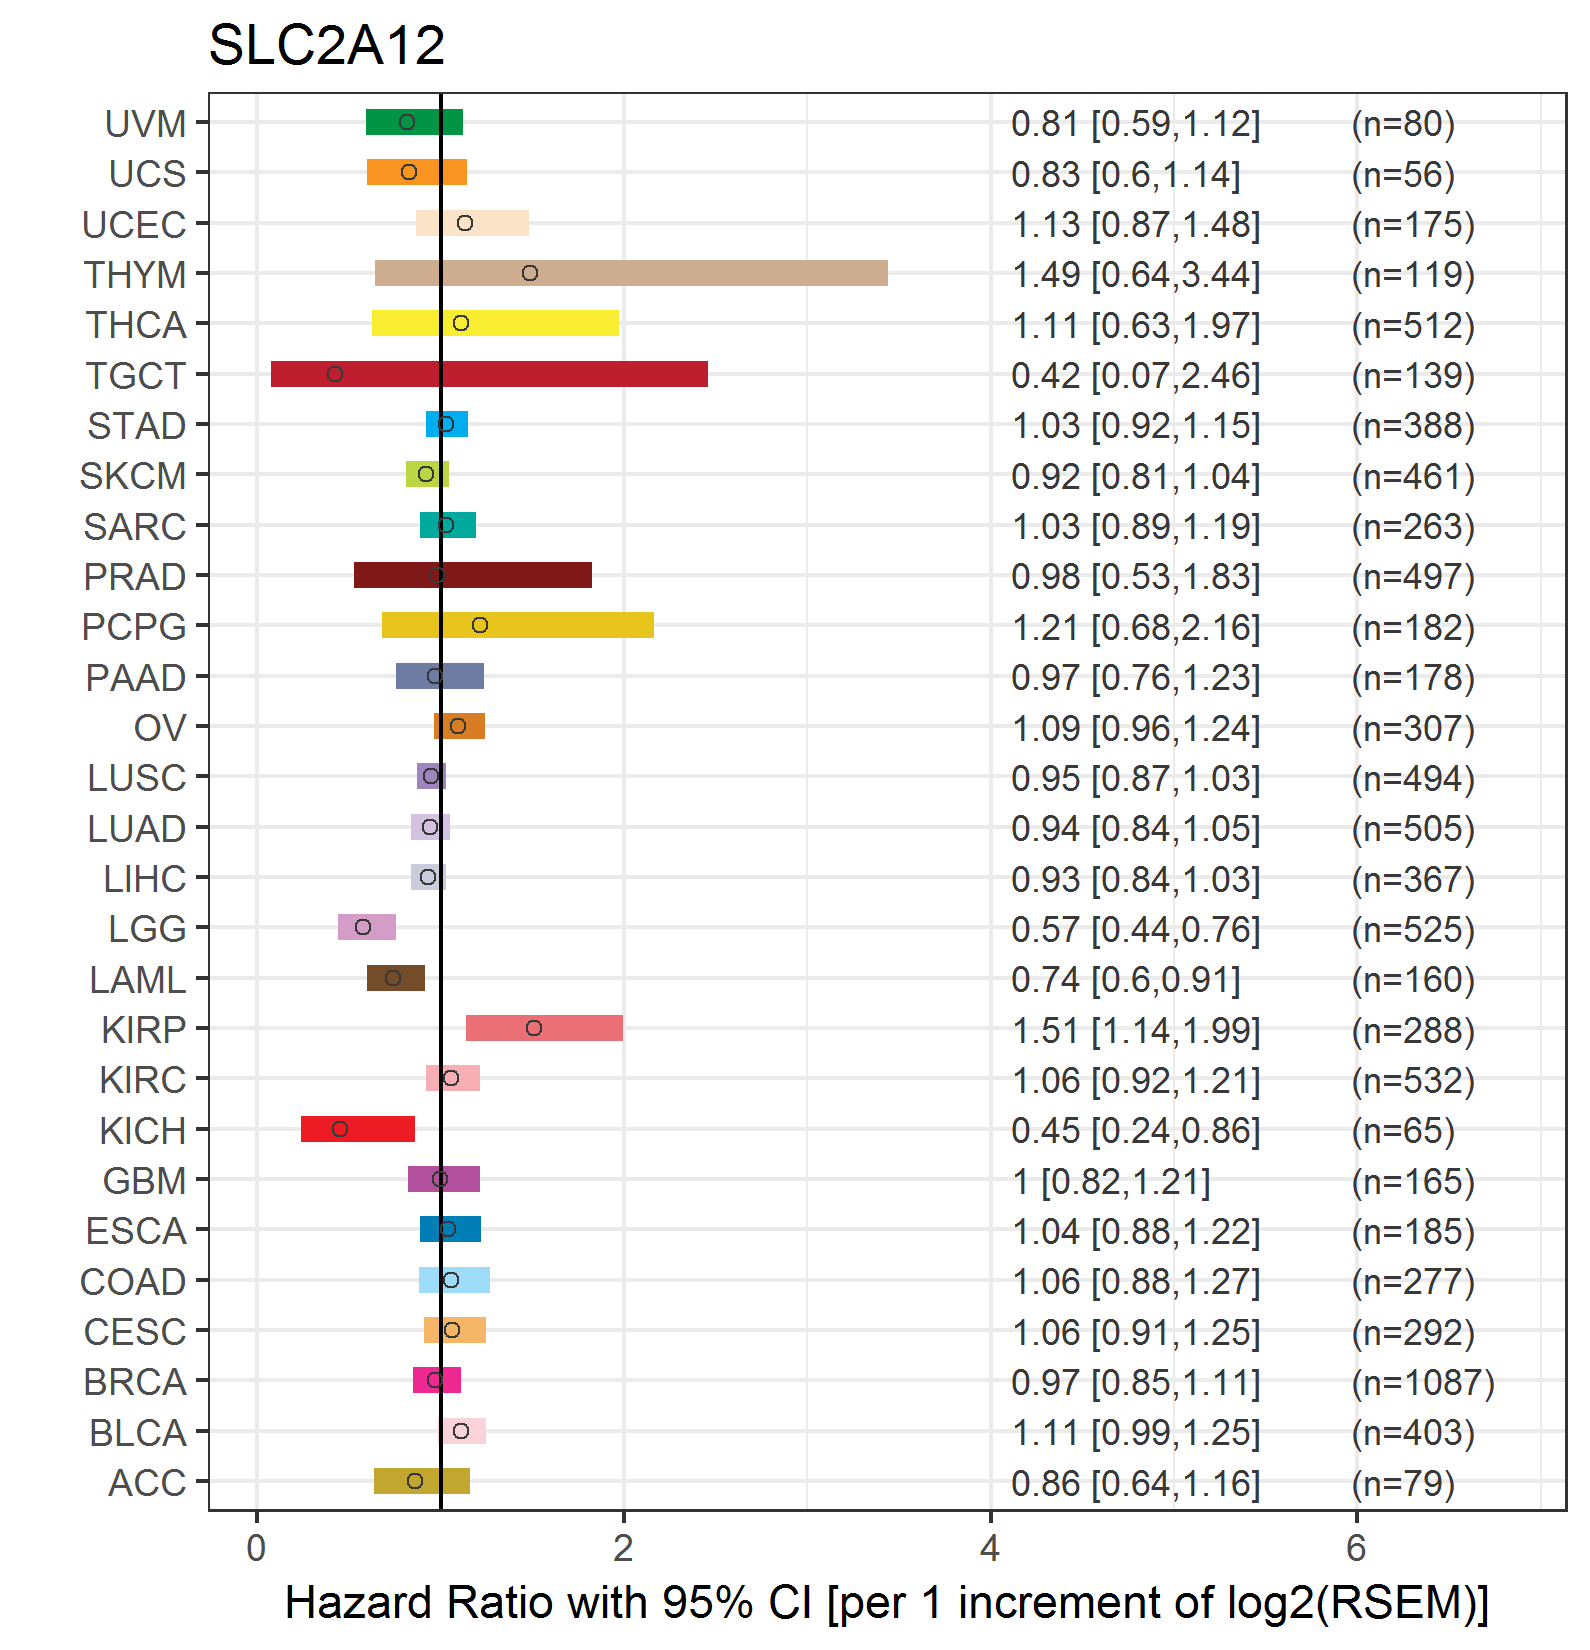
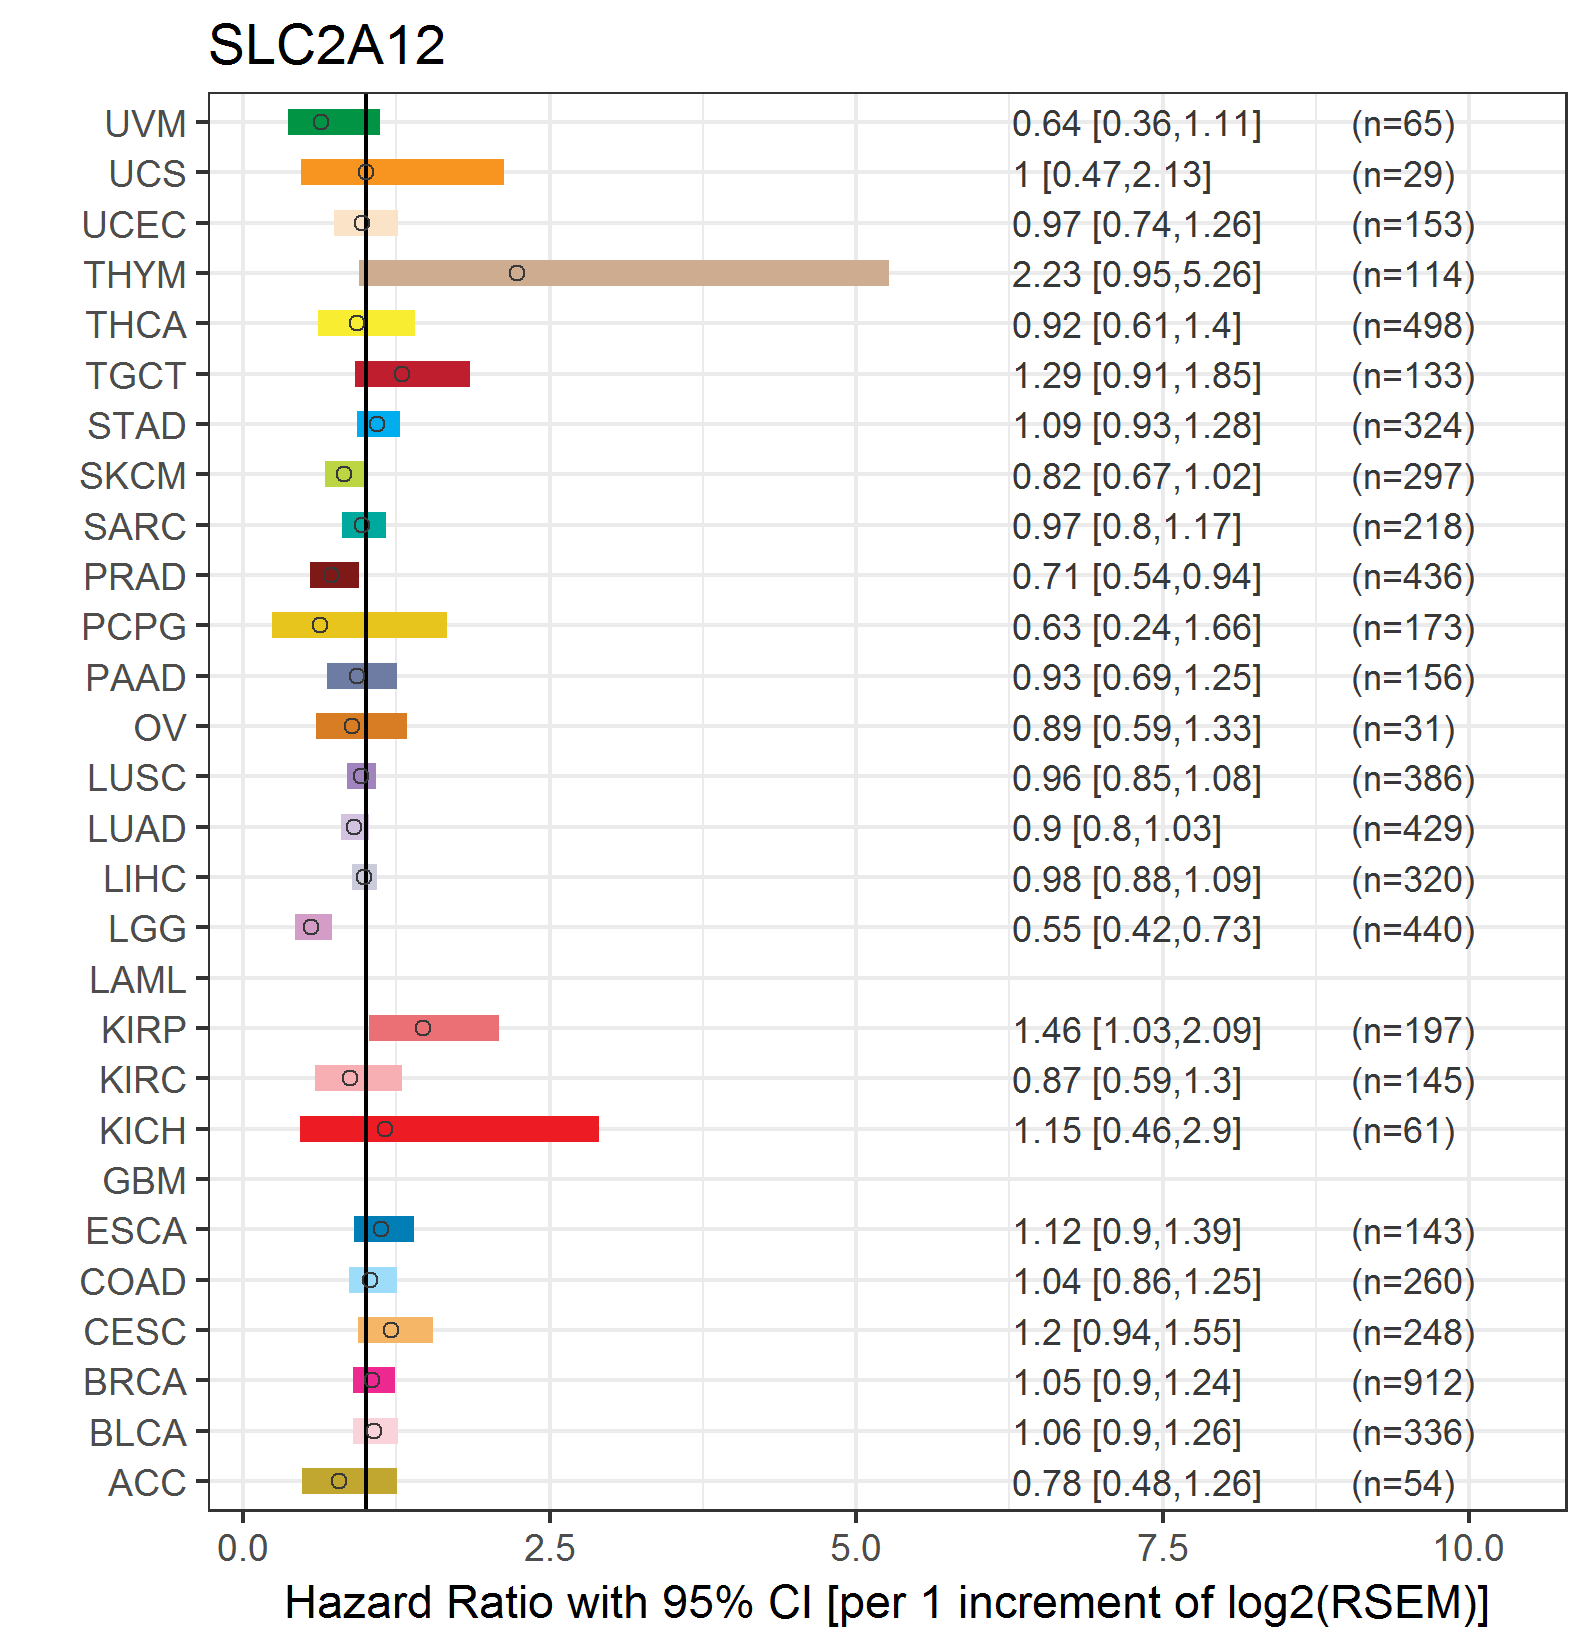
| Forest plot of Cox proportional hazard ratio (HR) and 95% CI of overall survival (OS) using 28 cancer types (TCGA IlluminaHiSeq_RNASeqV2, pan-cancer normalized log2(norm_counts+1) data, version 2016-08-16) (TCGA clinicalMatrix, phenotype data, version 2016-04-27) * Click on the image enlarge it in a new window. |
 |
| Forest plot of Cox proportional hazard ratio (HR) and 95% CI of relapse free survival (RFS) using 28 cancer types (TCGA IlluminaHiSeq_RNASeqV2, pan-cancer normalized log2(norm_counts+1) data, version 2016-08-16) (TCGA clinicalMatrix, phenotype data, version 2016-04-27) * Click on the image enlarge it in a new window. |
 |
| Top |
| TissGeneClin for SLC2A12 |
| TissGeneDrug for SLC2A12 |
| Drug information targeting TissGene (DrugBank Version 5.0.6, 2017-04-01) |
| DrugBank ID | Drug name | Drug activity | Drug type | Drug status |
| Top |
| TissGeneDisease for SLC2A12 |
| Disease information associated with TissGene (DisGeNet, 2016-06-01) |
| Disease ID | Disease name | # pubmeds | Source |
| umls:C0006142 | Malignant neoplasm of breast | 2 | BeFree |
| umls:C0678222 | Breast Carcinoma | 2 | BeFree |
| umls:C0011881 | Diabetic Nephropathy | 1 | LHGDN |
| umls:C0020538 | Hypertensive disease | 1 | LHGDN |
| umls:C0026764 | Multiple Myeloma | 1 | BeFree |
| umls:C0376358 | Malignant neoplasm of prostate | 1 | BeFree |
| umls:C0600139 | Prostate carcinoma | 1 | BeFree |
|
Copyright 2016-Present - The University of Texas Health Science Center at Houston (UTHealth) Web File Viewing | How to Report, Fraud, Waste and Abuse | State of Texas | Statewide Search | Texas Homeland Security | Site Policies |