 |
| |
| |
| |
| |
| |
| |
|

| TissGeneSummary for CYP2A7 |
 Gene summary Gene summary |
| Basic gene information | Gene symbol | CYP2A7 |
| Gene name | cytochrome P450, family 2, subfamily A, polypeptide 6 | |
| Synonyms | CPA6|CYP2A|CYP2A3|CYPIIA6|P450C2A|P450PB | |
| Cytomap | UCSC genome browser: 19q13.2 | |
| Type of gene | protein-coding | |
| RefGenes | NM_000762.5, | |
| Description | 1,4-cineole 2-exo-monooxygenasecoumarin 7-hydroxylasecytochrome P450 2A6cytochrome P450 IIA3cytochrome P450(I)cytochrome P450, subfamily IIA (phenobarbital-inducible), polypeptide 6flavoprotein-linked monooxygenasexenobiotic monooxygenase | |
| Modification date | 20141207 | |
| dbXrefs | MIM : 122720 | |
| HGNC : HGNC | ||
| Ensembl : ENSG00000255974 | ||
| HPRD : 00420 | ||
| Vega : OTTHUMG00000182713 | ||
| Protein | UniProt: go to UniProt's Cross Reference DB Table | |
| Expression | CleanEX: HS_CYP2A7 | |
| BioGPS: 1548 | ||
| Pathway | NCI Pathway Interaction Database: CYP2A7 | |
| KEGG: CYP2A7 | ||
| REACTOME: CYP2A7 | ||
| Pathway Commons: CYP2A7 | ||
| Context | iHOP: CYP2A7 | |
| ligand binding site mutation search in PubMed: CYP2A7 | ||
| UCL Cancer Institute: CYP2A7 | ||
| Assigned class in TissGDB* | A | |
| Included tissue-specific gene expression resources | HPA,TiGER,GTEx | |
| Specific-tissues in normal samples (assigned by TissGDB using HPA, TiGER, and GTEx) | Liver | |
| Cancer types related to the specific-tissues in cancer samples (assigned by TissGDB using TCGA) | LIHC | |
| Reference showing the relevant tissue of CYP2A7 | Expression and alternative splicing of the cytochrome P-450 CYP2A7. Ding S, Lake BG, Friedberg T, Wolf CR. Biochem J. 1995 Feb 15;306 ( Pt 1):161-6. (pmid:7864805) go to article | |
| Description by TissGene annotations | TissgsKTS | |
| * Class A consists of genes with literature evidence and is part of the cTissGenes. Class B consists of only cTissGenes without additional evidence. The remaining genes belong to Class C. |
| Gene ontology having evidence of Inferred from Direct Assay (IDA) from Entrez |
| GO ID | GO term | PubMed ID | GO:0009804 | coumarin metabolic process | 19651758 | GO:0017144 | drug metabolic process | 19651758 | GO:0042738 | exogenous drug catabolic process | 15680923 | GO:0046226 | coumarin catabolic process | 19029318 | GO:0009804 | coumarin metabolic process | 19651758 | GO:0017144 | drug metabolic process | 19651758 | GO:0042738 | exogenous drug catabolic process | 15680923 | GO:0046226 | coumarin catabolic process | 19029318 |
| Top |
| TissGeneExp for CYP2A7 |
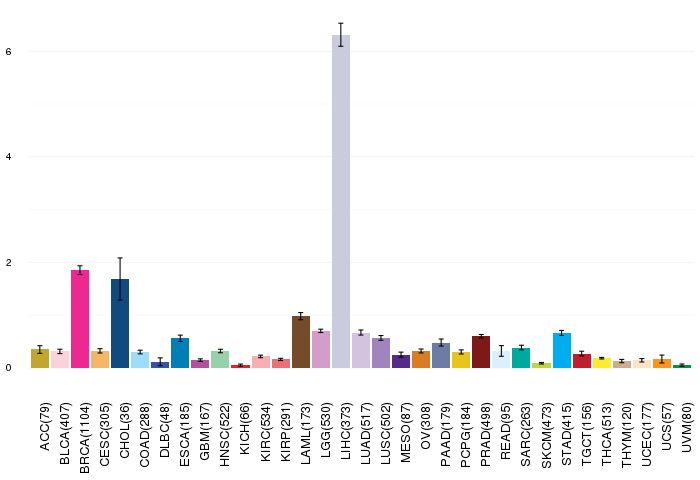
| Gene expressions across 28 cancer types (X-axis: cancer type and Y-axis: log2(norm_counts+1)) (TCGA IlluminaHiSeq_RNASeqV2, pan-cancer normalized log2(norm_counts+1) data, version 2016-08-16) |
 |
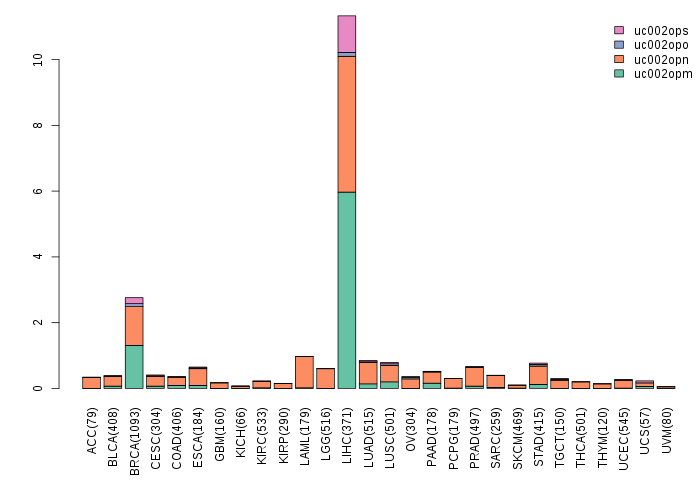
| Gene isoform expressions across 28 cancer types (X-axis: cancer type and Y-axis: log2(norm_counts+1)) (TCGA pan-cancer tcga_rsem_isoform_tpm, version 2016-09-01) |
 |
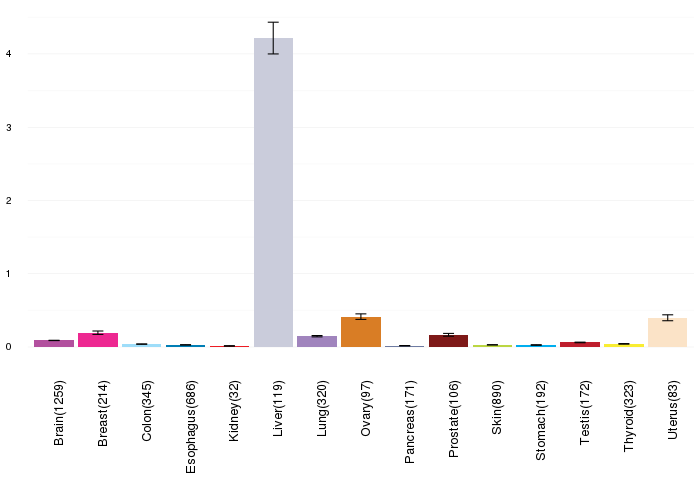
| Gene expressions across normal tissues of GTEx data (GTEx GTEx_Analysis_v6_RNA-seq_RNA-SeQCv1.1.8_gene_rpkm.gct) - Here, we shows the matched tissue types only among our 28 cancer types. |
 |
| Different expressions across 14 cancer types with more than 10 samples between matched tumors and normals (X-axis: cancer type and Y-axis: log2(norm_counts+1)) (TCGA IlluminaHiSeq_RNASeqV2, pan-cancer normalized log2(norm_counts+1) data, version 2016-08-16) |
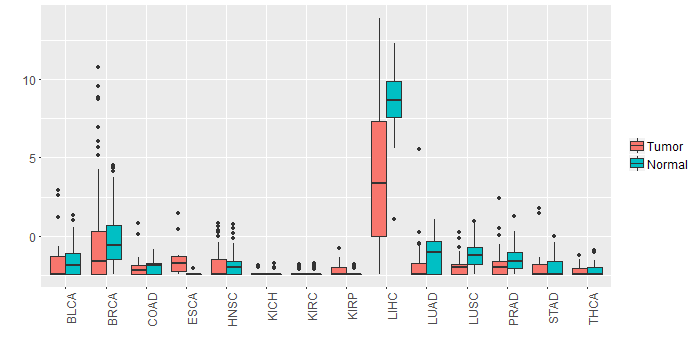 |
| - Significantly differentially expressed cancer types and information. (|Fold change|>1 and FDR<0.05) |
| Cancer type | Mean(exp) in tumor | Mean(exp) in matched normal | Log2FC | P-val. | FDR |
| LIHC | 3.967748052 | 8.508594052 | -4.540846 | 1.90E-08 | 1.58E-07 |
| Top |
| TissGene-miRNA for CYP2A7 |
| Significantly anti-correlated miRNAs of TissGene across 28 cancer types (Gene-miRNA relations from TargetScanHuman Relsease 7.1, Conserved_Site_Context_Scores.txt.zip, 06.01.2016) (TCGA IlluminaHiSeq_miRNASeq, log2(RPM+1) data, version 2016-11-21) (TCGA IlluminaHiSeq_RNASeqV2, log2(normalized_count+1) data, version 2016-08-16) (Spearman’s Rank Correlation (p-value<0.05 and coefficient<-0.25)) |
| Cancer type | miRNA id | miRNA accession | P-val. | Coeff. | # samples |
| Top |
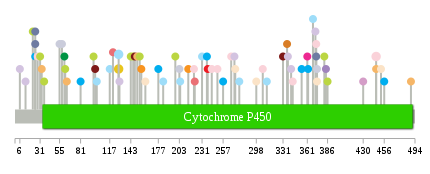
| TissGeneMut for CYP2A7 |
| TissGeneSNV for CYP2A7 |
| nsSNV counts per each loci. Different colors of circles represent different cancer types. Circle size denotes number of samples. (TCGA somatic mutation (SNPs and small INDELs) data, version 2016-04-25) * Click on the image to enlarge it in a new window. |
 |
 |
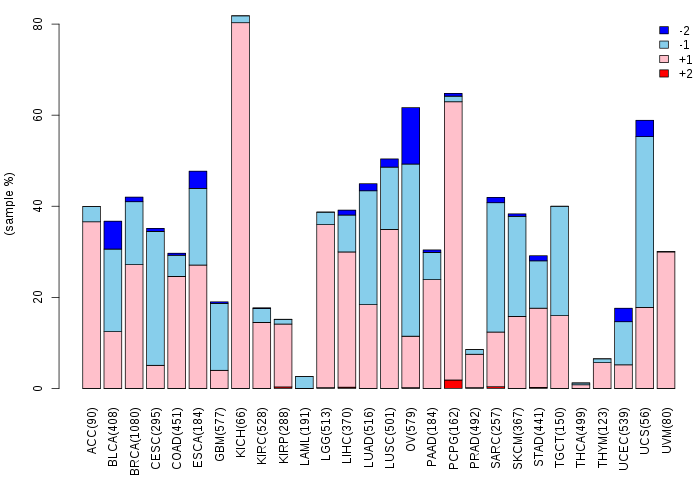
| Somatic nucleotide variants of TissGene across 28 cancer types (X-axis: cancer type and Y-axis: % of mutated samples) The numbers in parentheses are numbers of samples with mutation (nsSNVs). (TCGA somatic mutation (SNPs and small INDELs) data, version 2016-04-25) |
 |
| - nsSNVs sorted by frequency. |
| AAchange | Cancer type | # samples |
| p.R446K | BLCA | 2 |
| p.L128R | COAD | 2 |
| p.L128R | PCPG | 2 |
| p.R373S | LIHC | 1 |
| p.E63V | HNSC | 1 |
| p.F343L | BLCA | 1 |
| p.R361G | BRCA | 1 |
| p.K337N | LUAD | 1 |
| p.F362Y | STAD | 1 |
| p.F384L | LUSC | 1 |
| p.G31E | SKCM | 1 |
| p.R143Q | SKCM | 1 |
| p.M204V | COAD | 1 |
| p.T305M | READ | 1 |
| p.M368T | COAD | 1 |
| p.G36R | SKCM | 1 |
| p.L33V | CESC | 1 |
| p.S183T | COAD | 1 |
| p.P341H | LUAD | 1 |
| p.R446K | HNSC | 1 |
| p.E277D | COAD | 1 |
| p.F452L | UCEC | 1 |
| p.L272I | UCEC | 1 |
| p.F238Y | KICH | 1 |
| p.F267L | BLCA | 1 |
| p.E146K | SKCM | 1 |
| p.R257H | STAD | 1 |
| p.M222I | KIRP | 1 |
| p.F198L | SKCM | 1 |
| p.R446K | CESC | 1 |
| p.G121W | KIRP | 1 |
| p.R372C | BLCA | 1 |
| p.S62F | SKCM | 1 |
| p.E221Q | BLCA | 1 |
| p.P231S | COAD | 1 |
| p.V306G | BLCA | 1 |
| p.K250N | BLCA | 1 |
| p.L156I | UCS | 1 |
| p.R311C | COAD | 1 |
| p.A13V | LUAD | 1 |
| p.A117V | COAD | 1 |
| p.I331T | PRAD | 1 |
| p.C55S | LIHC | 1 |
| p.V456I | STAD | 1 |
| p.I58T | LIHC | 1 |
| p.A371S | LUAD | 1 |
| p.S22F | SKCM | 1 |
| p.D382N | SKCM | 1 |
| p.D108H | HNSC | 1 |
| p.P386S | SKCM | 1 |
| p.F61I | UVM | 1 |
| p.R161Q | UCEC | 1 |
| p.A354V | STAD | 1 |
| p.R101X | COAD | 1 |
| p.L298I | UCEC | 1 |
| p.F271L | LUAD | 1 |
| p.G336A | OV | 1 |
| p.L81V | STAD | 1 |
| p.T214A | UCS | 1 |
| p.E151K | CESC | 1 |
| p.Q25* | PAAD | 1 |
| p.Q25K | STAD | 1 |
| p.L6M | LUAD | 1 |
| p.G243R | BLCA | 1 |
| p.V430A | LGG | 1 |
| p.G154S | SKCM | 1 |
| p.R373M | UCEC | 1 |
| p.A237T | STAD | 1 |
| p.M489I | CESC | 1 |
| p.Q25X | PAAD | 1 |
| p.S99R | PRAD | 1 |
| p.T177A | STAD | 1 |
| p.E97K | SKCM | 1 |
| p.S203R | LIHC | 1 |
| p.S64L | CESC | 1 |
| p.R372C | PAAD | 1 |
| p.K28N | BLCA | 1 |
| p.R148C | PRAD | 1 |
| p.R129L | LUAD | 1 |
| Top |
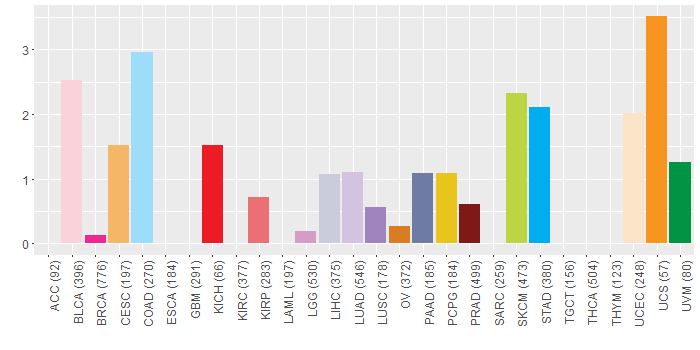
| TissGeneCNV for CYP2A7 |
| Copy number variations of TissGene across 28 cancer types (X-axis: cancer type and Y-axis: % of CNV samples) (TCGA Gistic2_CopyNumber_Gistic2_all_data_by_genes, Gistic2 copy number data, version 2016-08-16) |
 |
| Top |
| TissGeneFusions for CYP2A7 |
| Fusion genes including TissGene (ChimerDB 3.0, 2016-12-01 and TCGA fusion Portal 2015-12-01) |
| Database | Src | Cancer type | Sample | Fusion gene | ORF | 5'-gene BP | 3'-gene BP |
| Chimerdb3.0 | FusionScan | BRCA | TCGA-A7-A26I-01B | CLPTM1-CYP2A7 | Out-of-Frame | chr19:45488561 | chr19:41386533 |
| TCGAfusionPortal | PRADA | BRCA | TCGA-A7-A26I-01A | CLPTM1-CYP2A7 | Out-of-frame | Chr19:45488561 | Chr19:41386533 |
| Top |
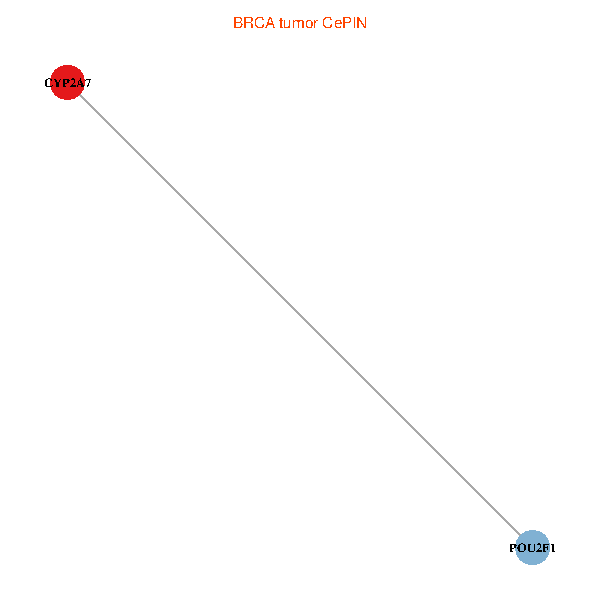
| TissGeneNet for CYP2A7 |
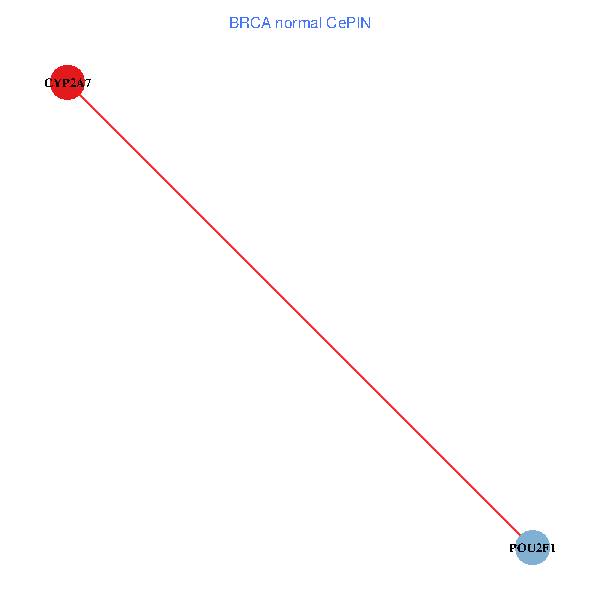
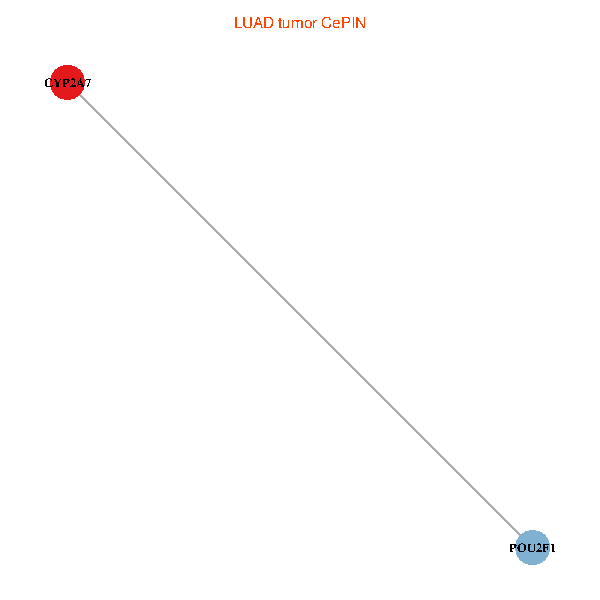
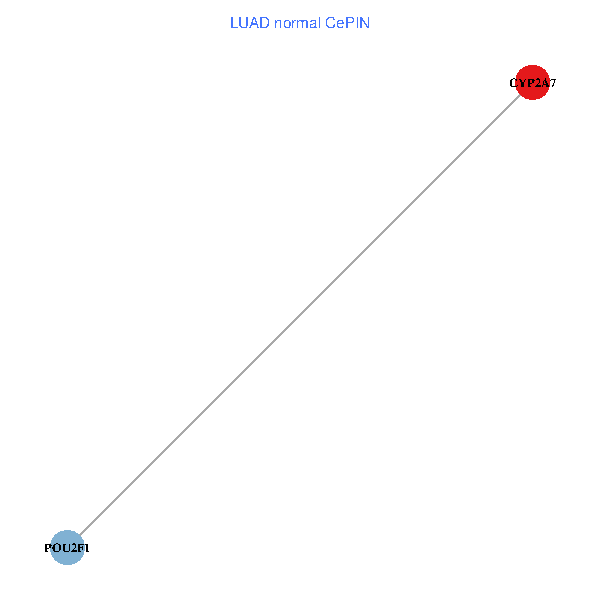
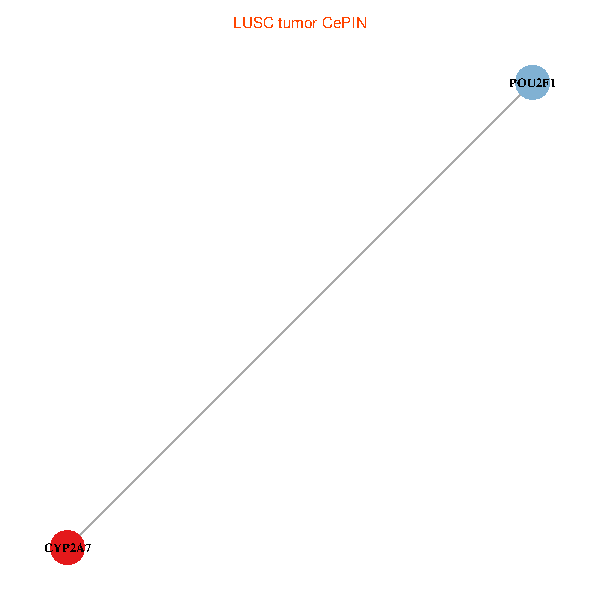
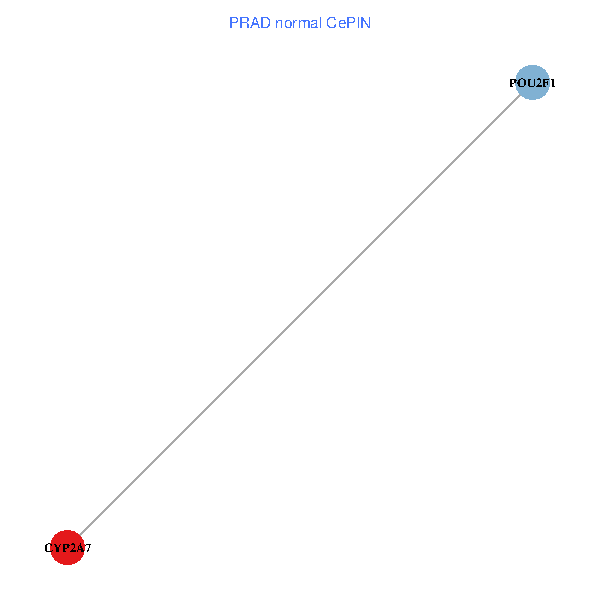
| Co-expressed gene networks based on protein-protein interaction data (CePIN) (TCGA IlluminaHiSeq_RNASeqV2, pan-cancer normalized log2(norm_counts+1) data, version 2016-08-16) (PINA2 ppi data) |
| BRCA (tumor) | BRCA (normal) |
| CYP2A7, POU2F1 (tumor) | CYP2A7, POU2F1 (normal) |
 |  |
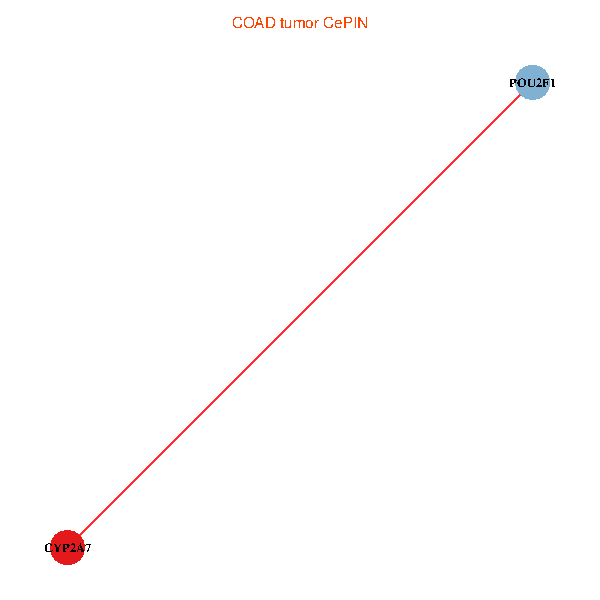
| COAD (tumor) | COAD (normal) |
| CYP2A7, POU2F1 (tumor) | CYP2A7, POU2F1 (normal) |
 |  |
| HNSC (tumor) | HNSC (normal) |
| CYP2A7, POU2F1 (tumor) | CYP2A7, POU2F1 (normal) |
 |  |
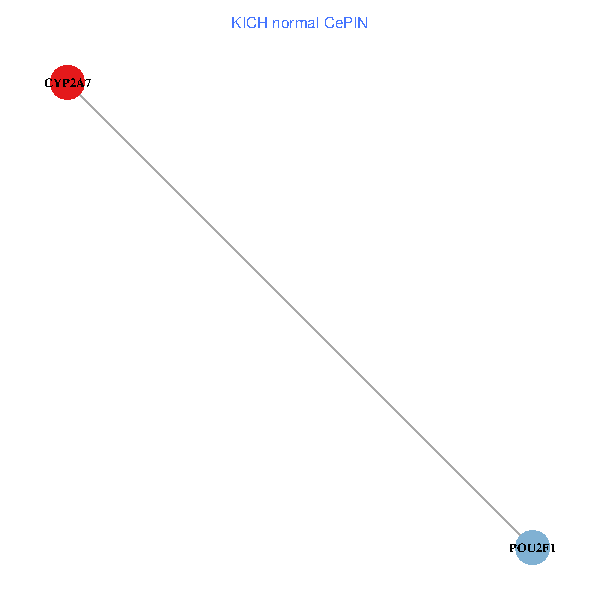
| KICH (tumor) | KICH (normal) |
| CYP2A7, POU2F1 (tumor) | CYP2A7, POU2F1 (normal) |
 |  |
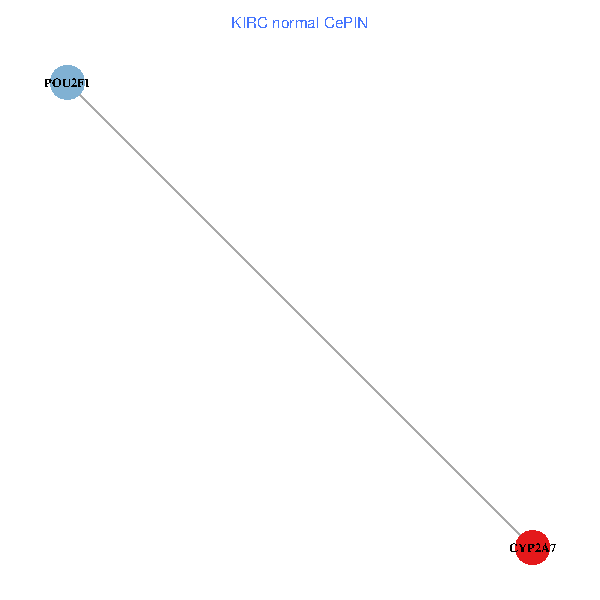
| KIRC (tumor) | KIRC (normal) |
| CYP2A7, POU2F1 (tumor) | CYP2A7, POU2F1 (normal) |
 |  |
| KIRP (tumor) | KIRP (normal) |
| CYP2A7, POU2F1 (tumor) | CYP2A7, POU2F1 (normal) |
 |  |
| LIHC (tumor) | LIHC (normal) |
| CYP2A7, POU2F1 (tumor) | CYP2A7, POU2F1 (normal) |
 |  |
| LUAD (tumor) | LUAD (normal) |
| CYP2A7, POU2F1 (tumor) | CYP2A7, POU2F1 (normal) |
 |  |
| LUSC (tumor) | LUSC (normal) |
| CYP2A7, POU2F1 (tumor) | CYP2A7, POU2F1 (normal) |
 |  |
| PRAD (tumor) | PRAD (normal) |
| CYP2A7, POU2F1 (tumor) | CYP2A7, POU2F1 (normal) |
 |  |
| STAD (tumor) | STAD (normal) |
| CYP2A7, POU2F1 (tumor) | CYP2A7, POU2F1 (normal) |
 |  |
| THCA (tumor) | THCA (normal) |
| CYP2A7, POU2F1 (tumor) | CYP2A7, POU2F1 (normal) |
 |  |
| Top |
| TissGeneProg for CYP2A7 |
| Kaplan-Meier plots with logrank tests of overall survival (OS) using 28 cancer types (TCGA IlluminaHiSeq_RNASeqV2, pan-cancer normalized log2(norm_counts+1) data, version 2016-08-16) (TCGA clinicalMatrix, phenotype data, version 2016-04-27) * Click on the image to enlarge it in a new window. |
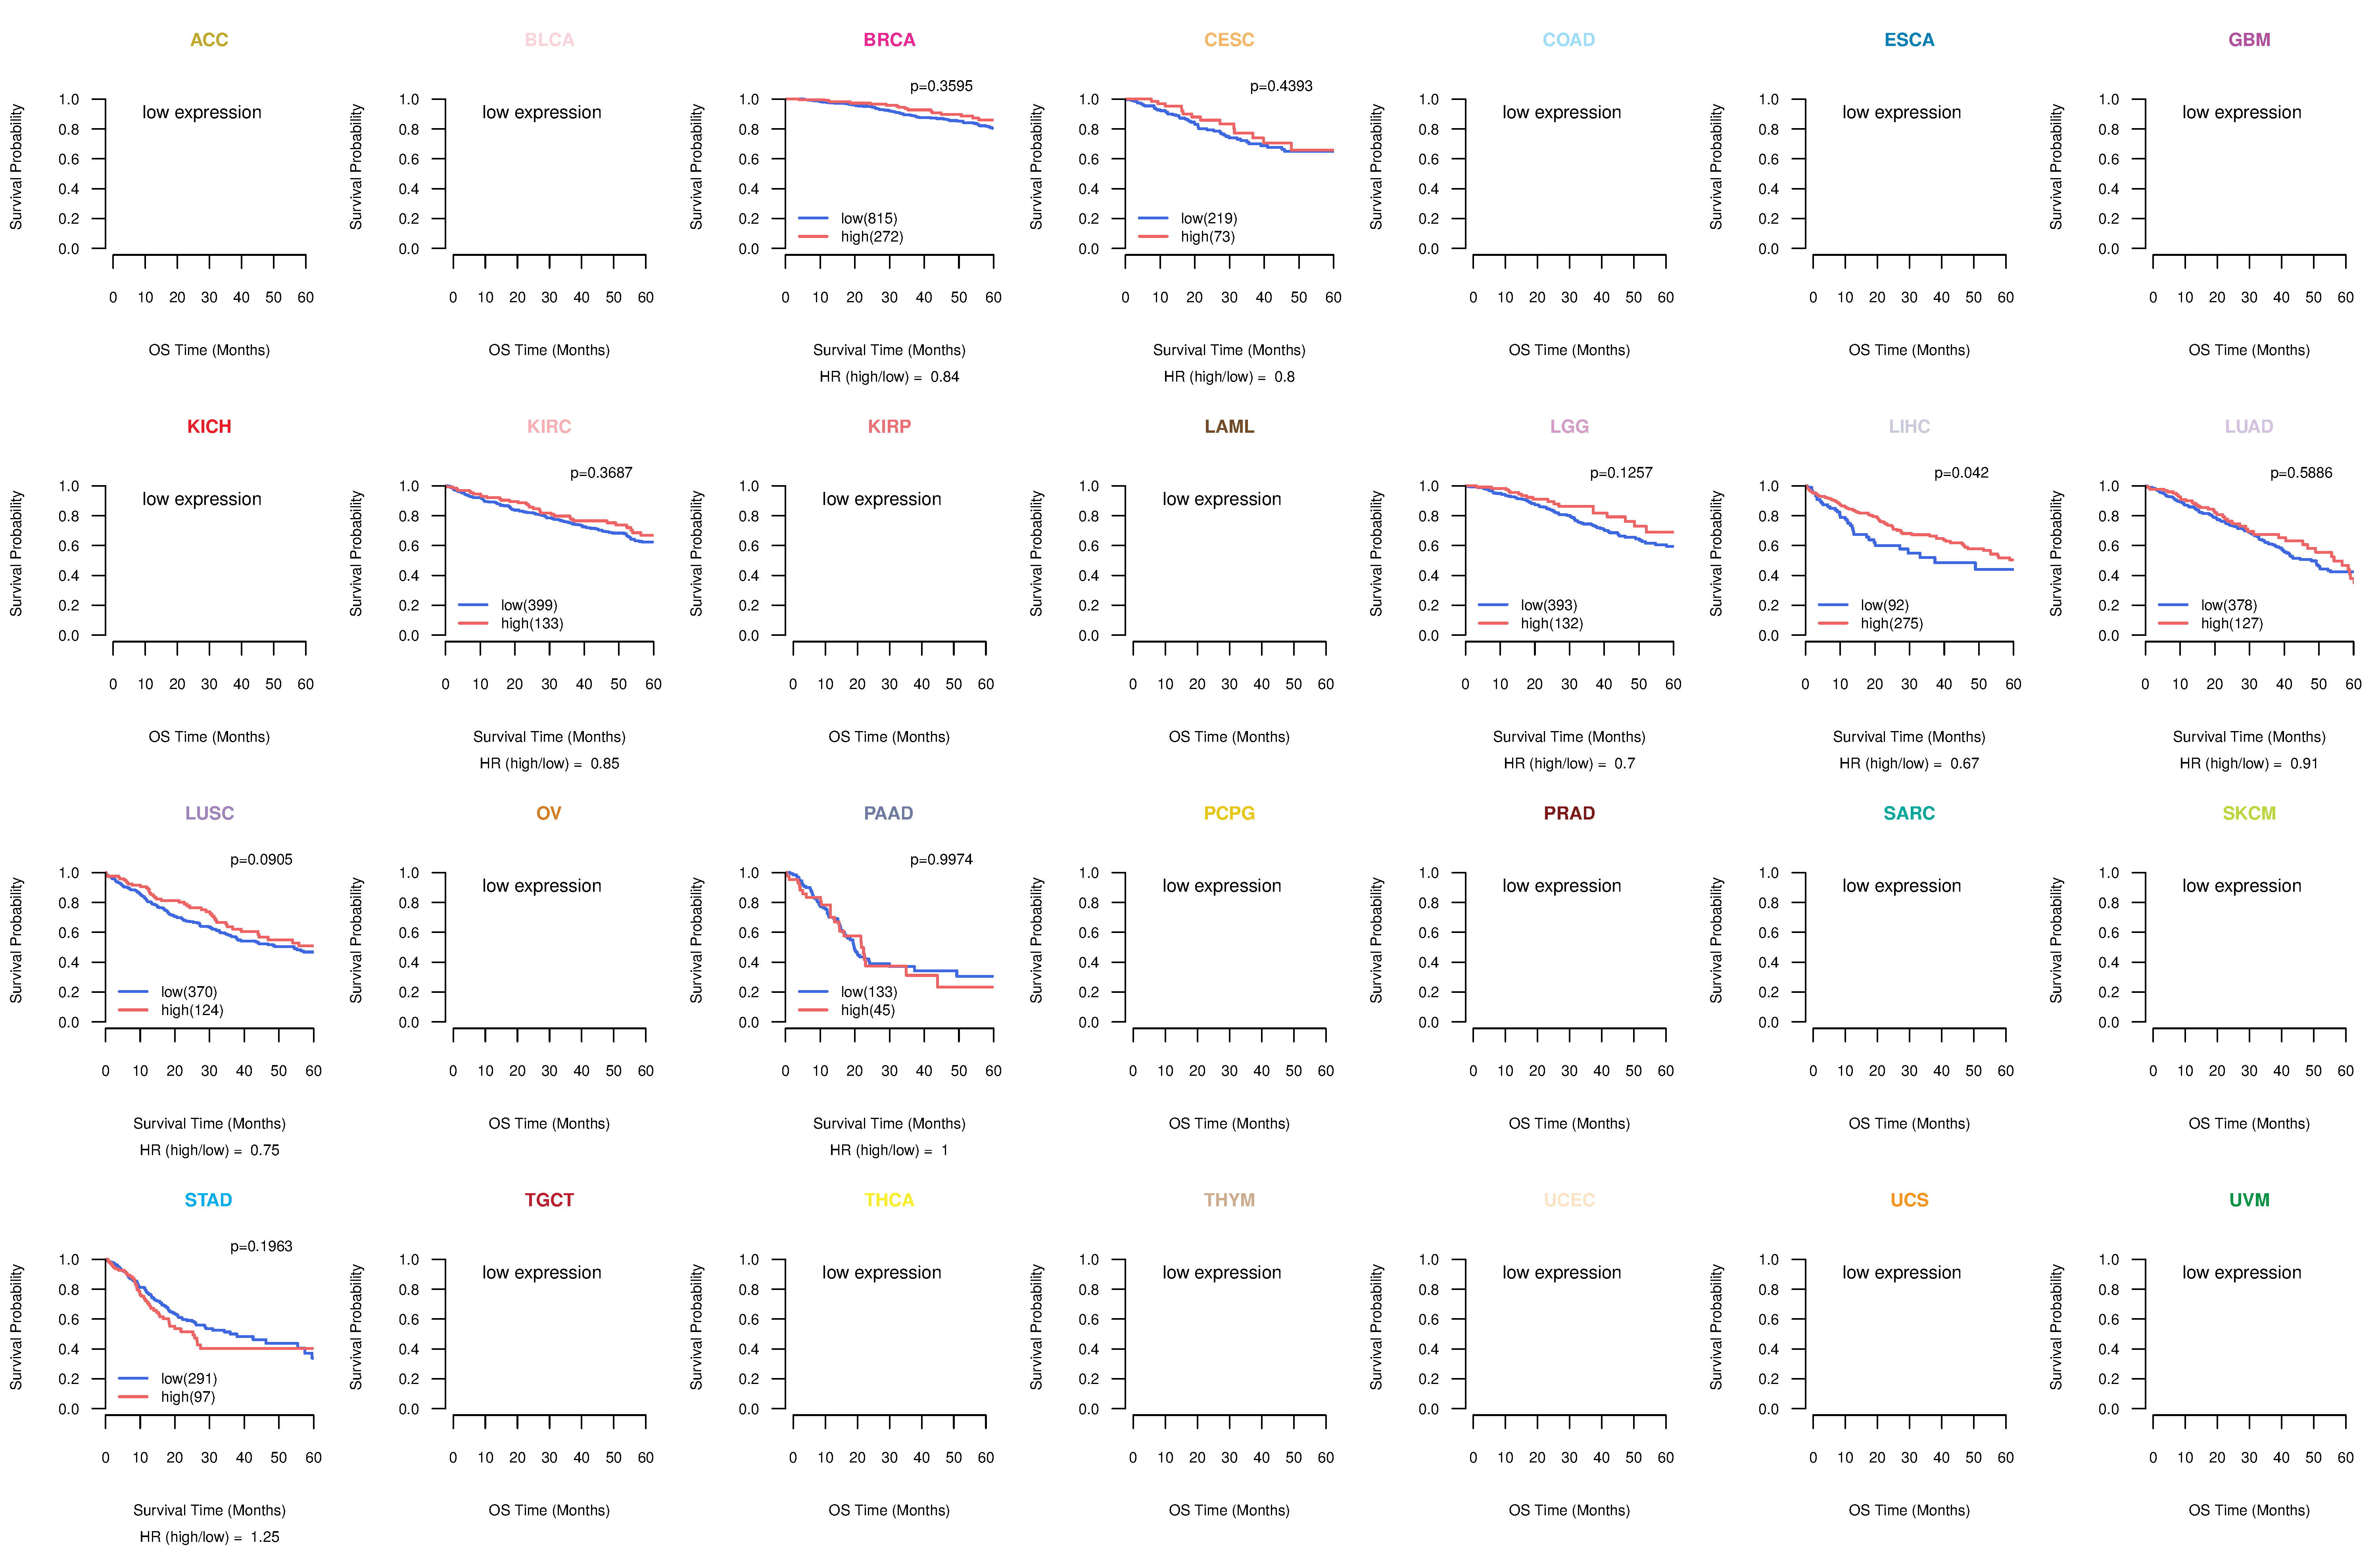 |
| Kaplan-Meier plots with logrank test of relapse free survival (RFS) using 28 cancer types (TCGA IlluminaHiSeq_RNASeqV2, pan-cancer normalized log2(norm_counts+1) data, version 2016-08-16) (TCGA clinicalMatrix, phenotype data, version 2016-04-27) * Click on the image enlarge it in a new window. |
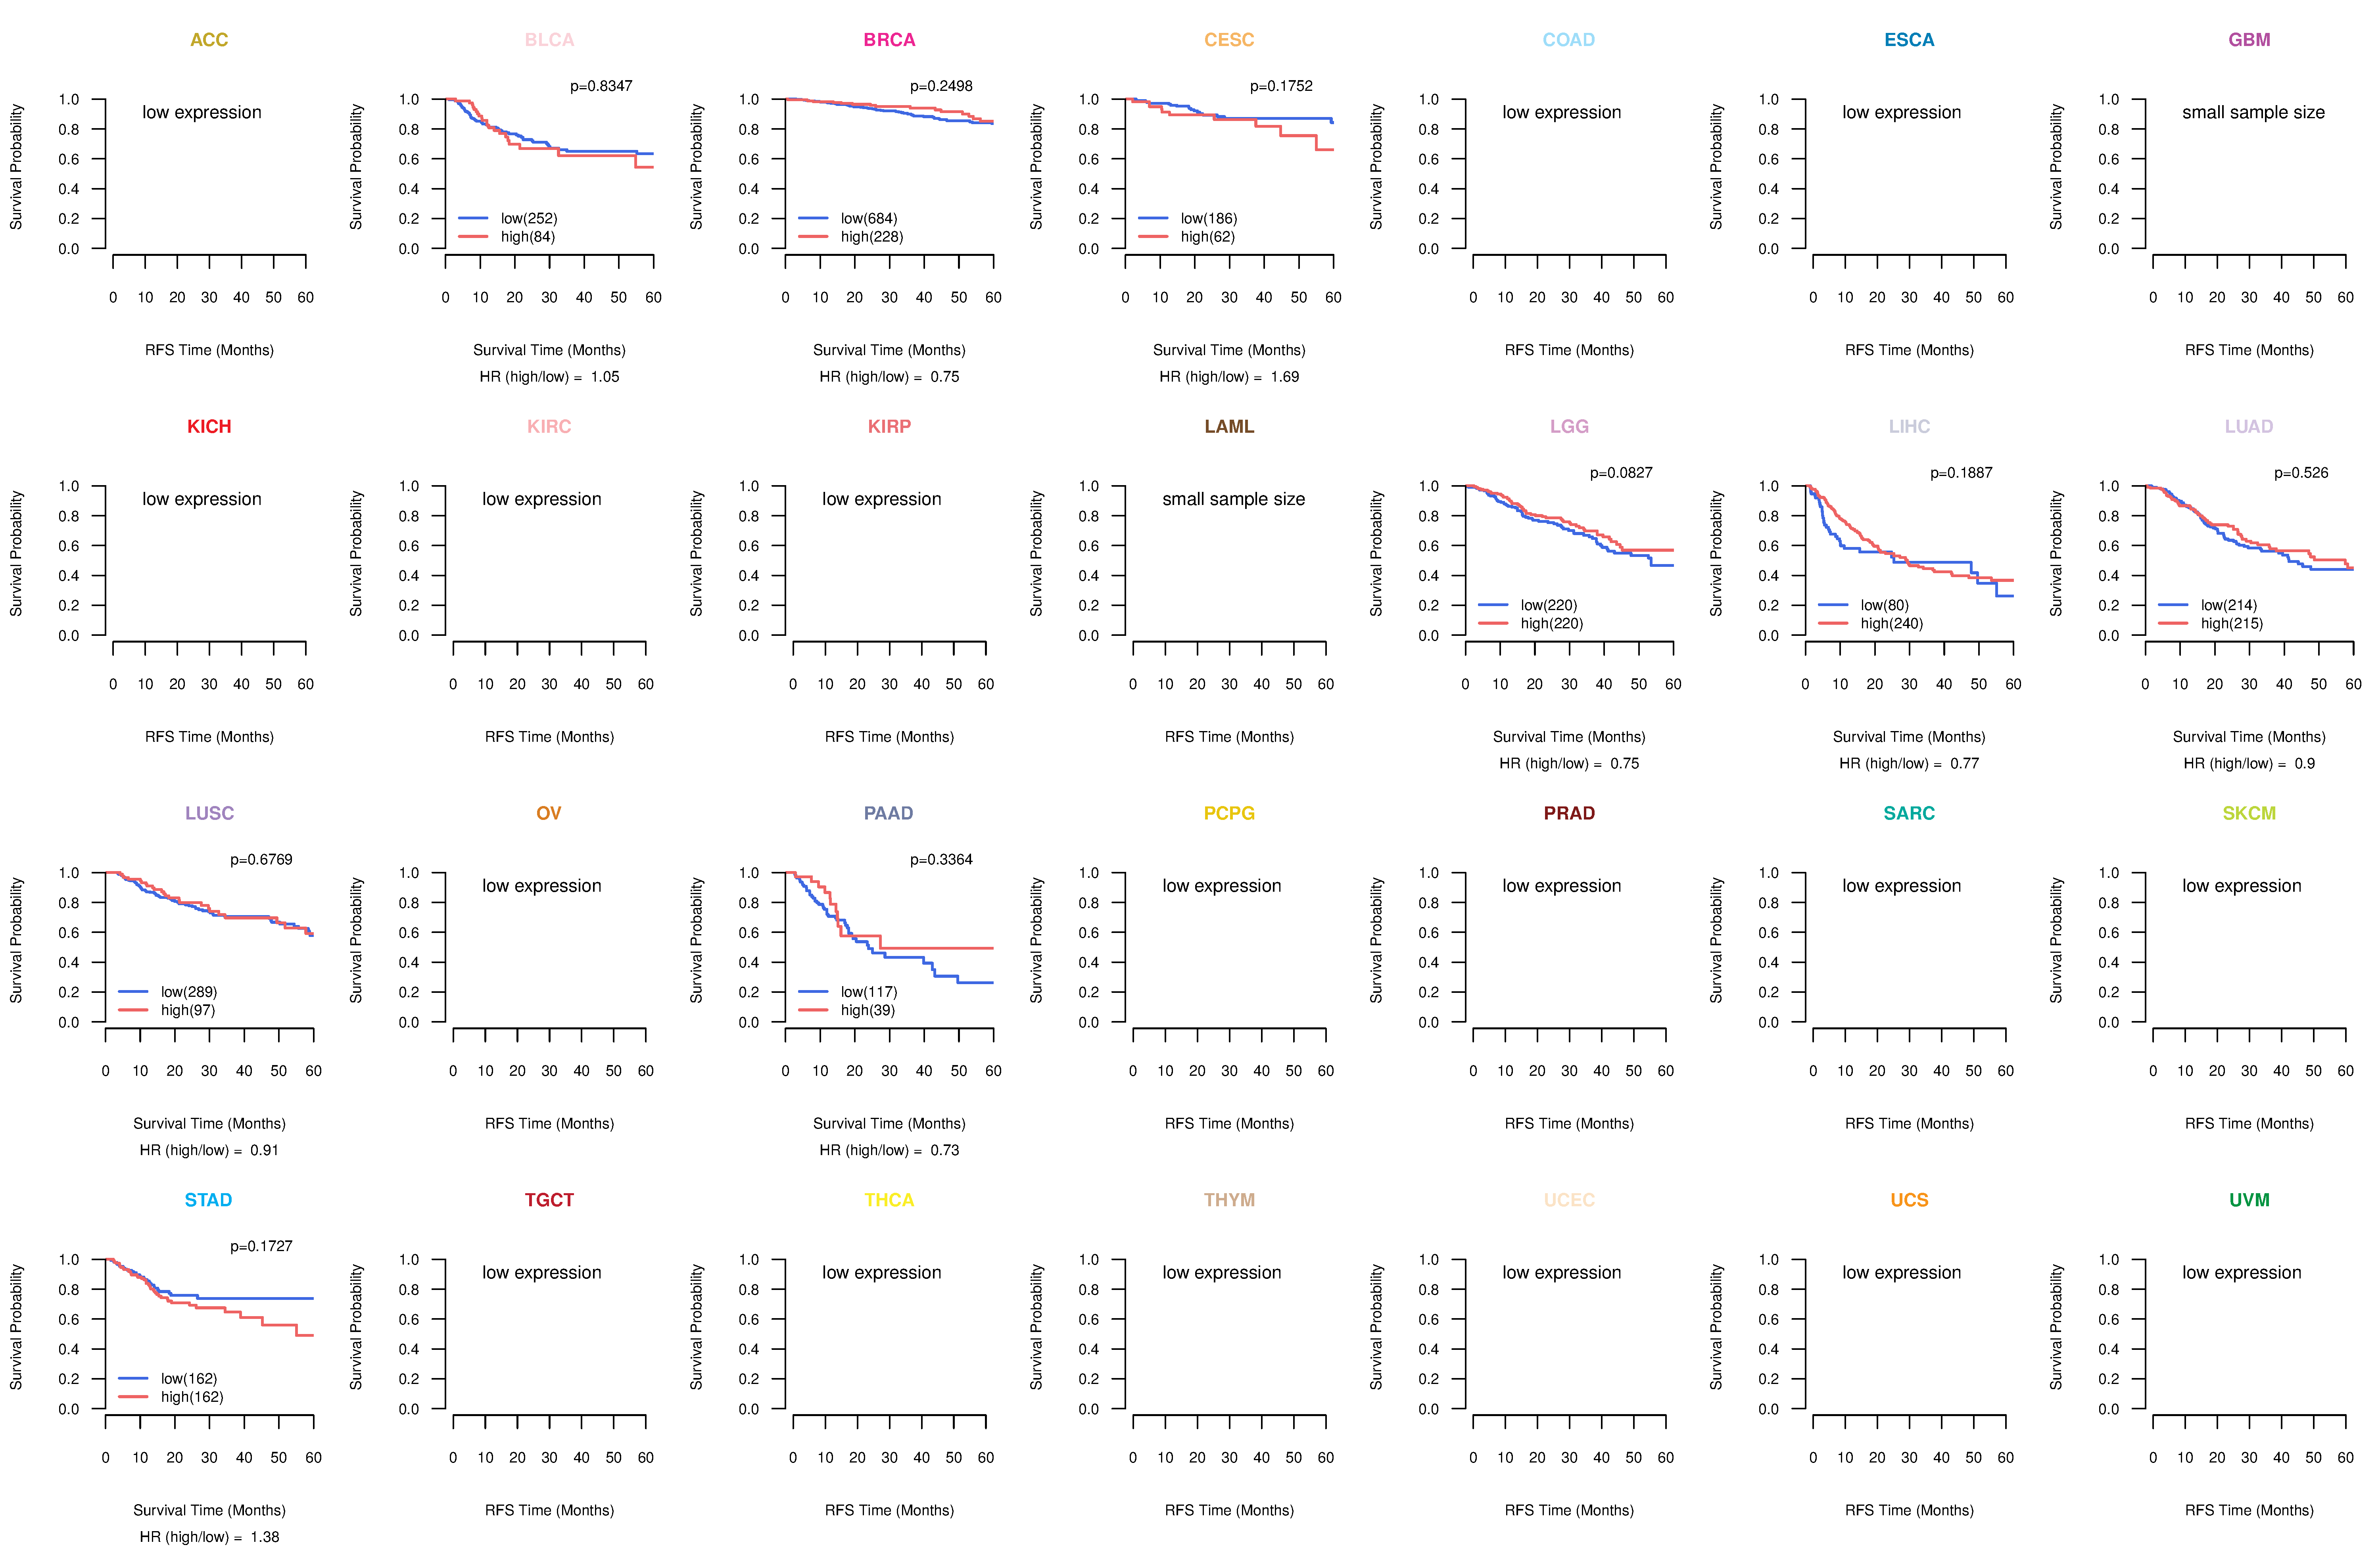 |
| Forest plot of Cox proportional hazard ratio (HR) and 95% CI of overall survival (OS) using 28 cancer types (TCGA IlluminaHiSeq_RNASeqV2, pan-cancer normalized log2(norm_counts+1) data, version 2016-08-16) (TCGA clinicalMatrix, phenotype data, version 2016-04-27) * Click on the image enlarge it in a new window. |
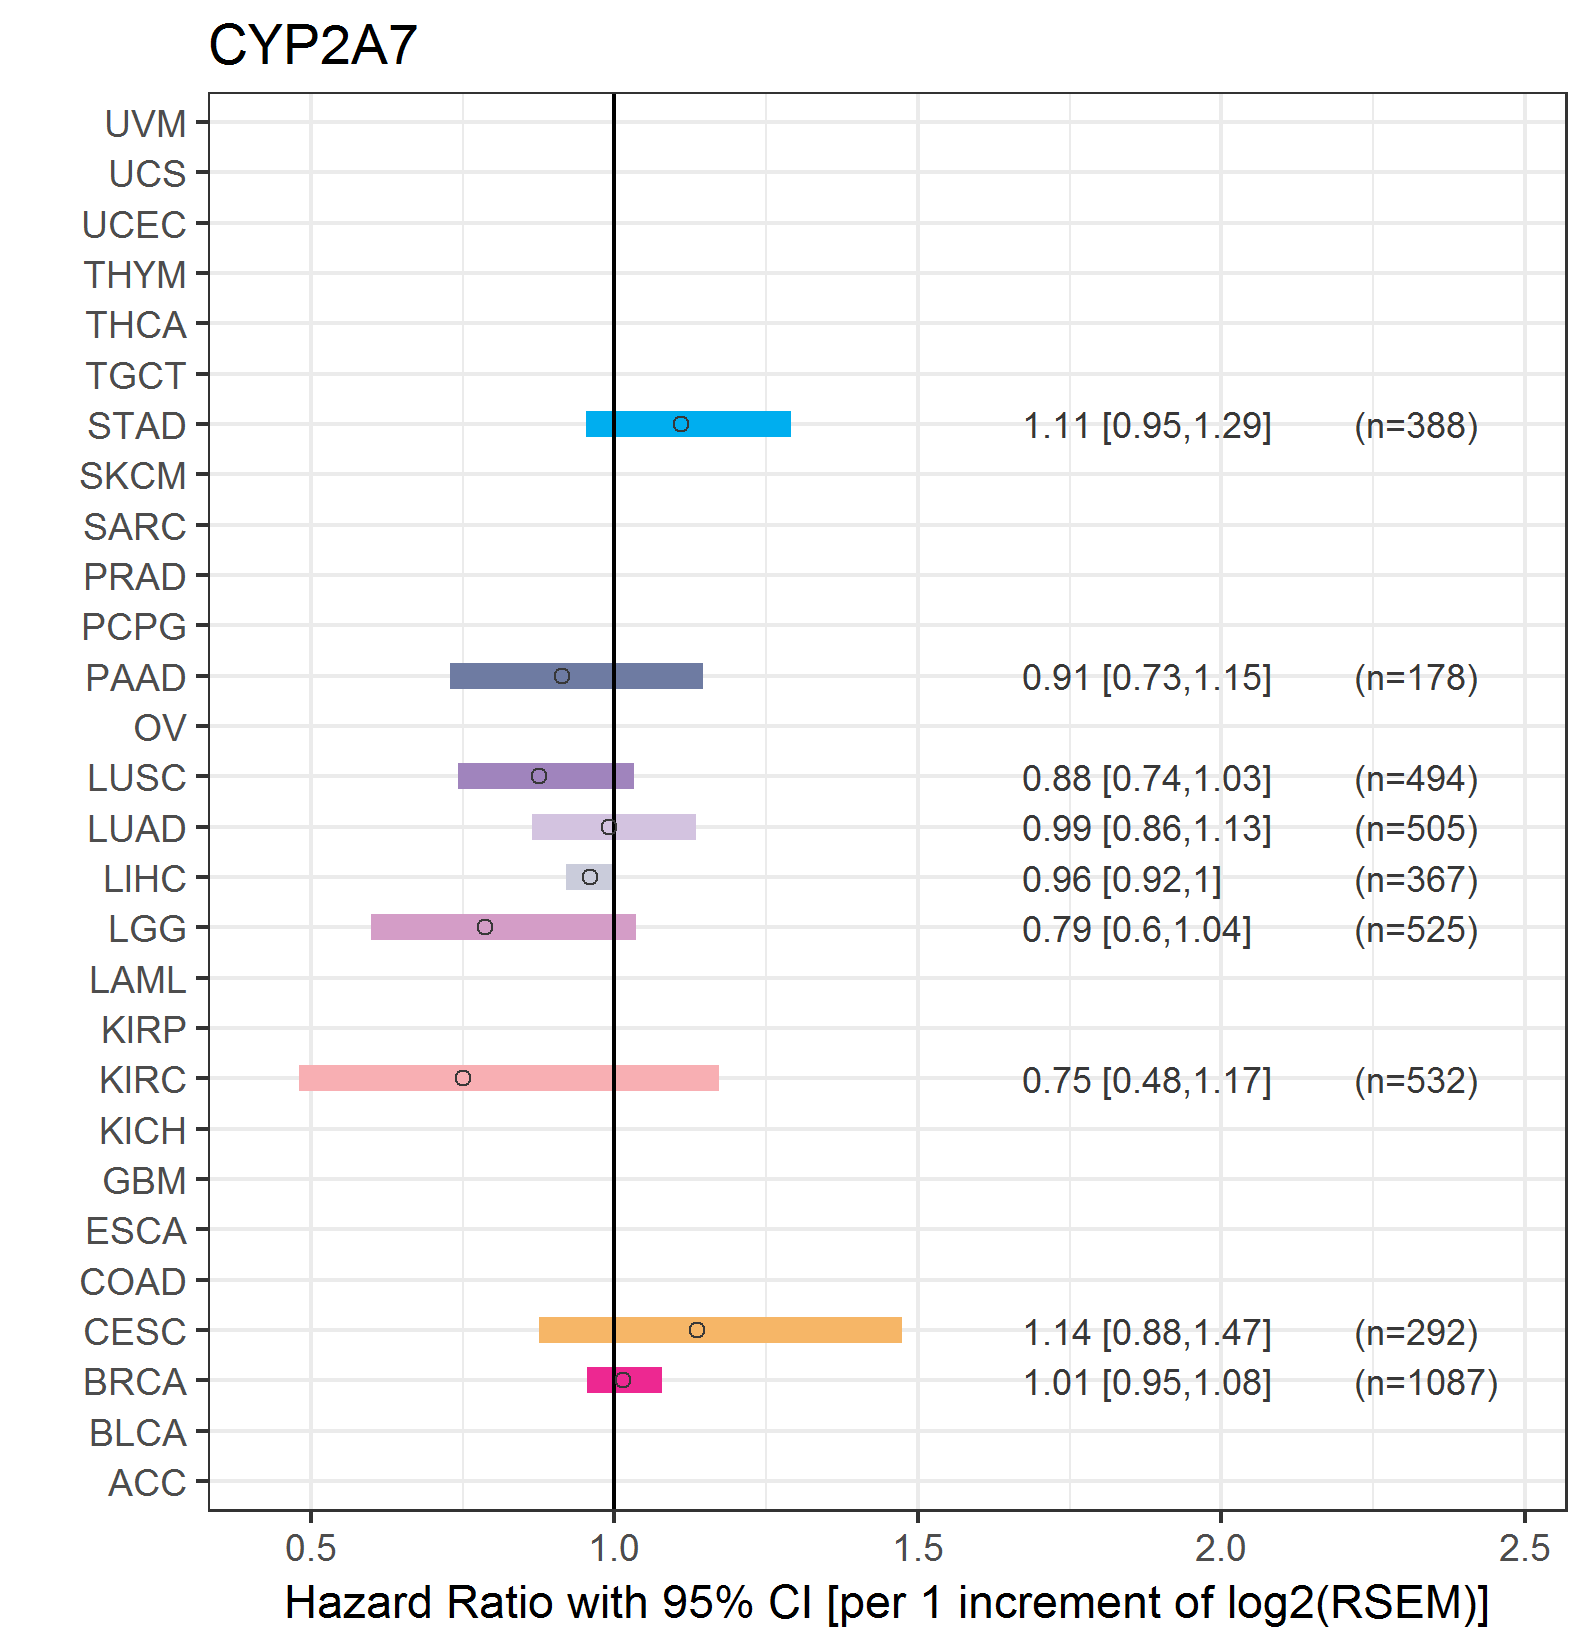 |
| Forest plot of Cox proportional hazard ratio (HR) and 95% CI of relapse free survival (RFS) using 28 cancer types (TCGA IlluminaHiSeq_RNASeqV2, pan-cancer normalized log2(norm_counts+1) data, version 2016-08-16) (TCGA clinicalMatrix, phenotype data, version 2016-04-27) * Click on the image enlarge it in a new window. |
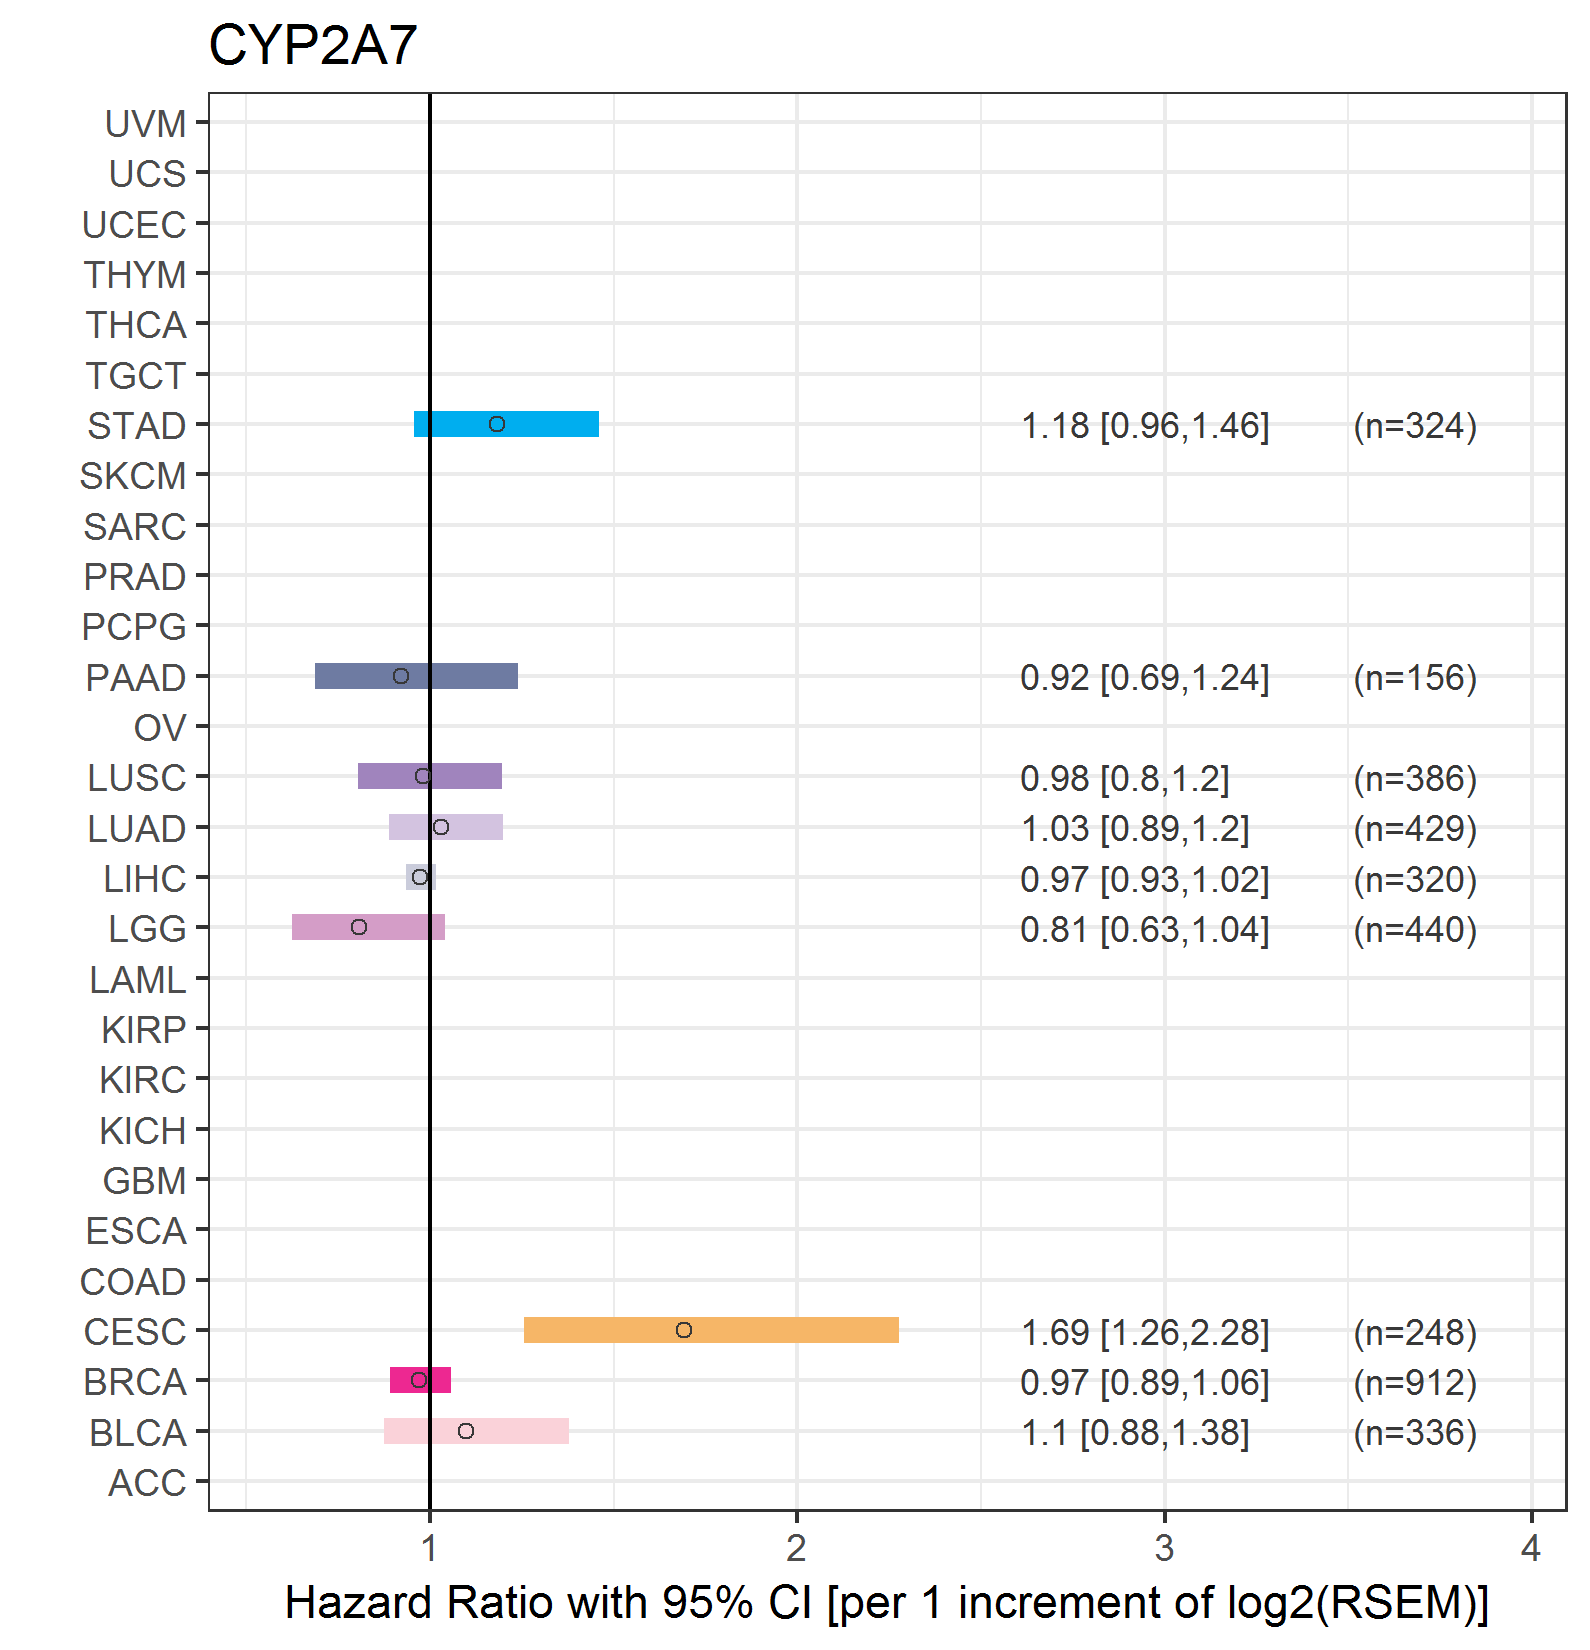 |
| Top |
| TissGeneClin for CYP2A7 |
| TissGeneDrug for CYP2A7 |
| Drug information targeting TissGene (DrugBank Version 5.0.6, 2017-04-01) |
| DrugBank ID | Drug name | Drug activity | Drug type | Drug status |
| Top |
| TissGeneDisease for CYP2A7 |
| Disease information associated with TissGene (DisGeNet, 2016-06-01) |
| Disease ID | Disease name | # pubmeds | Source |
| umls:C0001430 | Adenoma | 1 | BeFree |
| umls:C0006118 | Brain Neoplasms | 1 | BeFree |
| umls:C0023904 | Liver Neoplasms, Experimental | 1 | CTD_mouse |
| umls:C0027126 | Myotonic Dystrophy | 1 | BeFree |
| umls:C0410226 | Congenital Myotonic Dystrophy | 1 | BeFree |
| umls:C0860207 | Drug-Induced Liver Injury | 1 | CTD_mouse |
|
Copyright 2016-Present - The University of Texas Health Science Center at Houston (UTHealth) Web File Viewing | How to Report, Fraud, Waste and Abuse | State of Texas | Statewide Search | Texas Homeland Security | Site Policies |