 |
| |
| |
| |
| |
| |
| |
|
| TissGeneSummary for CYP3A7 |
 Gene summary Gene summary |
| Basic gene information | Gene symbol | CYP3A7 |
| Gene name | cytochrome P450, family 3, subfamily A, polypeptide 7 | |
| Synonyms | CP37|CYPIIIA7|P-450(HFL33)|P-450111A7|P450-HFLA | |
| Cytomap | UCSC genome browser: 7q21-q22.1 | |
| Type of gene | protein-coding | |
| RefGenes | NM_000765.4, | |
| Description | aryl hydrocarbon hydroxylasecytochrome P450 3A7cytochrome P450, subfamily IIIA, polypeptide 7cytochrome P450-HFLAflavoprotein-linked monooxygenasemicrosomal monooxygenasexenobiotic monooxygenase | |
| Modification date | 20141207 | |
| dbXrefs | MIM : 605340 | |
| HGNC : HGNC | ||
| Ensembl : ENSG00000160870 | ||
| HPRD : 05630 | ||
| Vega : OTTHUMG00000156726 | ||
| Protein | UniProt: go to UniProt's Cross Reference DB Table | |
| Expression | CleanEX: HS_CYP3A7 | |
| BioGPS: 1551 | ||
| Pathway | NCI Pathway Interaction Database: CYP3A7 | |
| KEGG: CYP3A7 | ||
| REACTOME: CYP3A7 | ||
| Pathway Commons: CYP3A7 | ||
| Context | iHOP: CYP3A7 | |
| ligand binding site mutation search in PubMed: CYP3A7 | ||
| UCL Cancer Institute: CYP3A7 | ||
| Assigned class in TissGDB* | A | |
| Included tissue-specific gene expression resources | HPA,TiGER,GTEx | |
| Specific-tissues in normal samples (assigned by TissGDB using HPA, TiGER, and GTEx) | Liver | |
| Cancer types related to the specific-tissues in cancer samples (assigned by TissGDB using TCGA) | LIHC | |
| Reference showing the relevant tissue of CYP3A7 | Toxicogenomics directory of chemically exposed human hepatocytes. Grinberg M, Stöber RM, Edlund K, Rempel E, Godoy P, Reif R, Widera A, Madjar K, Schmidt-Heck W, Marchan R, Sachinidis A, Spitkovsky D, Hescheler J, Carmo H, Arbo MD, van de Water B, Wink S, Vinken M, Rogiers V, Escher S, Hardy B, Mitic D, Myatt G, Waldmann T, Mardinoglu A, Damm G, Seehofer D, Nüssler A, Weiss TS, Oberemm A, Lampen A, Schaap MM, Luijten M, van Steeg H, Thasler WE, Kleinjans JC, Stierum RH, Leist M, Rahnenführer J, Hengstler JG. Arch Toxicol. 2014 Dec;88(12):2261-87. doi: 10.1007/s00204-014-1400-x. Epub 2014 Nov 16. (pmid:25399406) go to article | |
| Description by TissGene annotations | ||
| * Class A consists of genes with literature evidence and is part of the cTissGenes. Class B consists of only cTissGenes without additional evidence. The remaining genes belong to Class C. |
 Gene ontology having evidence of Inferred from Direct Assay (IDA) from Entrez Gene ontology having evidence of Inferred from Direct Assay (IDA) from Entrez |
| GO ID | GO term | PubMed ID |
| Top |
| TissGeneExp for CYP3A7 |
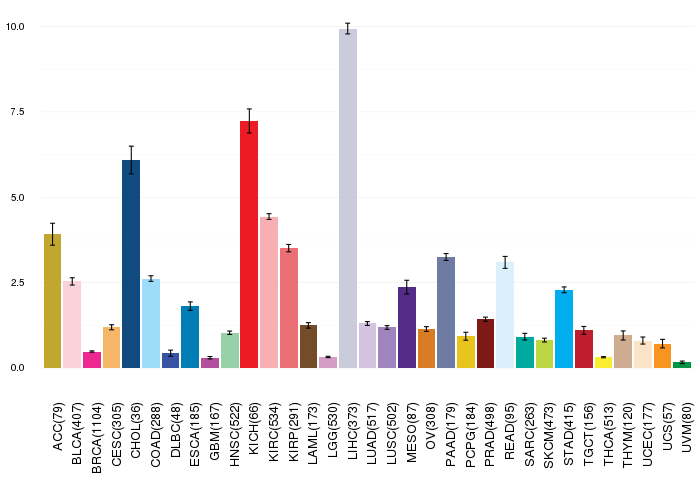
 Gene expressions across 28 cancer types (X-axis: cancer type and Y-axis: log2(norm_counts+1)) Gene expressions across 28 cancer types (X-axis: cancer type and Y-axis: log2(norm_counts+1))(TCGA IlluminaHiSeq_RNASeqV2, pan-cancer normalized log2(norm_counts+1) data, version 2016-08-16) |
 |
 Gene isoform expressions across 28 cancer types (X-axis: cancer type and Y-axis: log2(norm_counts+1)) Gene isoform expressions across 28 cancer types (X-axis: cancer type and Y-axis: log2(norm_counts+1))(TCGA pan-cancer tcga_rsem_isoform_tpm, version 2016-09-01) |
 |
 Gene expressions across normal tissues of GTEx data Gene expressions across normal tissues of GTEx data(GTEx GTEx_Analysis_v6_RNA-seq_RNA-SeQCv1.1.8_gene_rpkm.gct) - Here, we shows the matched tissue types only among our 28 cancer types. |
 |
 Different expressions across 14 cancer types with more than 10 samples between matched tumors and normals (X-axis: cancer type and Y-axis: log2(norm_counts+1)) Different expressions across 14 cancer types with more than 10 samples between matched tumors and normals (X-axis: cancer type and Y-axis: log2(norm_counts+1))(TCGA IlluminaHiSeq_RNASeqV2, pan-cancer normalized log2(norm_counts+1) data, version 2016-08-16) |
 |
| - Significantly differentially expressed cancer types and information. (|Fold change|>1 and FDR<0.05) |
| Cancer type | Mean(exp) in tumor | Mean(exp) in matched normal | Log2FC | P-val. | FDR |
| LIHC | 7.637232453 | 10.06093645 | -2.423704 | 1.69E-06 | 8.61E-06 |
| KIRP | 2.006751453 | 4.337904578 | -2.331153125 | 1.05E-05 | 4.36E-05 |
| LUSC | -0.066895115 | 3.240479395 | -3.30737451 | 1.61E-22 | 2.55E-21 |
| PRAD | 0.074501453 | 1.984114915 | -1.909613462 | 1.54E-08 | 1.83E-07 |
| LUAD | -0.284283891 | 3.27088335 | -3.555167241 | 1.72E-29 | 1.75E-27 |
| KICH | 5.630238453 | 3.429206453 | 2.201032 | 0.00304 | 0.006014506 |
| Top |
| TissGene-miRNA for CYP3A7 |
 Significantly anti-correlated miRNAs of TissGene across 28 cancer types Significantly anti-correlated miRNAs of TissGene across 28 cancer types(Gene-miRNA relations from TargetScanHuman Relsease 7.1, Conserved_Site_Context_Scores.txt.zip, 06.01.2016) (TCGA IlluminaHiSeq_miRNASeq, log2(RPM+1) data, version 2016-11-21) (TCGA IlluminaHiSeq_RNASeqV2, log2(normalized_count+1) data, version 2016-08-16) (Spearman’s Rank Correlation (p-value<0.05 and coefficient<-0.25)) |
| Cancer type | miRNA id | miRNA accession | P-val. | Coeff. | # samples |
| Top |
| TissGeneMut for CYP3A7 |
| TissGeneSNV for CYP3A7 |
 nsSNV counts per each loci. nsSNV counts per each loci.Different colors of circles represent different cancer types. Circle size denotes number of samples. (TCGA somatic mutation (SNPs and small INDELs) data, version 2016-04-25) * Click on the image to enlarge it in a new window. |
 |
 |
 Somatic nucleotide variants of TissGene across 28 cancer types Somatic nucleotide variants of TissGene across 28 cancer types (X-axis: cancer type and Y-axis: % of mutated samples) The numbers in parentheses are numbers of samples with mutation (nsSNVs). (TCGA somatic mutation (SNPs and small INDELs) data, version 2016-04-25) |
 |
| - nsSNVs sorted by frequency. |
| AAchange | Cancer type | # samples |
| p.E334K | SKCM | 3 |
| p.M452I | SKCM | 2 |
| p.E308K | SKCM | 2 |
| p.W126* | SKCM | 2 |
| p.R28H | SARC | 1 |
| p.R28C | SARC | 1 |
| p.E374D | BLCA | 1 |
| p.M371K | SARC | 1 |
| p.R162Q | BLCA | 1 |
| p.Y23C | GBM | 1 |
| p.D348N | SKCM | 1 |
| p.P215L | CESC | 1 |
| p.G436E | SKCM | 1 |
| p.V111M | STAD | 1 |
| p.F33V | READ | 1 |
| p.L491I | THYM | 1 |
| p.R158K | SKCM | 1 |
| p.E125X | STAD | 1 |
| p.V381A | BRCA | 1 |
| p.E417K | HNSC | 1 |
| p.W408* | SKCM | 1 |
| p.E412D | UCEC | 1 |
| p.F189I | SKCM | 1 |
| p.P416S | SKCM | 1 |
| p.E10G | SKCM | 1 |
| p.R162W | BRCA | 1 |
| p.S464F | SKCM | 1 |
| p.L449V | BLCA | 1 |
| p.P227S | SKCM | 1 |
| p.F228L | BLCA | 1 |
| p.Y355C | PAAD | 1 |
| p.N262D | UCEC | 1 |
| p.K254T | SKCM | 1 |
| p.R28H | UCEC | 1 |
| p.I246M | SKCM | 1 |
| p.R158I | UCEC | 1 |
| p.M275I | LUAD | 1 |
| p.V338L | BLCA | 1 |
| p.G37E | SKCM | 1 |
| p.G190X | KIRC | 1 |
| p.Q332X | COAD | 1 |
| p.E163D | LIHC | 1 |
| p.G140R | GBM | 1 |
| p.S100F | BRCA | 1 |
| p.E165Q | BLCA | 1 |
| p.V71I | SKCM | 1 |
| p.G177E | SKCM | 1 |
| p.T59R | LUAD | 1 |
| p.L272I | ESCA | 1 |
| p.Y432C | PRAD | 1 |
| p.H324N | LUAD | 1 |
| p.R161K | SARC | 1 |
| p.S278F | STAD | 1 |
| p.G385E | SKCM | 1 |
| p.D88N | UCEC | 1 |
| p.P218S | COAD | 1 |
| p.Y307* | BLCA | 1 |
| p.G391R | SKCM | 1 |
| p.F226C | UCEC | 1 |
| p.K35X | KIRP | 1 |
| p.G31E | SKCM | 1 |
| p.G112R | SKCM | 1 |
| p.R130Q | SKCM | 1 |
| p.D201Y | PAAD | 1 |
| p.R54C | COAD | 1 |
| p.R260C | COAD | 1 |
| p.R243K | SKCM | 1 |
| p.V175I | COAD | 1 |
| p.W72* | BLCA | 1 |
| p.G438R | SKCM | 1 |
| p.G190* | KIRC | 1 |
| p.P43S | LUAD | 1 |
| p.G186A | GBM | 1 |
| p.D425N | SKCM | 1 |
| p.K35* | KIRP | 1 |
| p.P397A | LUSC | 1 |
| p.N451S | STAD | 1 |
| p.H324Y | BRCA | 1 |
| p.E125* | STAD | 1 |
| p.Q279* | LUAD | 1 |
| p.N237T | GBM | 1 |
| p.L14I | UCEC | 1 |
| p.L221F | SKCM | 1 |
| Top |
| TissGeneCNV for CYP3A7 |
 Copy number variations of TissGene across 28 cancer types (X-axis: cancer type and Y-axis: % of CNV samples) Copy number variations of TissGene across 28 cancer types (X-axis: cancer type and Y-axis: % of CNV samples)(TCGA Gistic2_CopyNumber_Gistic2_all_data_by_genes, Gistic2 copy number data, version 2016-08-16) |
 |
| Top |
| TissGeneFusions for CYP3A7 |
 Fusion genes including TissGene Fusion genes including TissGene (ChimerDB 3.0, 2016-12-01 and TCGA fusion Portal 2015-12-01) |
| Database | Src | Cancer type | Sample | Fusion gene | ORF | 5'-gene BP | 3'-gene BP |
| Top |
| TissGeneNet for CYP3A7 |
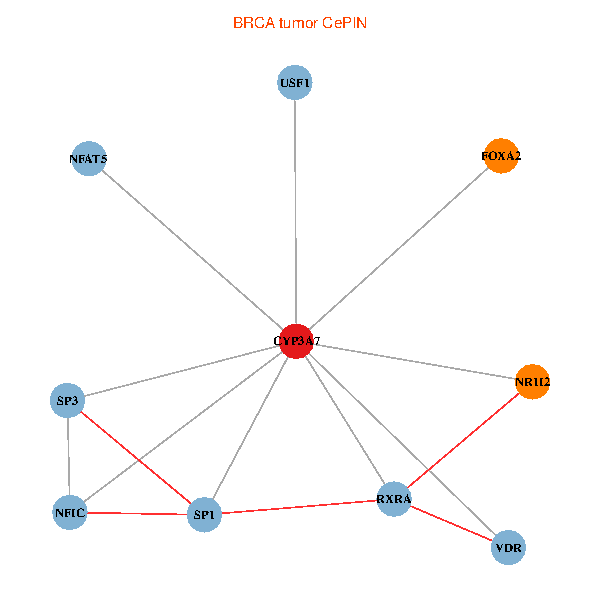
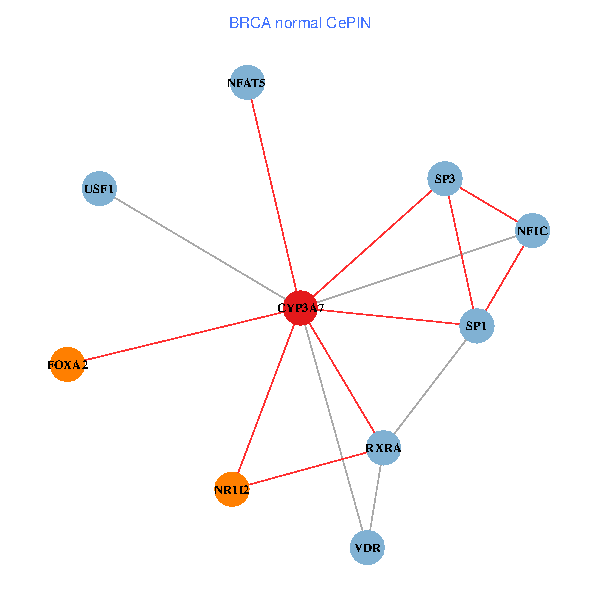
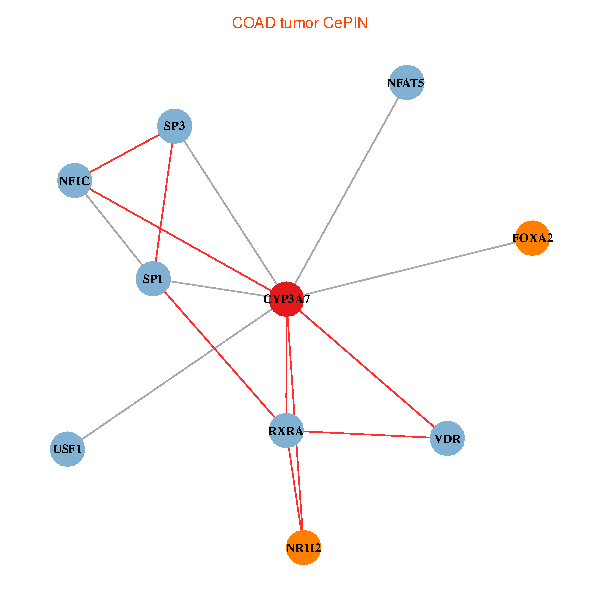
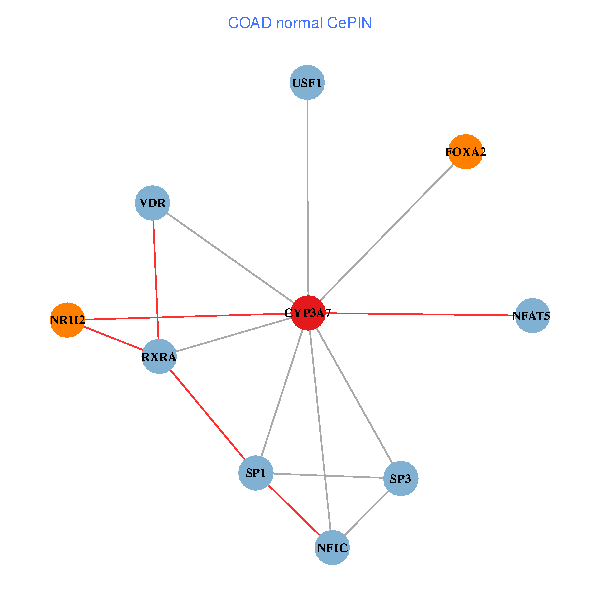
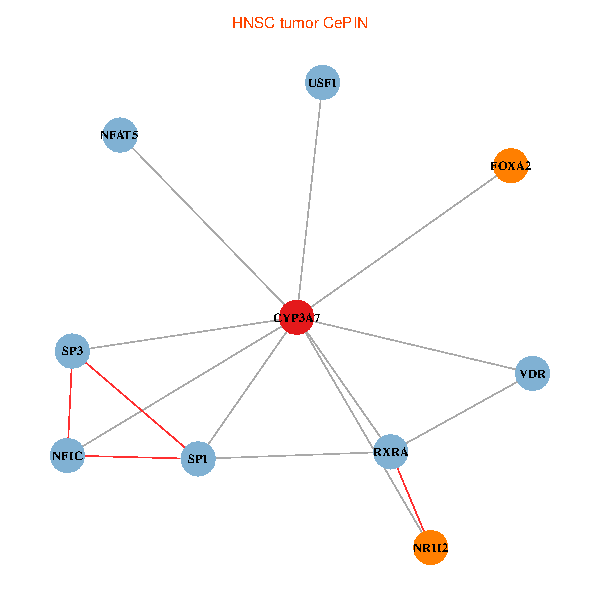
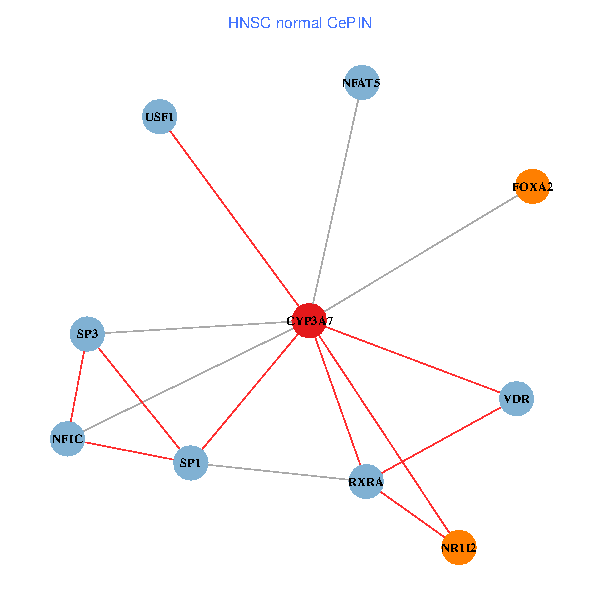
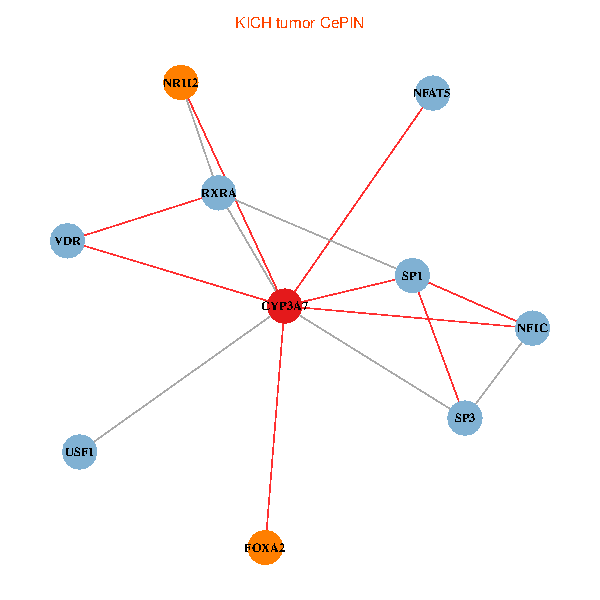
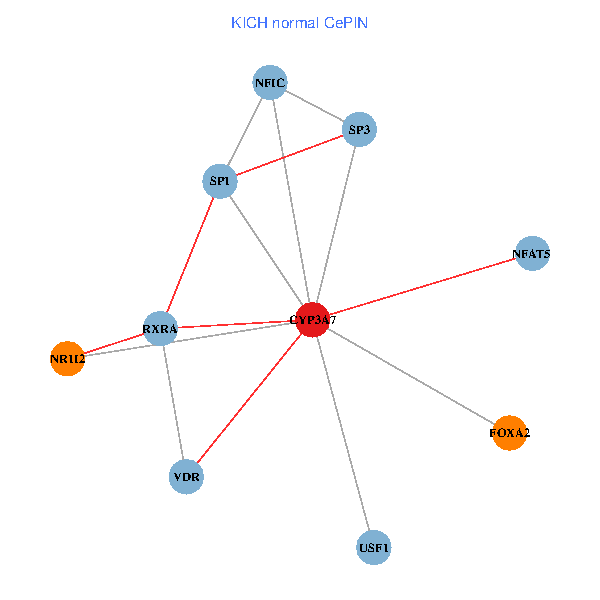
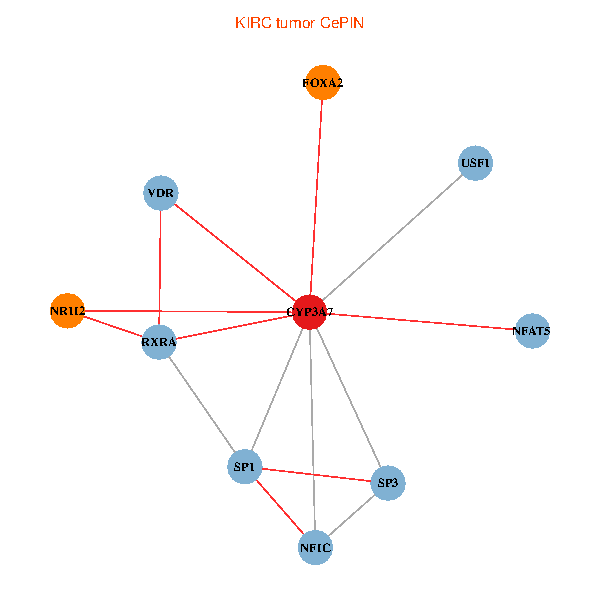
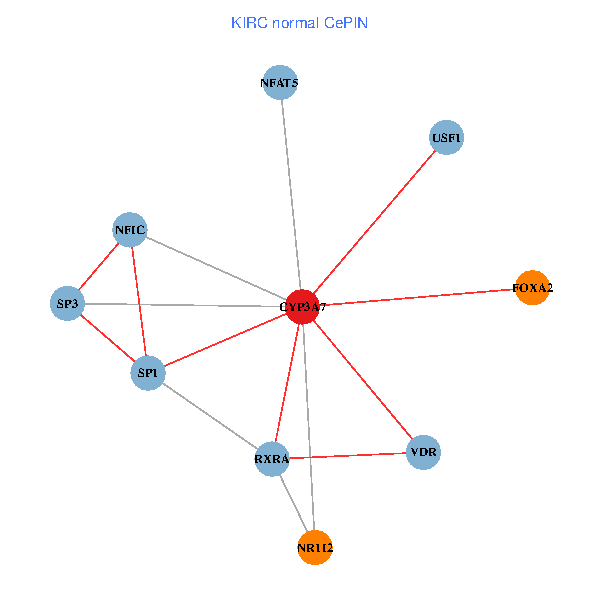
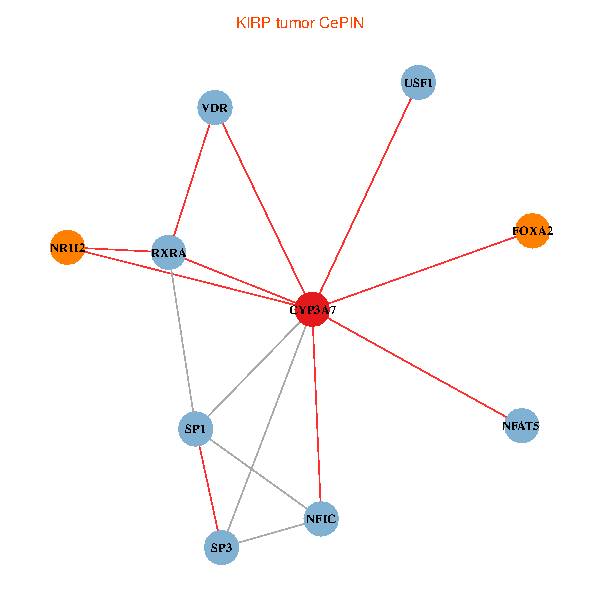
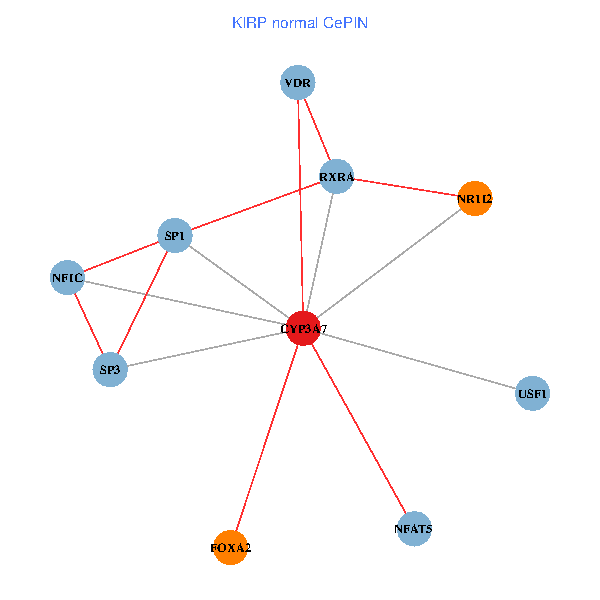
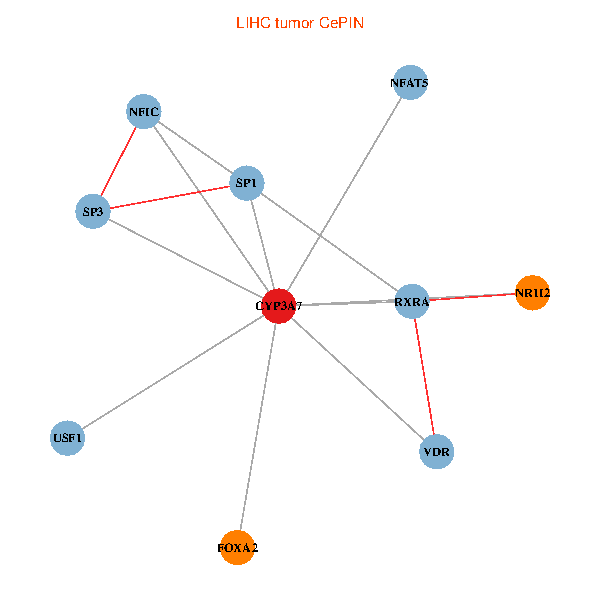
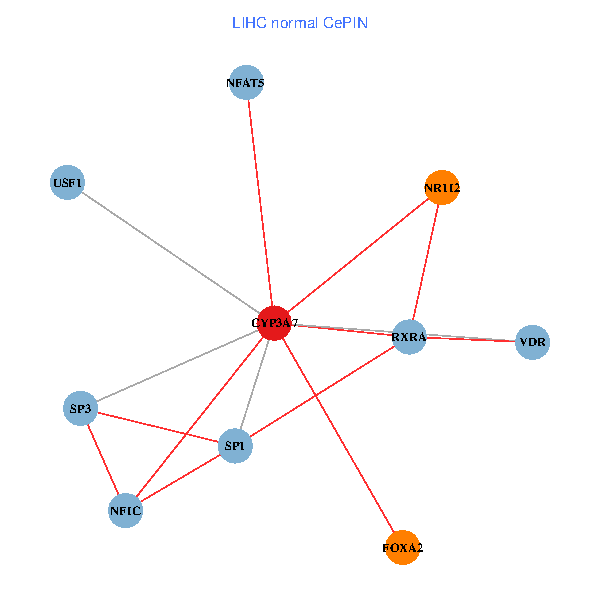
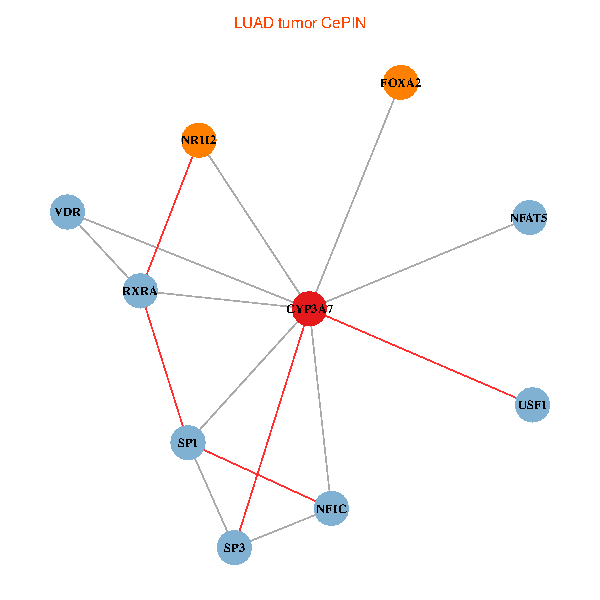
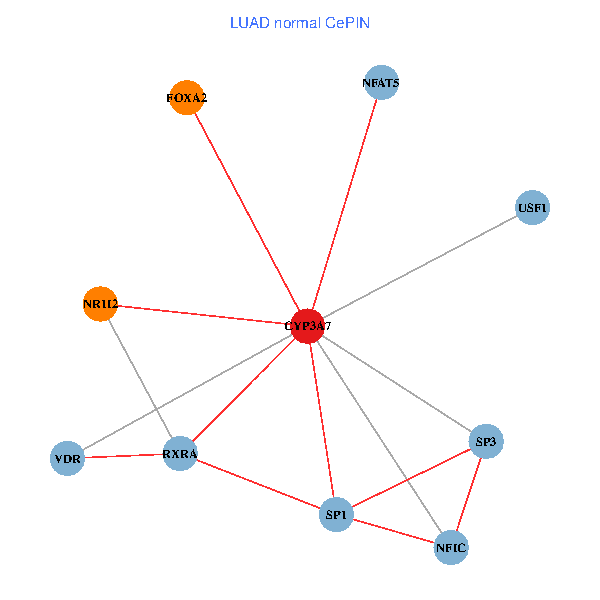
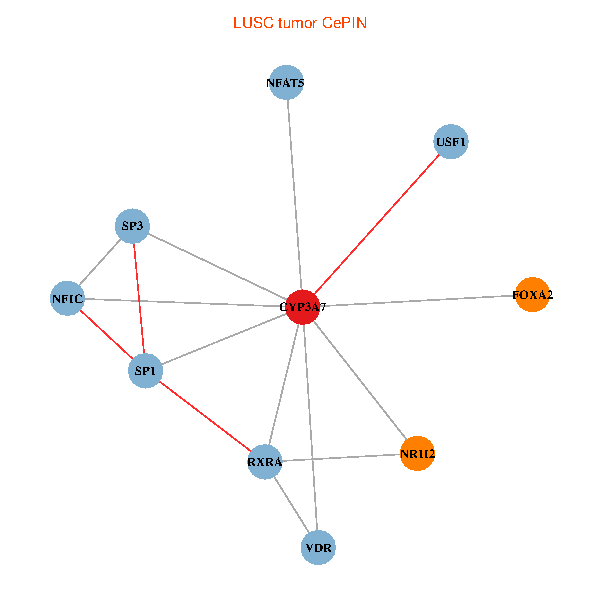
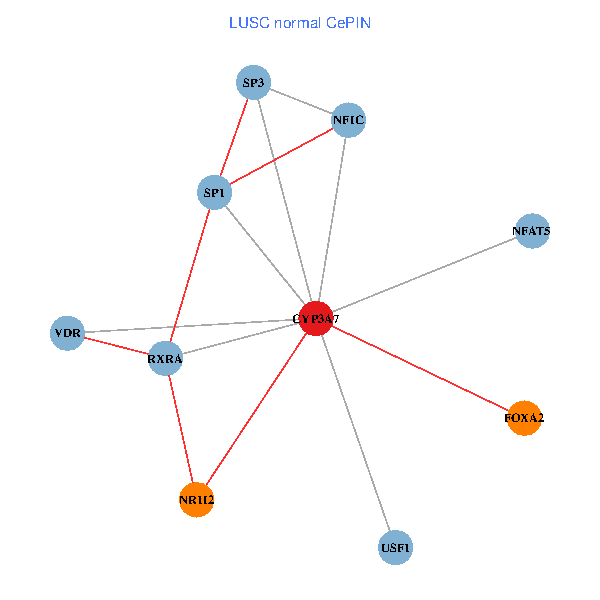
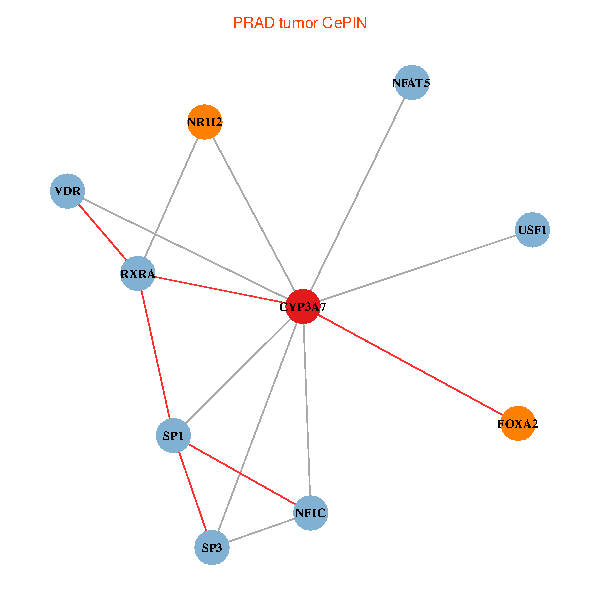
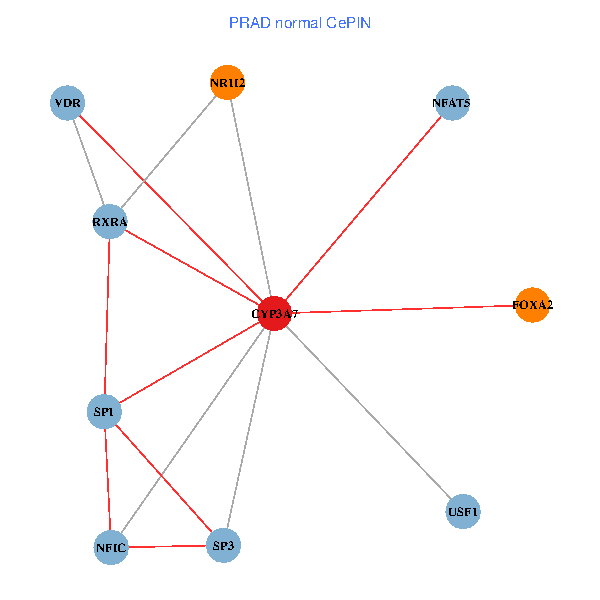
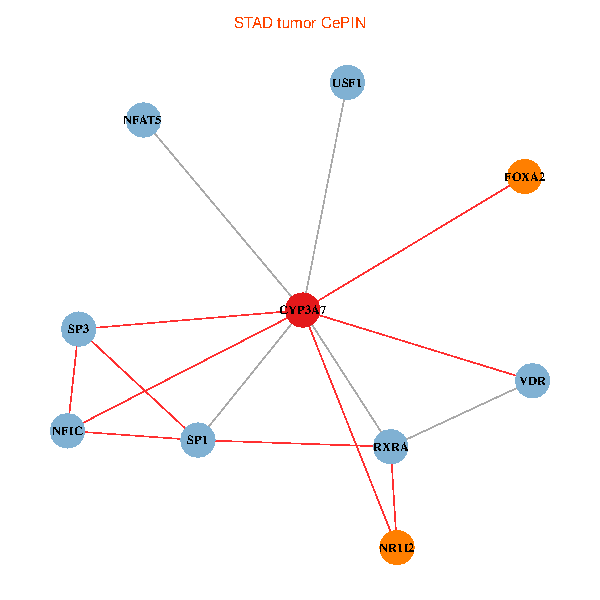
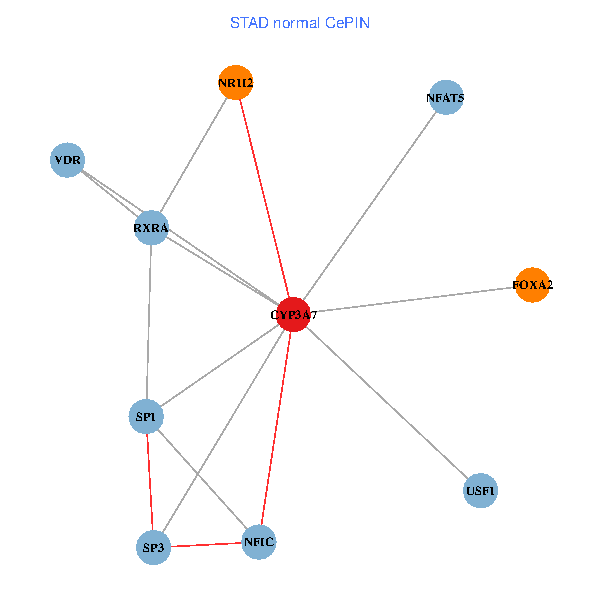
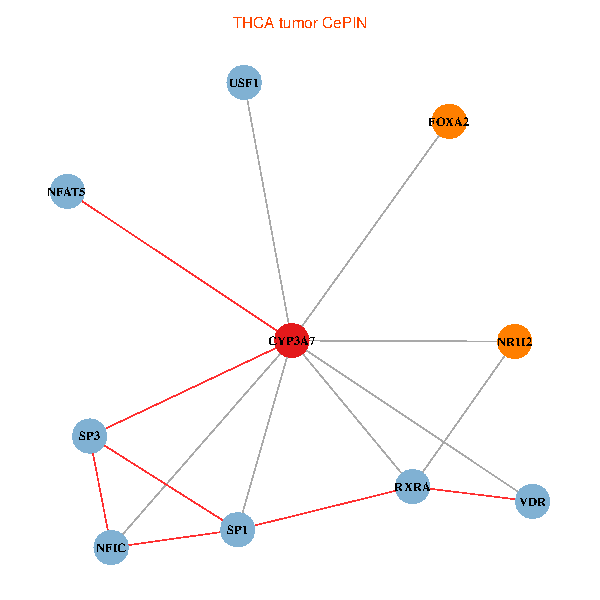
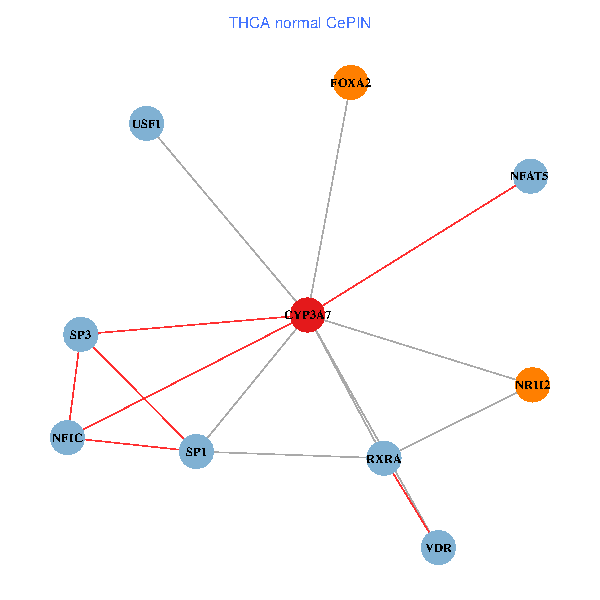
 Co-expressed gene networks based on protein-protein interaction data (CePIN) Co-expressed gene networks based on protein-protein interaction data (CePIN)(TCGA IlluminaHiSeq_RNASeqV2, pan-cancer normalized log2(norm_counts+1) data, version 2016-08-16) (PINA2 ppi data) |
| Top |
| TissGeneProg for CYP3A7 |
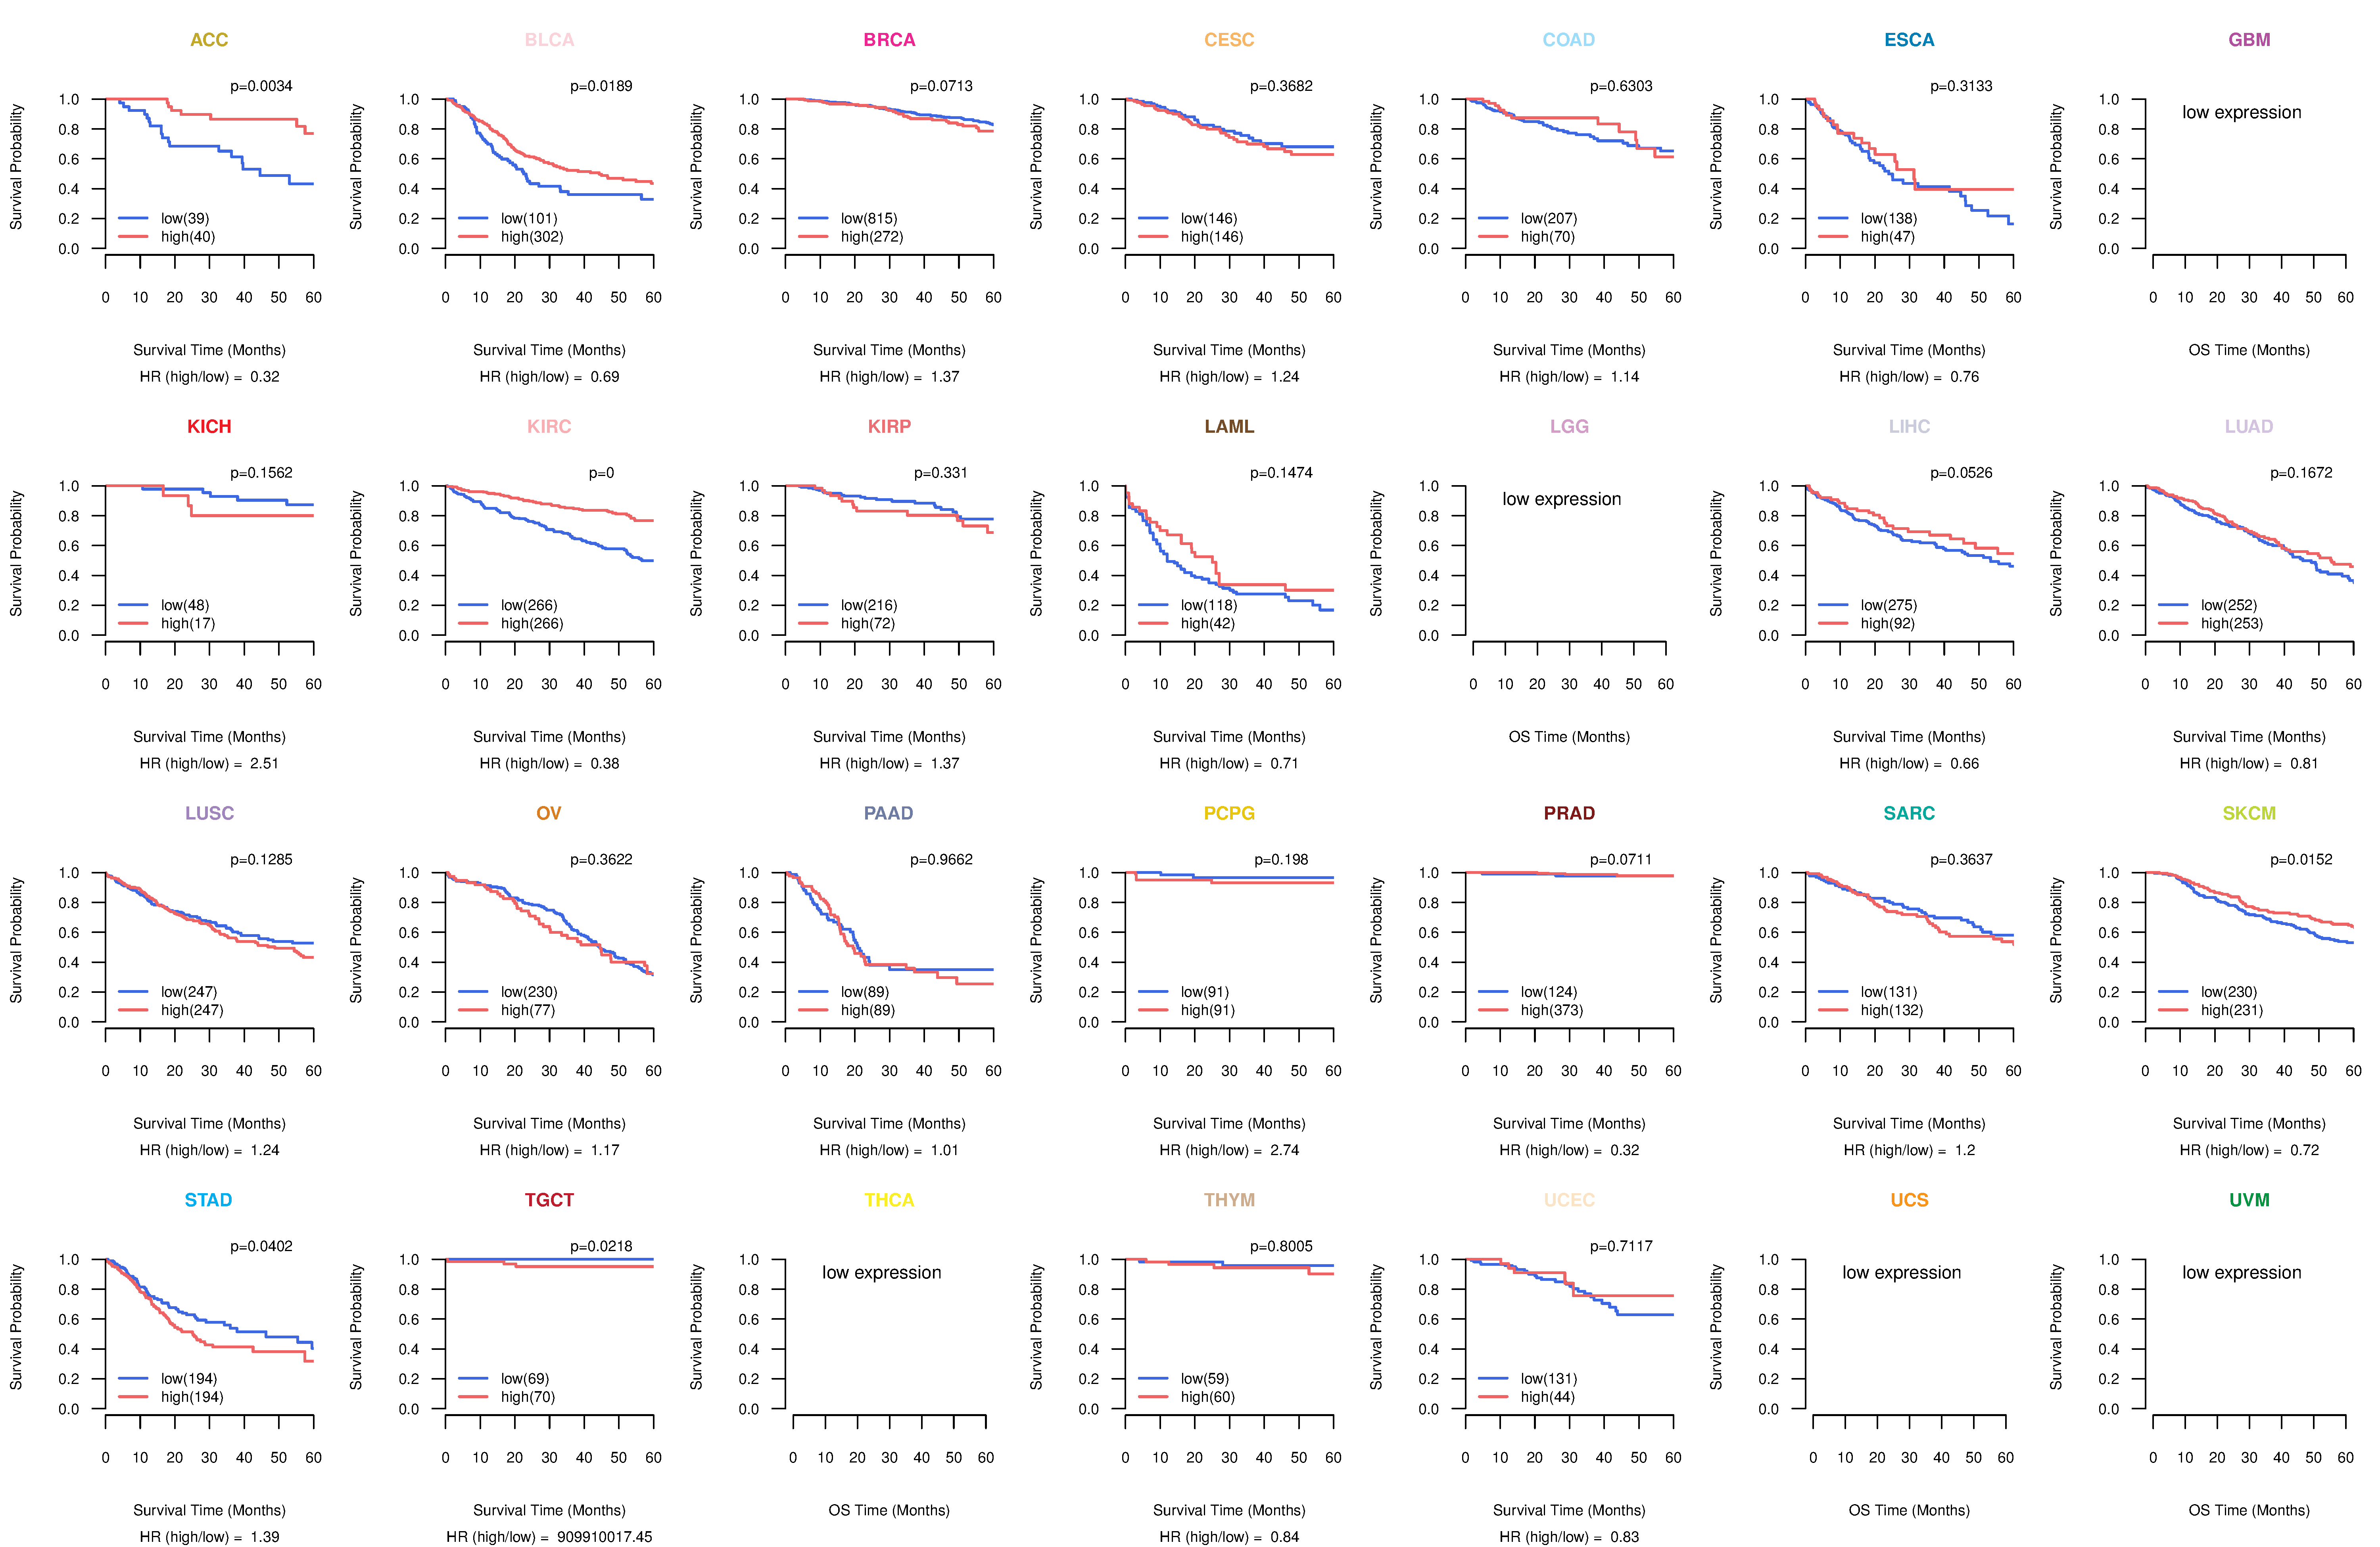
 Kaplan-Meier plots with logrank tests of overall survival (OS) using 28 cancer types Kaplan-Meier plots with logrank tests of overall survival (OS) using 28 cancer types (TCGA IlluminaHiSeq_RNASeqV2, pan-cancer normalized log2(norm_counts+1) data, version 2016-08-16) (TCGA clinicalMatrix, phenotype data, version 2016-04-27) * Click on the image to enlarge it in a new window. |
 |
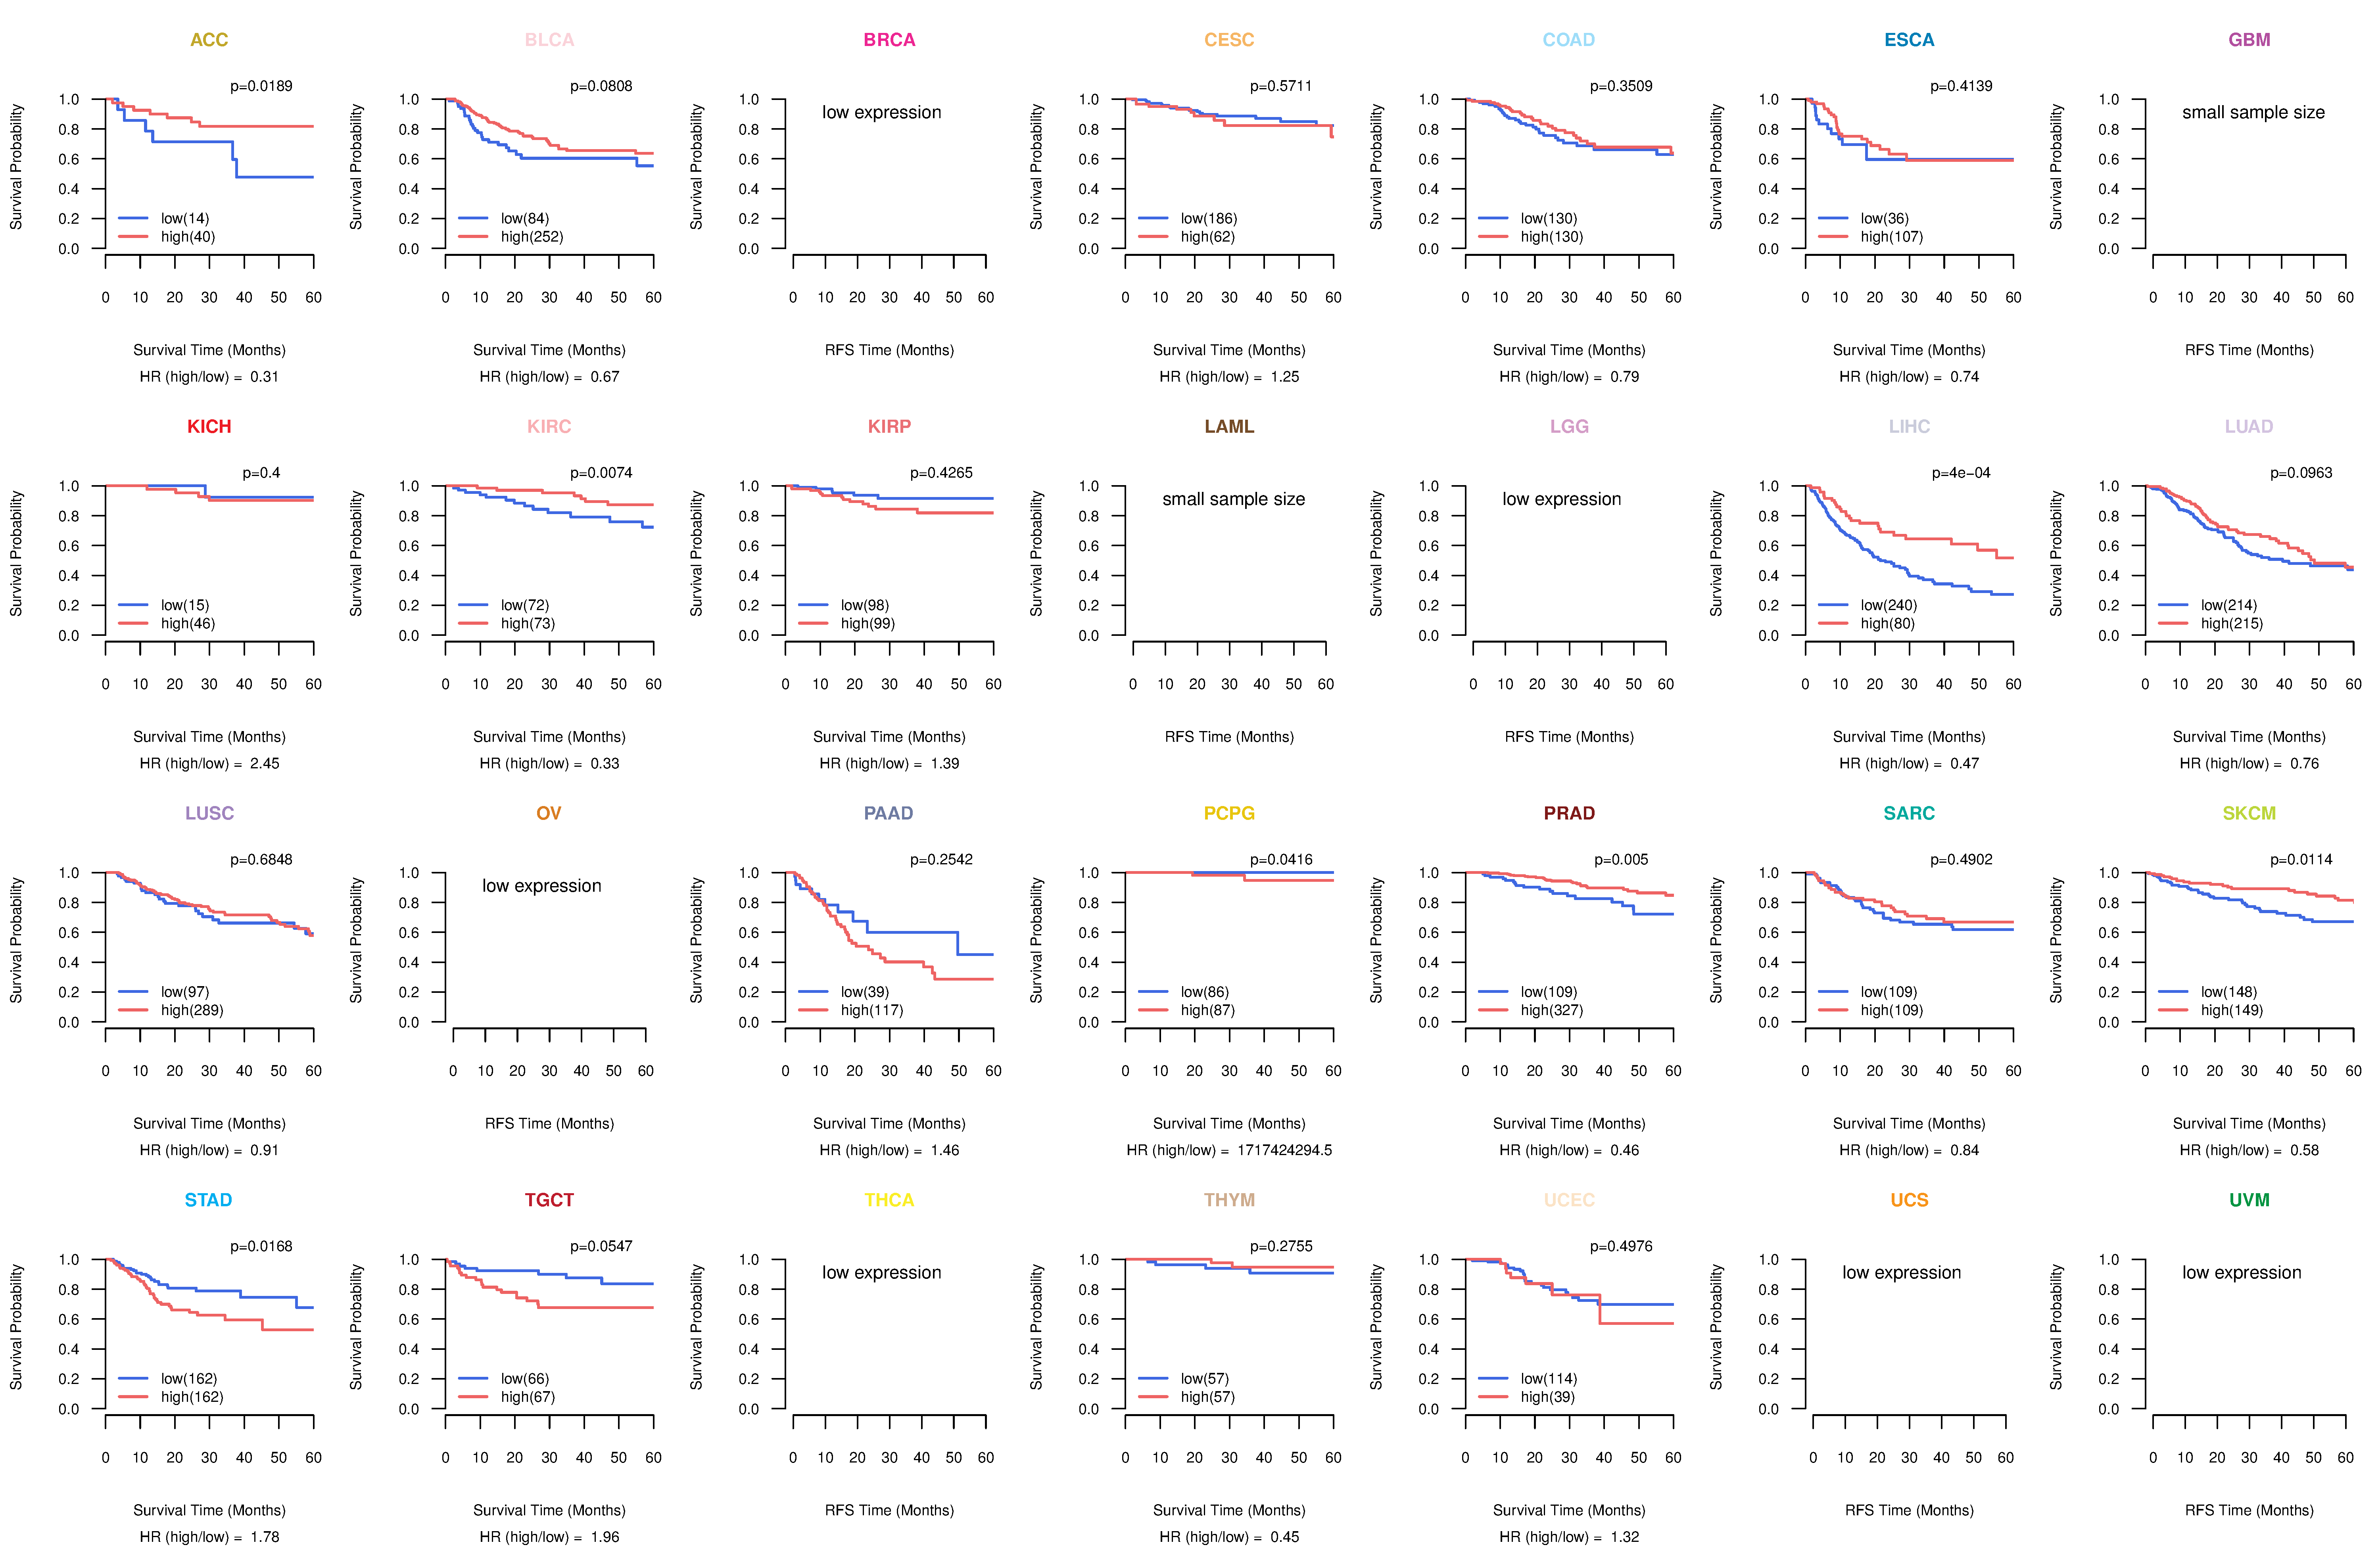
 Kaplan-Meier plots with logrank test of relapse free survival (RFS) using 28 cancer types Kaplan-Meier plots with logrank test of relapse free survival (RFS) using 28 cancer types (TCGA IlluminaHiSeq_RNASeqV2, pan-cancer normalized log2(norm_counts+1) data, version 2016-08-16) (TCGA clinicalMatrix, phenotype data, version 2016-04-27) * Click on the image enlarge it in a new window. |
 |
 Forest plot of Cox proportional hazard ratio (HR) and 95% CI of overall survival (OS) using 28 cancer types Forest plot of Cox proportional hazard ratio (HR) and 95% CI of overall survival (OS) using 28 cancer types (TCGA IlluminaHiSeq_RNASeqV2, pan-cancer normalized log2(norm_counts+1) data, version 2016-08-16) (TCGA clinicalMatrix, phenotype data, version 2016-04-27) * Click on the image enlarge it in a new window. |
 |
 Forest plot of Cox proportional hazard ratio (HR) and 95% CI of relapse free survival (RFS) using 28 cancer types Forest plot of Cox proportional hazard ratio (HR) and 95% CI of relapse free survival (RFS) using 28 cancer types (TCGA IlluminaHiSeq_RNASeqV2, pan-cancer normalized log2(norm_counts+1) data, version 2016-08-16) (TCGA clinicalMatrix, phenotype data, version 2016-04-27) * Click on the image enlarge it in a new window. |
 |
| Top |
| TissGeneClin for CYP3A7 |
| TissGeneDrug for CYP3A7 |
 Drug information targeting TissGene Drug information targeting TissGene (DrugBank Version 5.0.6, 2017-04-01) |
| DrugBank ID | Drug name | Drug activity | Drug type | Drug status |
| Top |
| TissGeneDisease for CYP3A7 |
 Disease information associated with TissGene Disease information associated with TissGene (DisGeNet, 2016-06-01) |
| Disease ID | Disease name | # pubmeds | Source |
| umls:C0242379 | Malignant neoplasm of lung | 5 | BeFree,GAD |
| umls:C0684249 | Carcinoma of lung | 4 | BeFree |
| umls:C2239176 | Liver carcinoma | 3 | BeFree |
| umls:C0006142 | Malignant neoplasm of breast | 2 | BeFree,GAD |
| umls:C0005684 | Malignant neoplasm of urinary bladder | 1 | GAD |
| umls:C0019163 | Hepatitis B | 1 | BeFree |
| umls:C0023890 | Liver Cirrhosis | 1 | BeFree |
| umls:C0023893 | Liver Cirrhosis, Experimental | 1 | CTD_mouse |
| umls:C0023903 | Liver neoplasms | 1 | BeFree |
| umls:C0024117 | Chronic Obstructive Airway Disease | 1 | GAD |
| umls:C0027720 | Nephrosis | 1 | CTD_rat |
| umls:C0029928 | Ovarian Diseases | 1 | BeFree |
| umls:C0032460 | Polycystic Ovary Syndrome | 1 | BeFree,GAD,LHGDN |
| umls:C0153594 | Malignant neoplasm of testis | 1 | BeFree |
| umls:C0376358 | Malignant neoplasm of prostate | 1 | GAD |
| umls:C0596263 | Carcinogenesis | 1 | BeFree |
| umls:C0677886 | Epithelial ovarian cancer | 1 | GAD |
| umls:C0678222 | Breast Carcinoma | 1 | BeFree |
| umls:C0855197 | Testicular malignant germ cell tumor | 1 | BeFree |
| umls:C1623038 | Cirrhosis | 1 | BeFree |

