 |
| |
| |
| |
| |
| |
| |
|

| TissGeneSummary for CDCA2 |
 Gene summary Gene summary |
| Basic gene information | Gene symbol | CDCA2 |
| Gene name | cell division cycle associated 2 | |
| Synonyms | PPP1R81|Repo-Man | |
| Cytomap | UCSC genome browser: 8p21.2 | |
| Type of gene | protein-coding | |
| RefGenes | NM_152562.2, | |
| Description | cell division cycle-associated protein 2protein phosphatase 1 [gamma] (PPP1R3A) binding protein Repo-Manprotein phosphatase 1, regulatory subunit 81recruits PP1 onto mitotic chromatin at anaphase protein | |
| Modification date | 20141207 | |
| dbXrefs | HGNC : HGNC | |
| Ensembl : ENSG00000184661 | ||
| HPRD : 13014 | ||
| Vega : OTTHUMG00000099429 | ||
| Protein | UniProt: go to UniProt's Cross Reference DB Table | |
| Expression | CleanEX: HS_CDCA2 | |
| BioGPS: 157313 | ||
| Pathway | NCI Pathway Interaction Database: CDCA2 | |
| KEGG: CDCA2 | ||
| REACTOME: CDCA2 | ||
| Pathway Commons: CDCA2 | ||
| Context | iHOP: CDCA2 | |
| ligand binding site mutation search in PubMed: CDCA2 | ||
| UCL Cancer Institute: CDCA2 | ||
| Assigned class in TissGDB* | C | |
| Included tissue-specific gene expression resources | HPA,GTEx | |
| Specific-tissues in normal samples (assigned by TissGDB using HPA, TiGER, and GTEx) | Testis | |
| Cancer types related to the specific-tissues in cancer samples (assigned by TissGDB using TCGA) | TGCT | |
| Reference showing the relevant tissue of CDCA2 | ||
| Description by TissGene annotations | ||
| * Class A consists of genes with literature evidence and is part of the cTissGenes. Class B consists of only cTissGenes without additional evidence. The remaining genes belong to Class C. |
| Gene ontology having evidence of Inferred from Direct Assay (IDA) from Entrez |
| GO ID | GO term | PubMed ID |
| Top |
| TissGeneExp for CDCA2 |
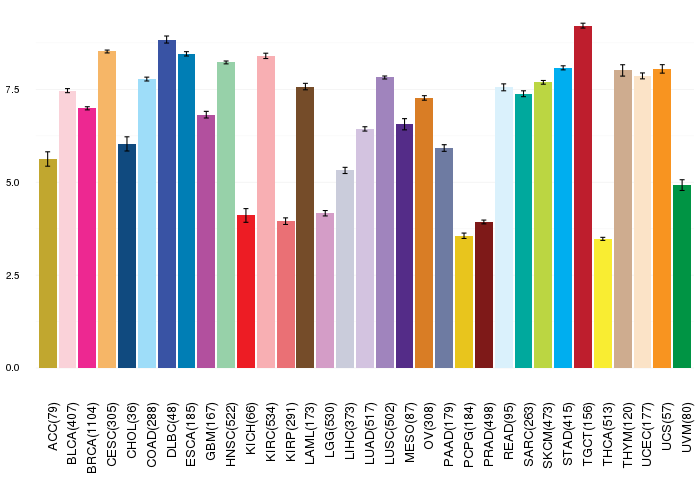
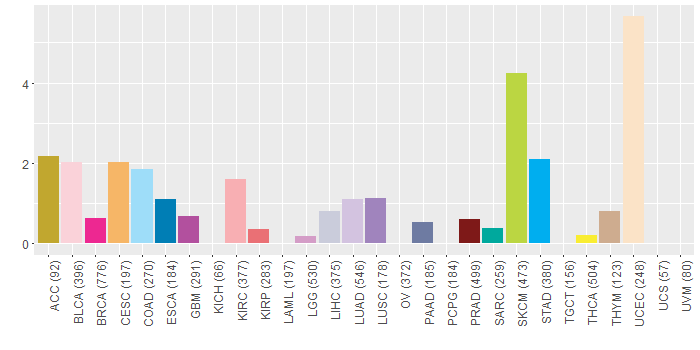
| Gene expressions across 28 cancer types (X-axis: cancer type and Y-axis: log2(norm_counts+1)) (TCGA IlluminaHiSeq_RNASeqV2, pan-cancer normalized log2(norm_counts+1) data, version 2016-08-16) |
 |
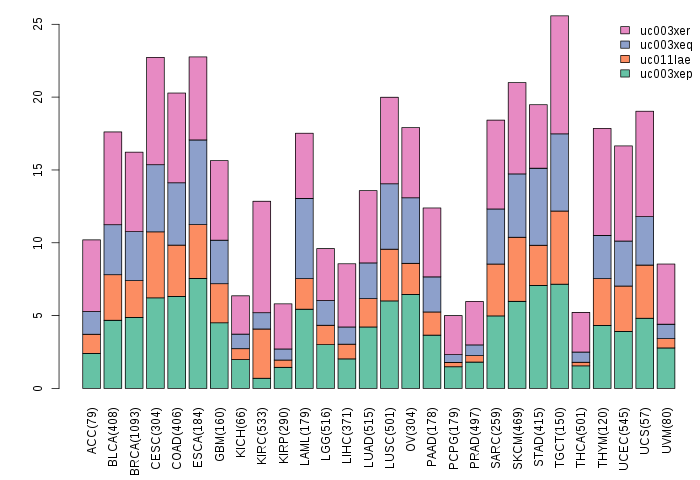
| Gene isoform expressions across 28 cancer types (X-axis: cancer type and Y-axis: log2(norm_counts+1)) (TCGA pan-cancer tcga_rsem_isoform_tpm, version 2016-09-01) |
 |
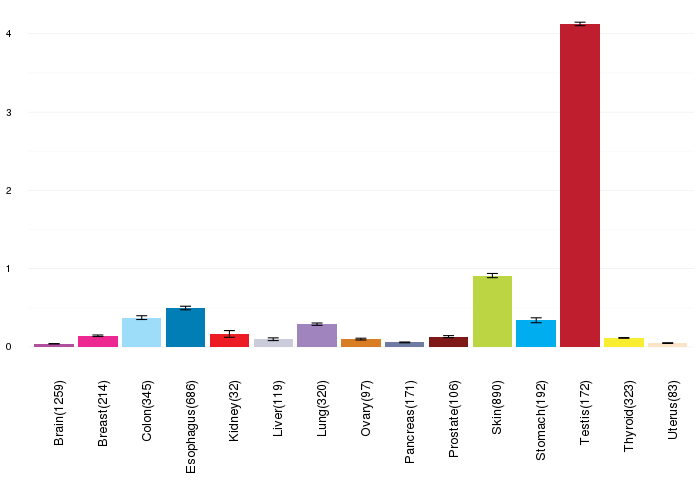
| Gene expressions across normal tissues of GTEx data (GTEx GTEx_Analysis_v6_RNA-seq_RNA-SeQCv1.1.8_gene_rpkm.gct) - Here, we shows the matched tissue types only among our 28 cancer types. |
 |
| Different expressions across 14 cancer types with more than 10 samples between matched tumors and normals (X-axis: cancer type and Y-axis: log2(norm_counts+1)) (TCGA IlluminaHiSeq_RNASeqV2, pan-cancer normalized log2(norm_counts+1) data, version 2016-08-16) |
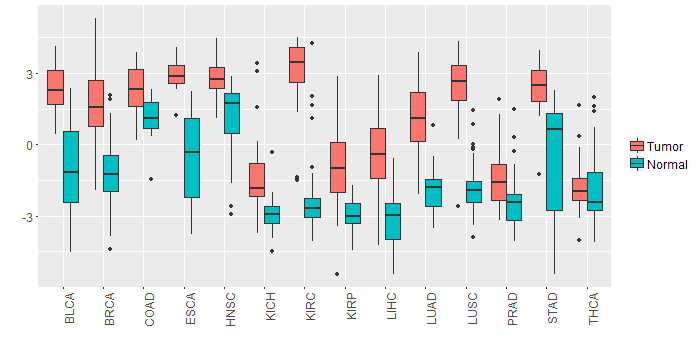 |
| - Significantly differentially expressed cancer types and information. (|Fold change|>1 and FDR<0.05) |
| Cancer type | Mean(exp) in tumor | Mean(exp) in matched normal | Log2FC | P-val. | FDR |
| COAD | 2.29543377 | 1.136903001 | 1.158530769 | 2.02E-05 | 8.59E-05 |
| LIHC | -0.343725768 | -3.148005768 | 2.80428 | 1.66E-16 | 6.83E-15 |
| STAD | 2.433065982 | -0.366309018 | 2.799375 | 2.44E-07 | 5.49E-06 |
| BLCA | 2.304601179 | -0.9628304 | 3.267431579 | 1.48E-06 | 4.45E-05 |
| PRAD | -1.451639307 | -2.452146999 | 1.000507692 | 7.17E-06 | 4.17E-05 |
| LUAD | 1.06930499 | -1.878226044 | 2.947531034 | 1.13E-23 | 3.84E-22 |
| BRCA | 1.599956442 | -1.199933031 | 2.799889474 | 1.44E-37 | 3.38E-36 |
| KIRC | 3.177955565 | -2.428819435 | 5.606775 | 1.03E-54 | 2.10E-52 |
| KIRP | -0.869584018 | -2.907880893 | 2.038296875 | 3.62E-07 | 2.00E-06 |
| HNSC | 2.800024557 | 1.203426883 | 1.596597674 | 1.29E-08 | 1.54E-07 |
| LUSC | 2.505863408 | -1.816154239 | 4.322017647 | 8.93E-36 | 1.44E-33 |
| ESCA | 2.927758595 | -0.612259586 | 3.540018182 | 0.000125 | 0.003808219 |
| KICH | -1.220889768 | -2.874149768 | 1.65326 | 0.000123 | 0.00031559 |
| Top |
| TissGene-miRNA for CDCA2 |
| Significantly anti-correlated miRNAs of TissGene across 28 cancer types (Gene-miRNA relations from TargetScanHuman Relsease 7.1, Conserved_Site_Context_Scores.txt.zip, 06.01.2016) (TCGA IlluminaHiSeq_miRNASeq, log2(RPM+1) data, version 2016-11-21) (TCGA IlluminaHiSeq_RNASeqV2, log2(normalized_count+1) data, version 2016-08-16) (Spearman’s Rank Correlation (p-value<0.05 and coefficient<-0.25)) |
| Cancer type | miRNA id | miRNA accession | P-val. | Coeff. | # samples |
| Top |
| TissGeneMut for CDCA2 |
| TissGeneSNV for CDCA2 |
| nsSNV counts per each loci. Different colors of circles represent different cancer types. Circle size denotes number of samples. (TCGA somatic mutation (SNPs and small INDELs) data, version 2016-04-25) * Click on the image to enlarge it in a new window. |
 |
 |
| Somatic nucleotide variants of TissGene across 28 cancer types (X-axis: cancer type and Y-axis: % of mutated samples) The numbers in parentheses are numbers of samples with mutation (nsSNVs). (TCGA somatic mutation (SNPs and small INDELs) data, version 2016-04-25) |
 |
| - nsSNVs sorted by frequency. |
| AAchange | Cancer type | # samples |
| p.R328C | SKCM | 2 |
| p.T941A | UCEC | 1 |
| p.N847I | CHOL | 1 |
| p.R90H | STAD | 1 |
| p.G742V | KIRC | 1 |
| p.F193L | BRCA | 1 |
| p.S359I | LUAD | 1 |
| p.S247L | BLCA | 1 |
| p.S126Y | UCEC | 1 |
| p.P957A | BRCA | 1 |
| p.H648Q | KIRC | 1 |
| p.K535N | COAD | 1 |
| p.Y351X | THCA | 1 |
| p.R89Q | CESC | 1 |
| p.D230H | CESC | 1 |
| p.G396E | SKCM | 1 |
| p.Q530* | SKCM | 1 |
| p.D353E | SKCM | 1 |
| p.R827G | KIRC | 1 |
| p.S210Y | KIRC | 1 |
| p.E270G | LIHC | 1 |
| p.H850Y | SKCM | 1 |
| p.A217V | LGG | 1 |
| p.A466V | KIRC | 1 |
| p.R110W | GBM | 1 |
| p.V307F | LUAD | 1 |
| p.I246V | KIRC | 1 |
| p.S81L | UCEC | 1 |
| p.R142K | KIRP | 1 |
| p.G223S | STAD | 1 |
| p.K371R | ESCA | 1 |
| p.G184V | LUAD | 1 |
| p.S666P | SARC | 1 |
| p.R883S | LUAD | 1 |
| p.R832H | HNSC | 1 |
| p.D768G | STAD | 1 |
| p.S481L | SKCM | 1 |
| p.S666F | SKCM | 1 |
| p.S1008F | SKCM | 1 |
| p.S407Y | GBM | 1 |
| p.M387V | BRCA | 1 |
| p.A151D | LUSC | 1 |
| p.P911S | SKCM | 1 |
| p.R640C | UCEC | 1 |
| p.E260K | CESC | 1 |
| p.A39V | CHOL | 1 |
| p.E70G | UCEC | 1 |
| p.S481L | BLCA | 1 |
| p.D125H | BRCA | 1 |
| p.R640C | ESCA | 1 |
| p.A151S | LUSC | 1 |
| p.R884S | COAD | 1 |
| p.R1014M | STAD | 1 |
| p.P911S | BRCA | 1 |
| p.P358L | SKCM | 1 |
| p.E940* | UCEC | 1 |
| p.F167L | UCEC | 1 |
| p.K705R | UCEC | 1 |
| p.X1024Y | SKCM | 1 |
| p.Y351* | THCA | 1 |
| p.A551T | LUAD | 1 |
| p.E175K | UCEC | 1 |
| p.K546R | LUAD | 1 |
| p.S5* | CESC | 1 |
| p.P471T | BLCA | 1 |
| p.Q64R | SKCM | 1 |
| p.S674F | SKCM | 1 |
| p.Q225R | LIHC | 1 |
| p.K337N | UCEC | 1 |
| p.L1009V | HNSC | 1 |
| p.T801M | STAD | 1 |
| p.D655Y | UCEC | 1 |
| p.C714F | ACC | 1 |
| p.T989A | STAD | 1 |
| p.P127T | THYM | 1 |
| p.A236T | STAD | 1 |
| p.I908V | STAD | 1 |
| p.K535N | UCEC | 1 |
| p.E534X | READ | 1 |
| p.R891X | COAD | 1 |
| p.S833F | SKCM | 1 |
| p.S174F | SKCM | 1 |
| p.S80* | UCEC | 1 |
| p.R610Q | SKCM | 1 |
| p.H850R | UCEC | 1 |
| p.Y135H | STAD | 1 |
| p.D644E | KIRC | 1 |
| p.S24C | LUSC | 1 |
| p.D709N | BLCA | 1 |
| p.R1021T | BLCA | 1 |
| p.E799K | UCEC | 1 |
| p.K416I | PRAD | 1 |
| p.A694T | PAAD | 1 |
| p.C46Y | COAD | 1 |
| p.S431F | SKCM | 1 |
| p.R203K | BLCA | 1 |
| p.R509I | HNSC | 1 |
| p.P121S | SKCM | 1 |
| p.S668L | SKCM | 1 |
| p.S474* | UCEC | 1 |
| p.V717I | COAD | 1 |
| p.F752L | UCEC | 1 |
| p.N348I | PRAD | 1 |
| p.M950V | UCEC | 1 |
| p.P913L | SKCM | 1 |
| p.R328C | PAAD | 1 |
| p.E598Q | BLCA | 1 |
| p.N688H | PRAD | 1 |
| p.A773T | ACC | 1 |
| p.R110W | UCEC | 1 |
| p.V33A | STAD | 1 |
| p.R89L | LIHC | 1 |
| p.R142I | BLCA | 1 |
| Top |
| TissGeneCNV for CDCA2 |
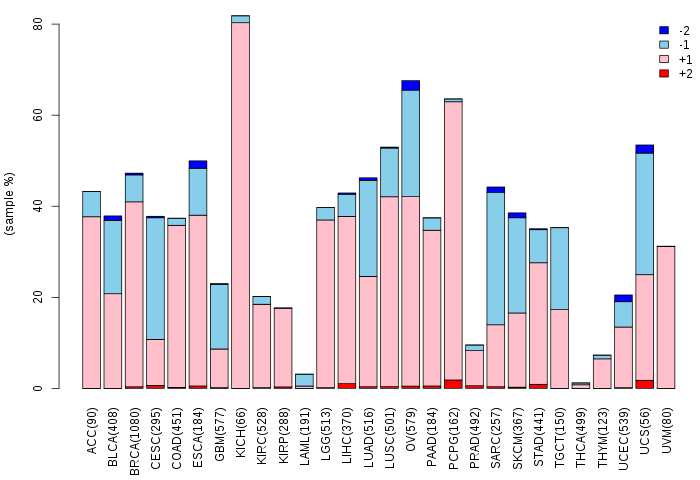
| Copy number variations of TissGene across 28 cancer types (X-axis: cancer type and Y-axis: % of CNV samples) (TCGA Gistic2_CopyNumber_Gistic2_all_data_by_genes, Gistic2 copy number data, version 2016-08-16) |
 |
| Top |
| TissGeneFusions for CDCA2 |
| Fusion genes including TissGene (ChimerDB 3.0, 2016-12-01 and TCGA fusion Portal 2015-12-01) |
| Database | Src | Cancer type | Sample | Fusion gene | ORF | 5'-gene BP | 3'-gene BP |
| TCGAfusionPortal | PRADA | BRCA | TCGA-LL-A440-01A | CDCA2-ADAM28 | Out-of-frame | Chr8:25361060 | Chr8:24167407 |
| Top |
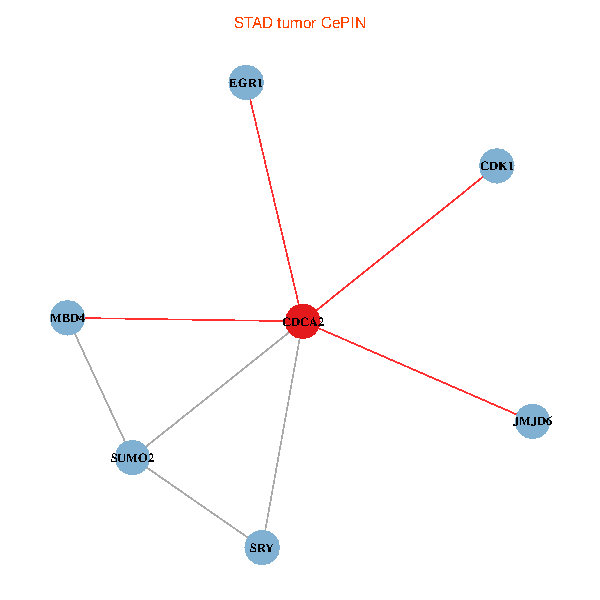
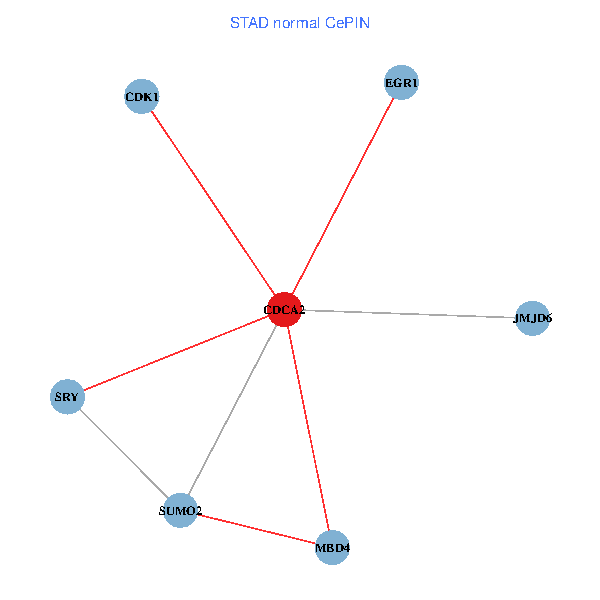
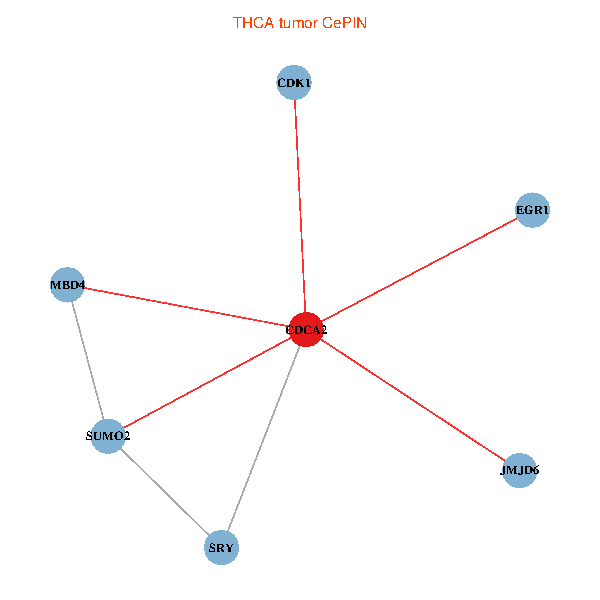
| TissGeneNet for CDCA2 |
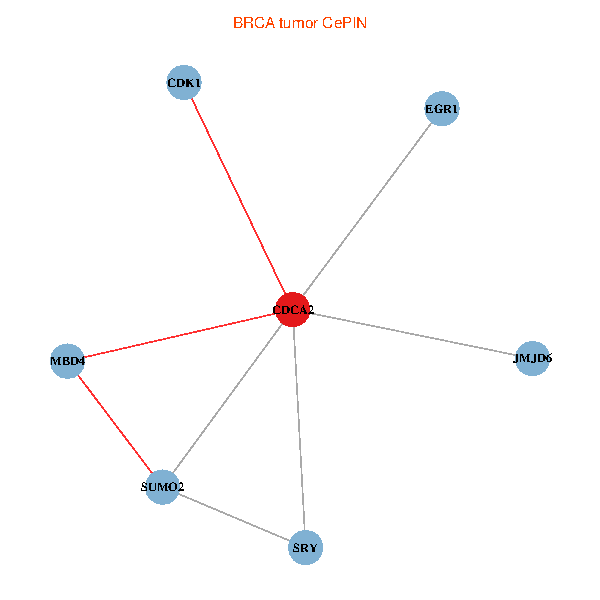
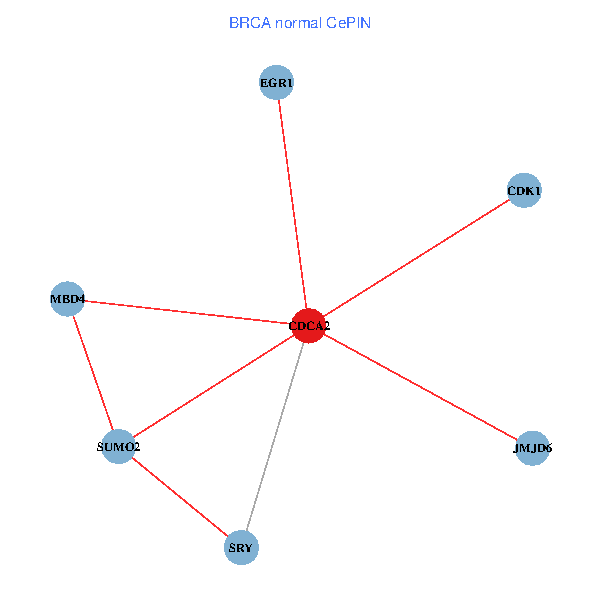
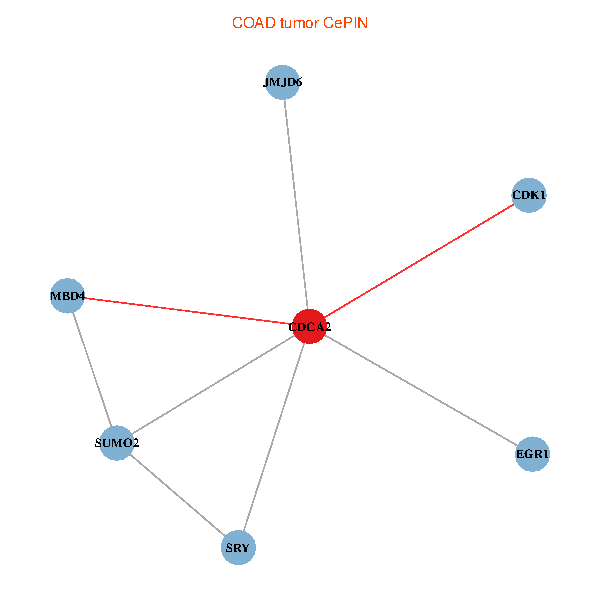
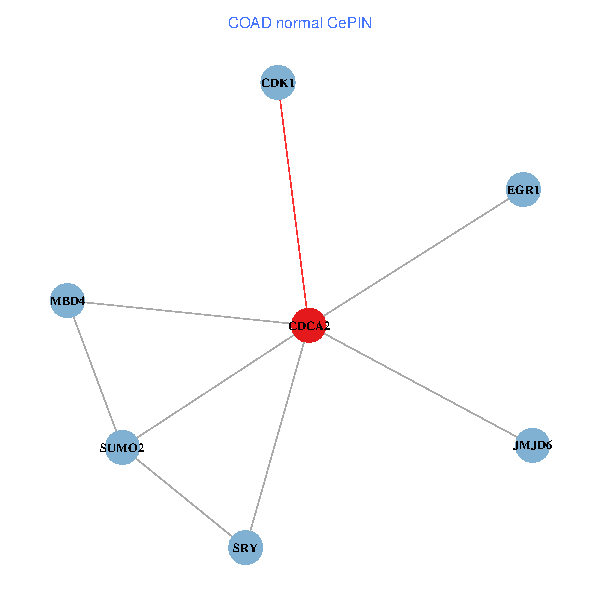
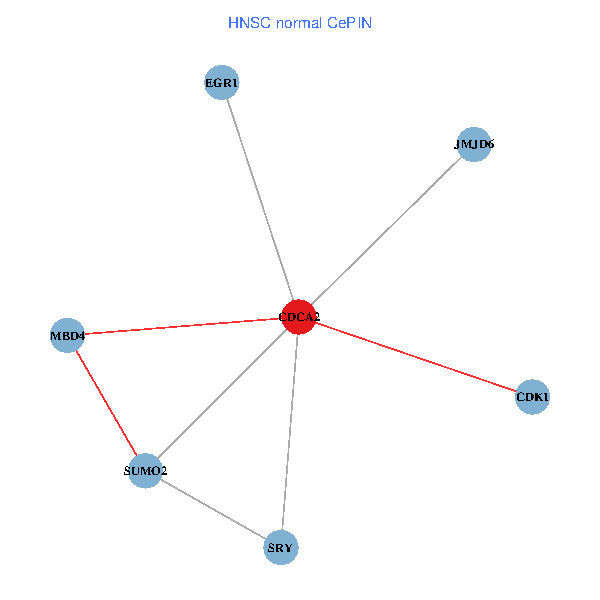
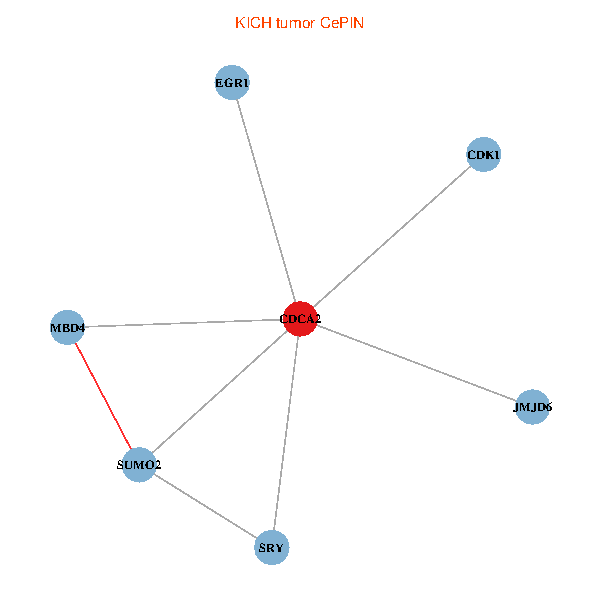
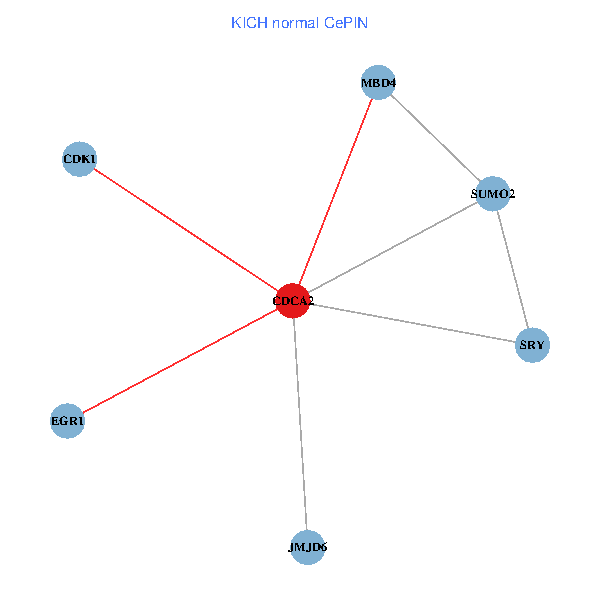
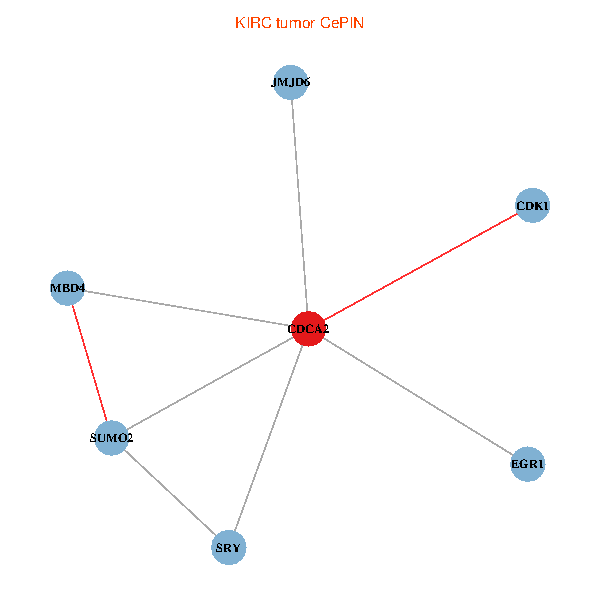
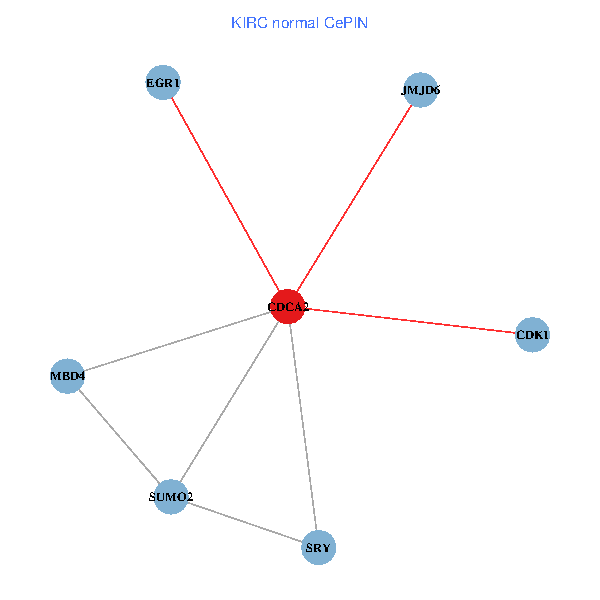
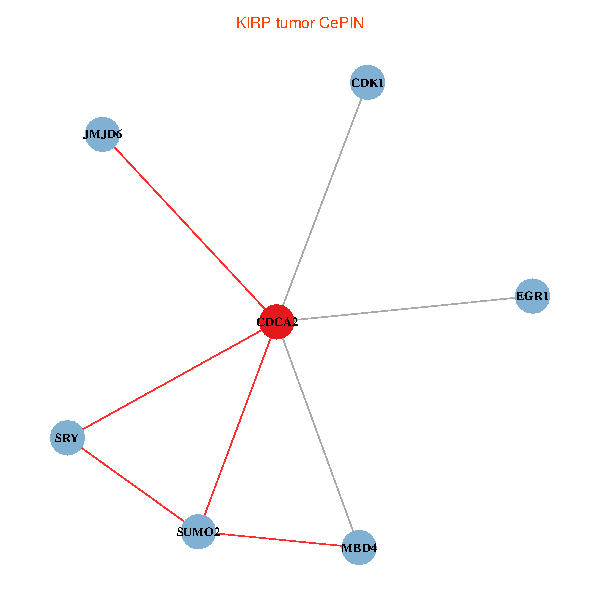
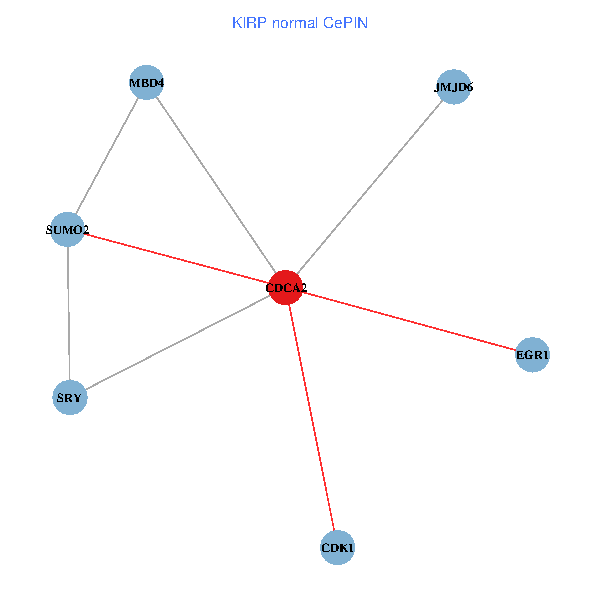
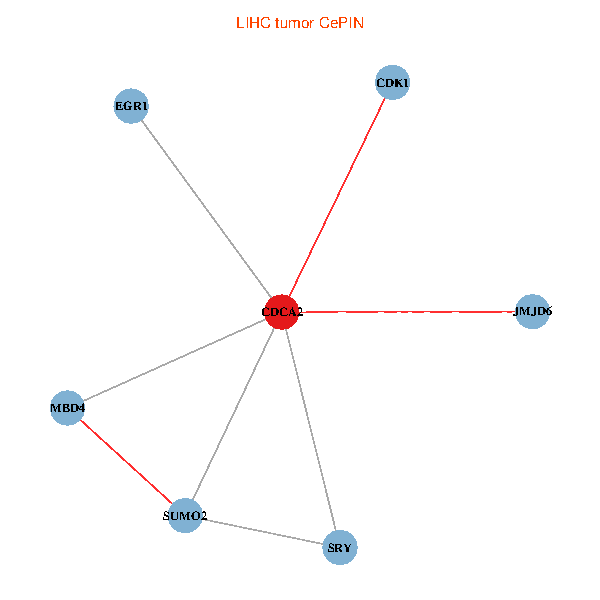
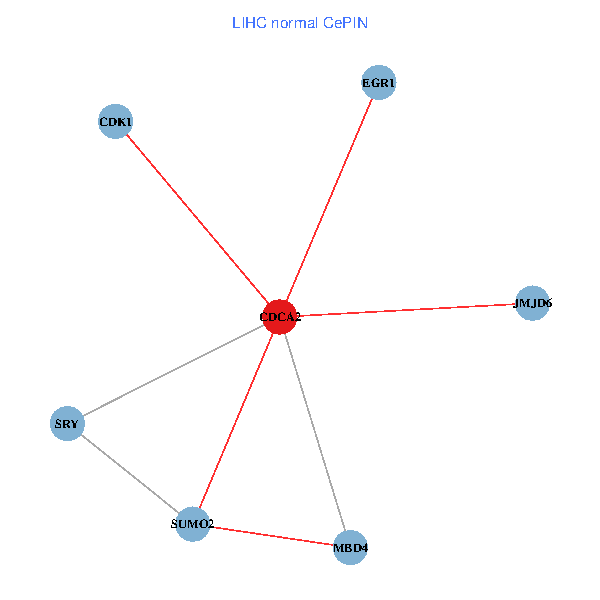
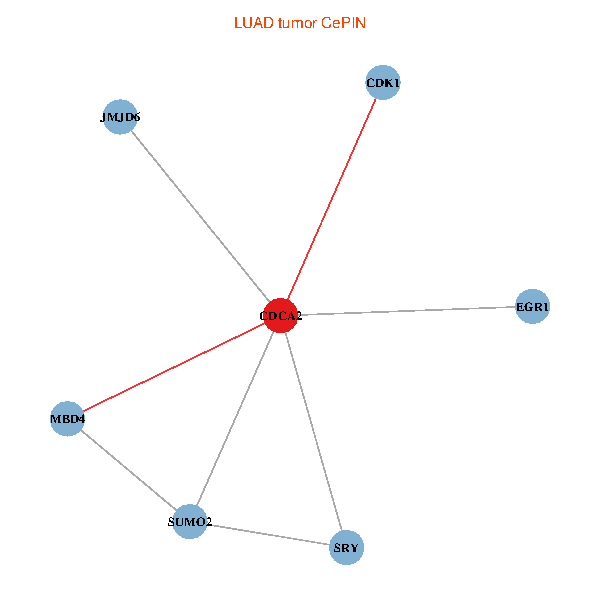
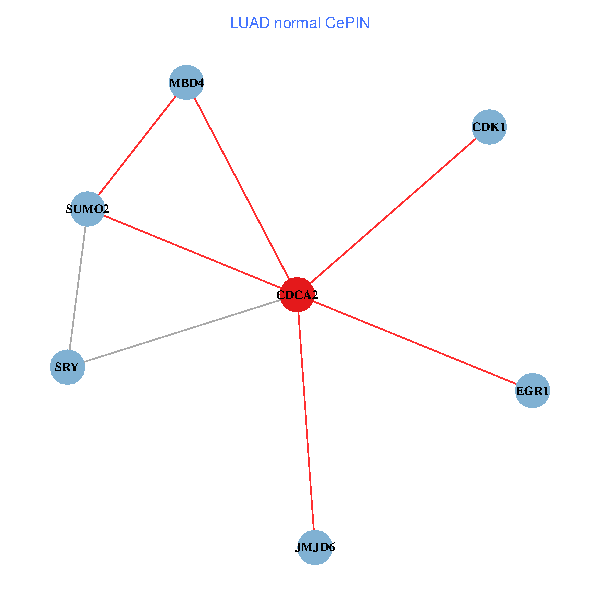
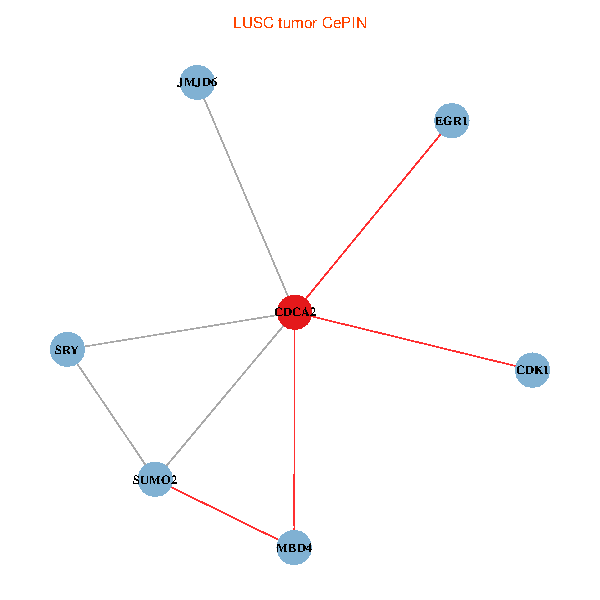
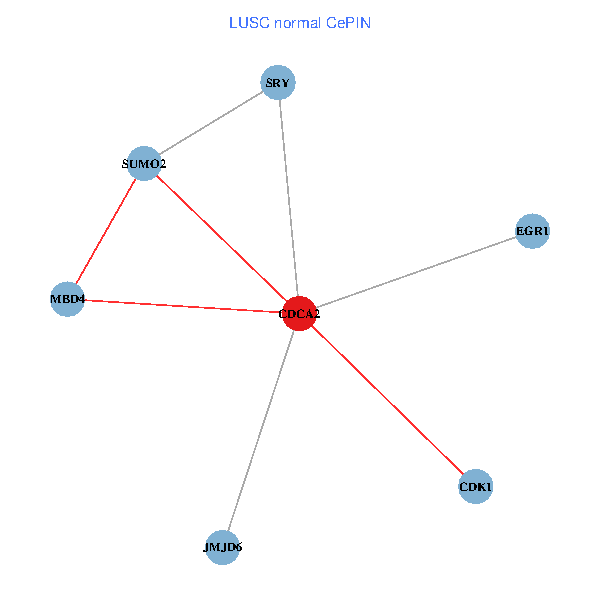
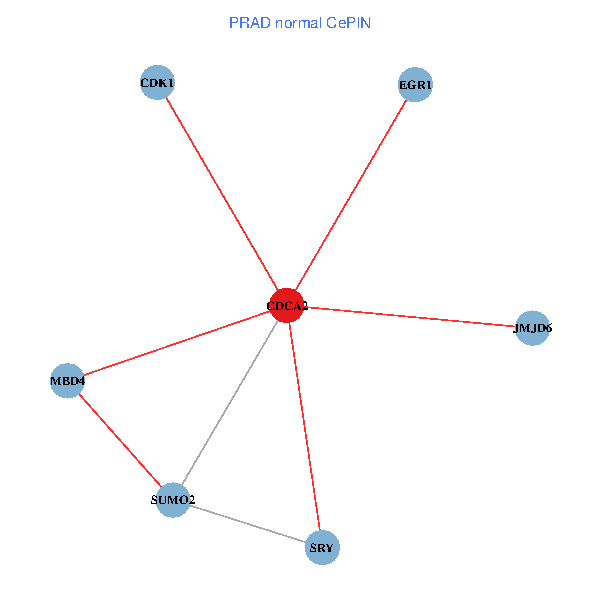
| Co-expressed gene networks based on protein-protein interaction data (CePIN) (TCGA IlluminaHiSeq_RNASeqV2, pan-cancer normalized log2(norm_counts+1) data, version 2016-08-16) (PINA2 ppi data) |
| BRCA (tumor) | BRCA (normal) |
| CDCA2, JMJD6, SUMO2, CDK1, EGR1, SRY, MBD4 (tumor) | CDCA2, JMJD6, SUMO2, CDK1, EGR1, SRY, MBD4 (normal) |
 |  |
| COAD (tumor) | COAD (normal) |
| CDCA2, JMJD6, SUMO2, CDK1, EGR1, SRY, MBD4 (tumor) | CDCA2, JMJD6, SUMO2, CDK1, EGR1, SRY, MBD4 (normal) |
 |  |
| HNSC (tumor) | HNSC (normal) |
| CDCA2, JMJD6, SUMO2, CDK1, EGR1, SRY, MBD4 (tumor) | CDCA2, JMJD6, SUMO2, CDK1, EGR1, SRY, MBD4 (normal) |
 |  |
| KICH (tumor) | KICH (normal) |
| CDCA2, JMJD6, SUMO2, CDK1, EGR1, SRY, MBD4 (tumor) | CDCA2, JMJD6, SUMO2, CDK1, EGR1, SRY, MBD4 (normal) |
 |  |
| KIRC (tumor) | KIRC (normal) |
| CDCA2, JMJD6, SUMO2, CDK1, EGR1, SRY, MBD4 (tumor) | CDCA2, JMJD6, SUMO2, CDK1, EGR1, SRY, MBD4 (normal) |
 |  |
| KIRP (tumor) | KIRP (normal) |
| CDCA2, JMJD6, SUMO2, CDK1, EGR1, SRY, MBD4 (tumor) | CDCA2, JMJD6, SUMO2, CDK1, EGR1, SRY, MBD4 (normal) |
 |  |
| LIHC (tumor) | LIHC (normal) |
| CDCA2, JMJD6, SUMO2, CDK1, EGR1, SRY, MBD4 (tumor) | CDCA2, JMJD6, SUMO2, CDK1, EGR1, SRY, MBD4 (normal) |
 |  |
| LUAD (tumor) | LUAD (normal) |
| CDCA2, JMJD6, SUMO2, CDK1, EGR1, SRY, MBD4 (tumor) | CDCA2, JMJD6, SUMO2, CDK1, EGR1, SRY, MBD4 (normal) |
 |  |
| LUSC (tumor) | LUSC (normal) |
| CDCA2, JMJD6, SUMO2, CDK1, EGR1, SRY, MBD4 (tumor) | CDCA2, JMJD6, SUMO2, CDK1, EGR1, SRY, MBD4 (normal) |
 |  |
| PRAD (tumor) | PRAD (normal) |
| CDCA2, JMJD6, SUMO2, CDK1, EGR1, SRY, MBD4 (tumor) | CDCA2, JMJD6, SUMO2, CDK1, EGR1, SRY, MBD4 (normal) |
 |  |
| STAD (tumor) | STAD (normal) |
| CDCA2, JMJD6, SUMO2, CDK1, EGR1, SRY, MBD4 (tumor) | CDCA2, JMJD6, SUMO2, CDK1, EGR1, SRY, MBD4 (normal) |
 |  |
| THCA (tumor) | THCA (normal) |
| CDCA2, JMJD6, SUMO2, CDK1, EGR1, SRY, MBD4 (tumor) | CDCA2, JMJD6, SUMO2, CDK1, EGR1, SRY, MBD4 (normal) |
 |  |
| Top |
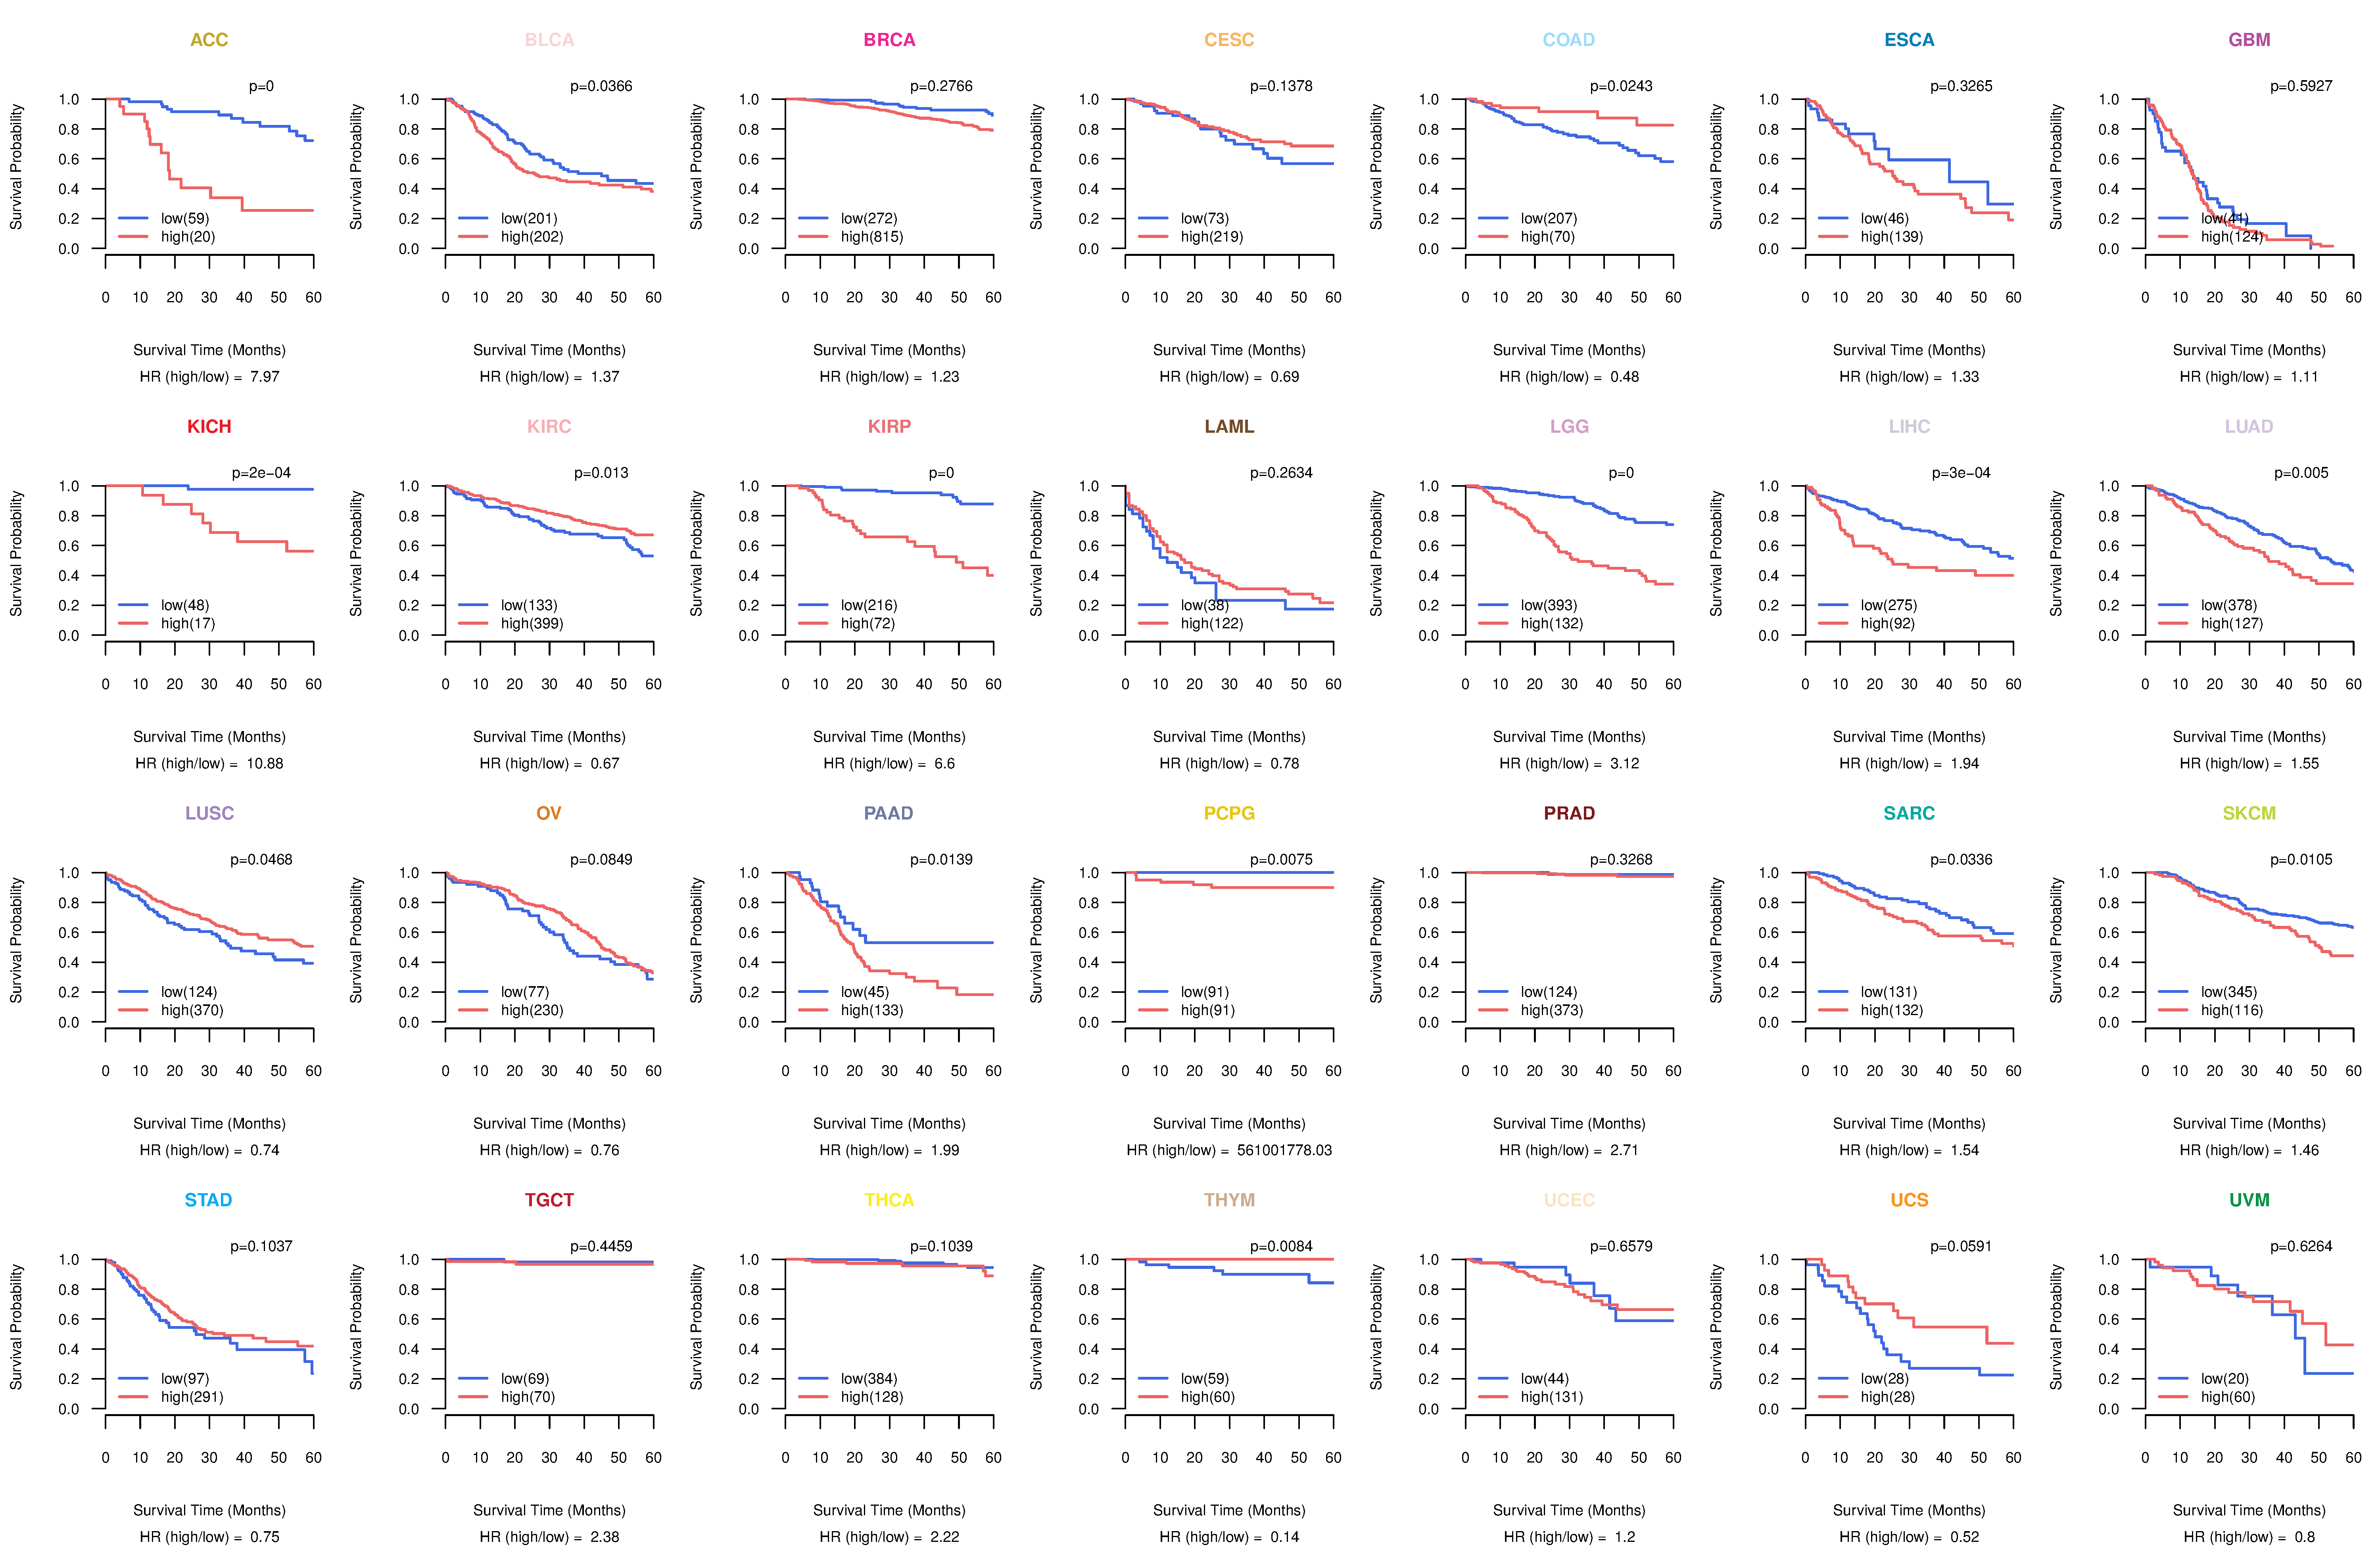
| TissGeneProg for CDCA2 |
| Kaplan-Meier plots with logrank tests of overall survival (OS) using 28 cancer types (TCGA IlluminaHiSeq_RNASeqV2, pan-cancer normalized log2(norm_counts+1) data, version 2016-08-16) (TCGA clinicalMatrix, phenotype data, version 2016-04-27) * Click on the image to enlarge it in a new window. |
 |
| Kaplan-Meier plots with logrank test of relapse free survival (RFS) using 28 cancer types (TCGA IlluminaHiSeq_RNASeqV2, pan-cancer normalized log2(norm_counts+1) data, version 2016-08-16) (TCGA clinicalMatrix, phenotype data, version 2016-04-27) * Click on the image enlarge it in a new window. |
 |
| Forest plot of Cox proportional hazard ratio (HR) and 95% CI of overall survival (OS) using 28 cancer types (TCGA IlluminaHiSeq_RNASeqV2, pan-cancer normalized log2(norm_counts+1) data, version 2016-08-16) (TCGA clinicalMatrix, phenotype data, version 2016-04-27) * Click on the image enlarge it in a new window. |
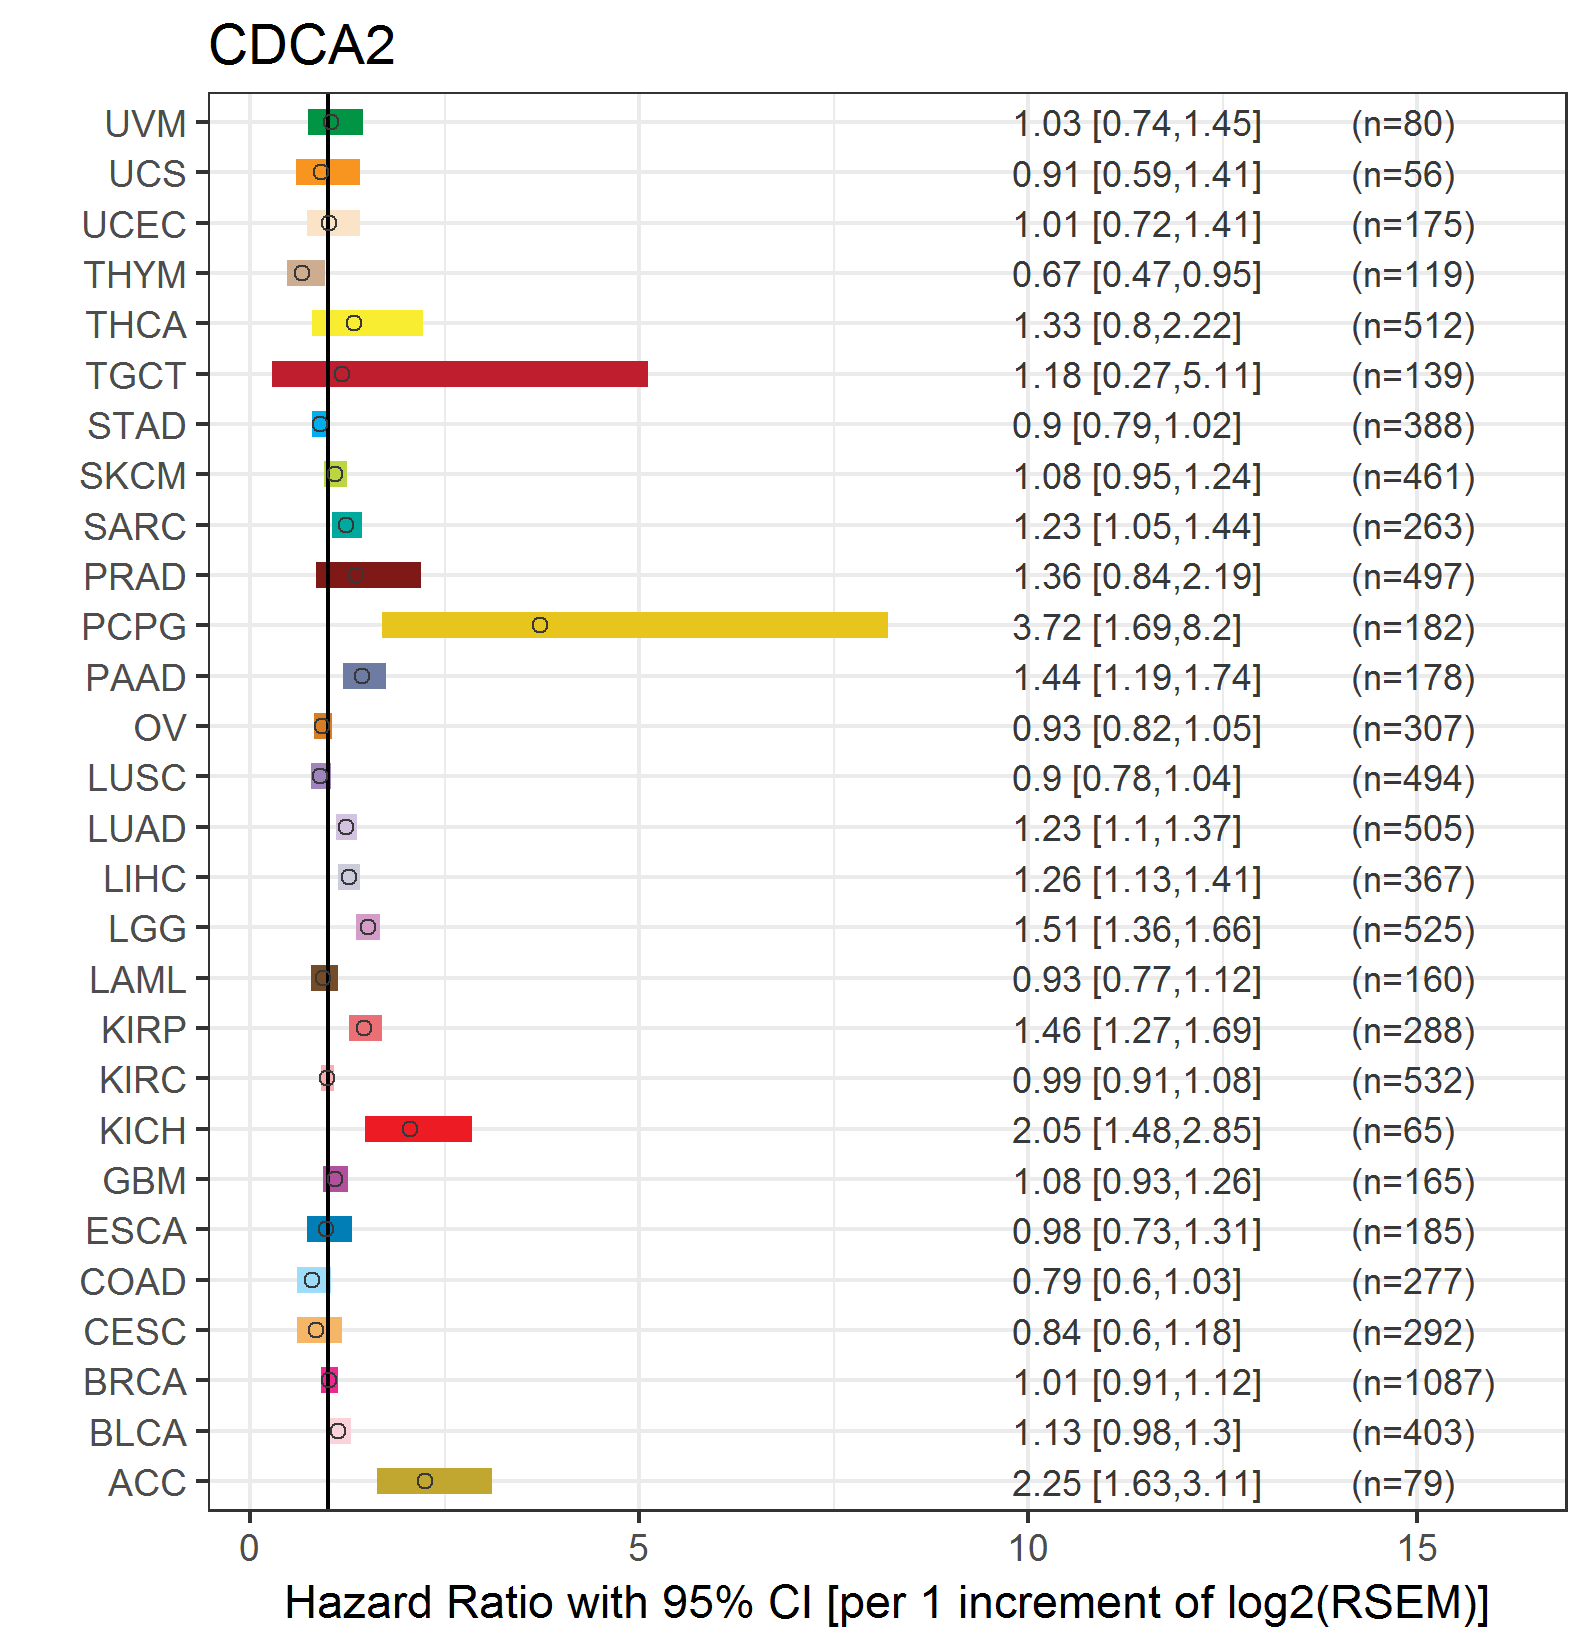 |
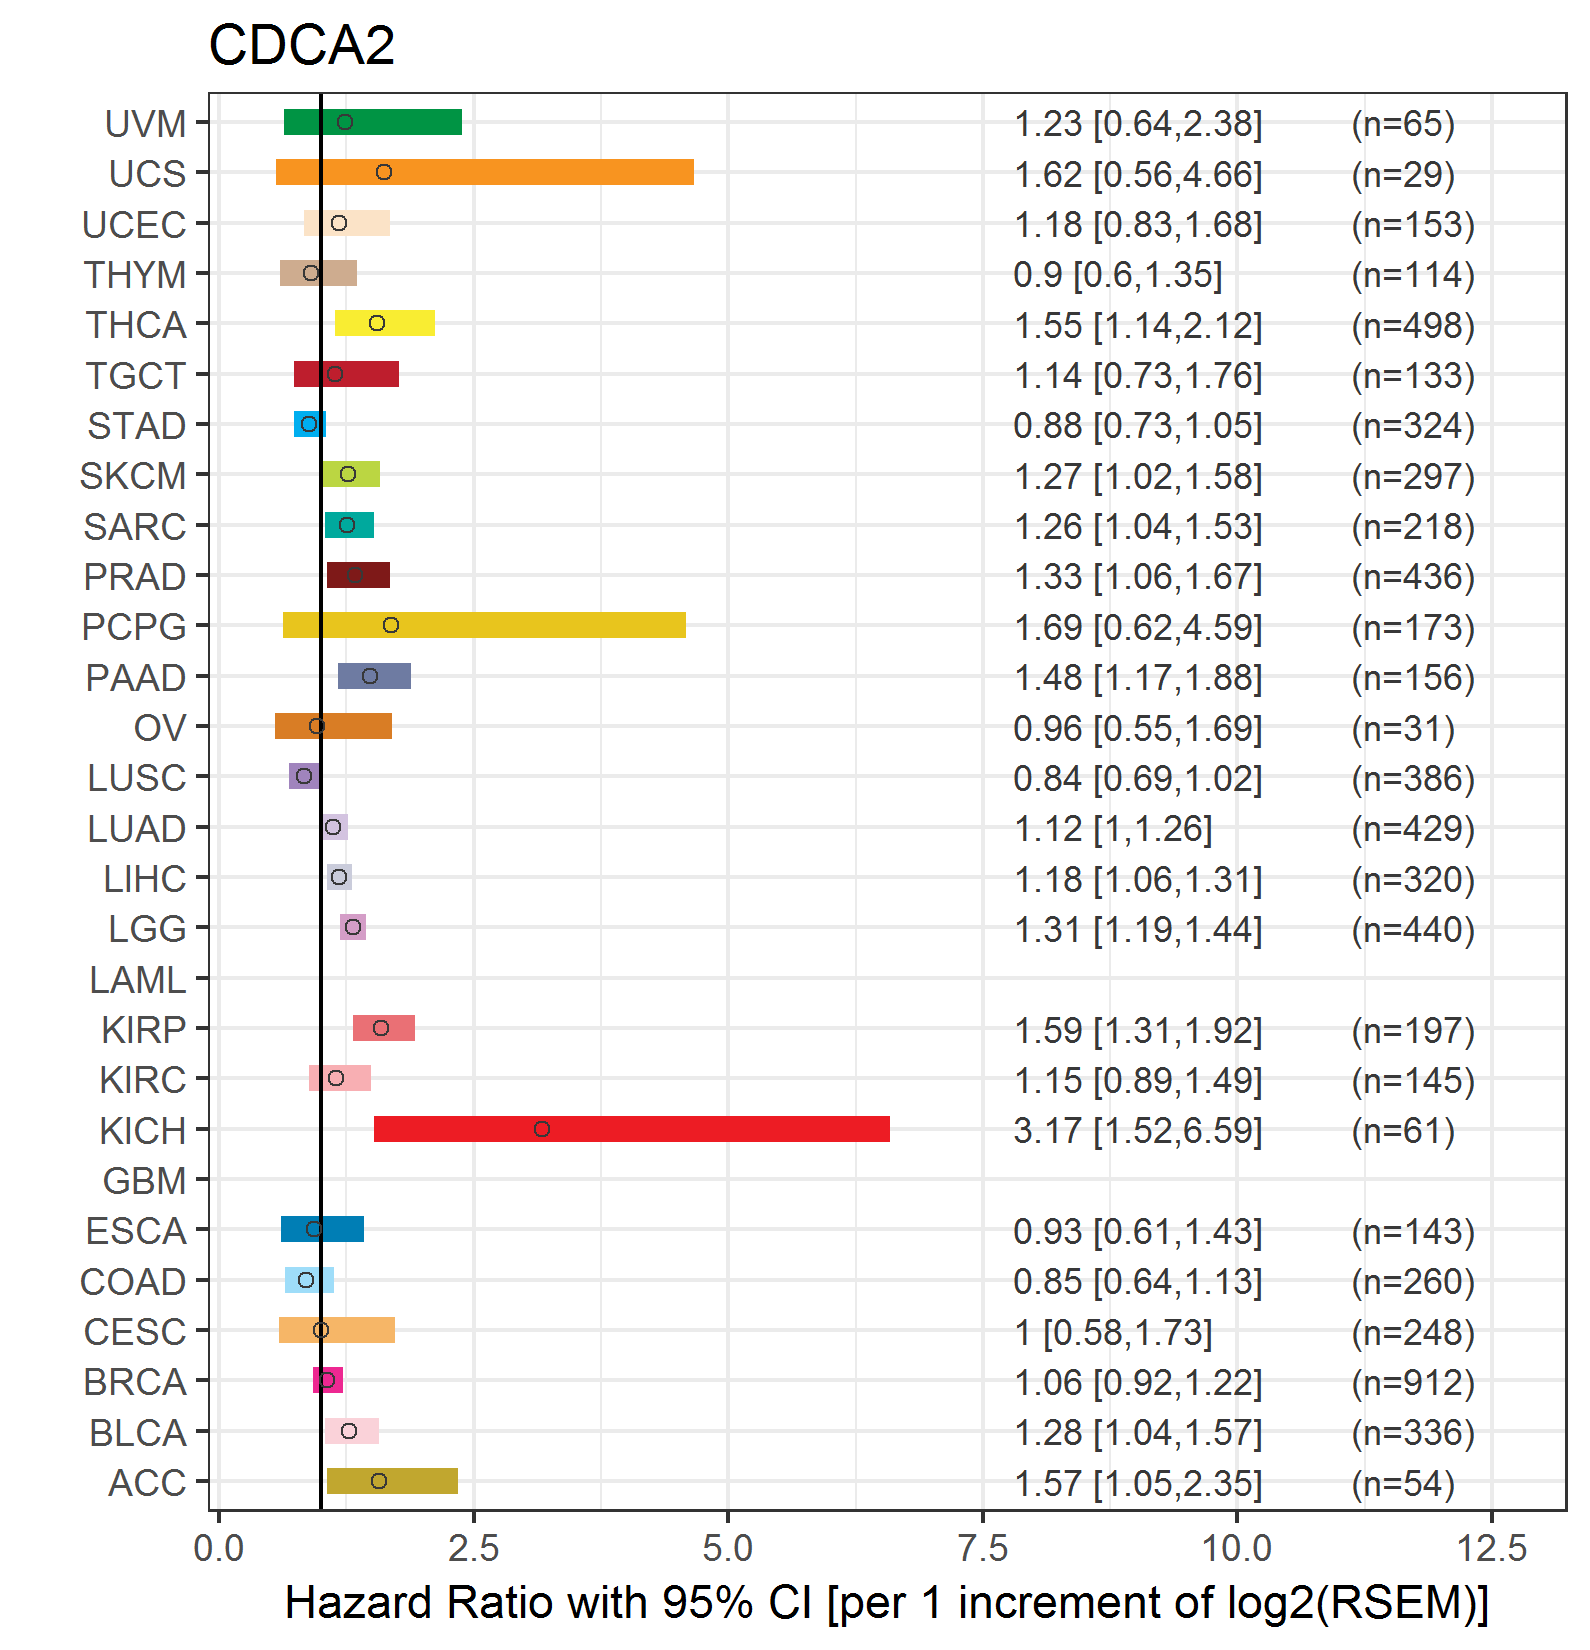
| Forest plot of Cox proportional hazard ratio (HR) and 95% CI of relapse free survival (RFS) using 28 cancer types (TCGA IlluminaHiSeq_RNASeqV2, pan-cancer normalized log2(norm_counts+1) data, version 2016-08-16) (TCGA clinicalMatrix, phenotype data, version 2016-04-27) * Click on the image enlarge it in a new window. |
 |
| Top |
| TissGeneClin for CDCA2 |
| TissGeneDrug for CDCA2 |
| Drug information targeting TissGene (DrugBank Version 5.0.6, 2017-04-01) |
| DrugBank ID | Drug name | Drug activity | Drug type | Drug status |
| Top |
| TissGeneDisease for CDCA2 |
| Disease information associated with TissGene (DisGeNet, 2016-06-01) |
| Disease ID | Disease name | # pubmeds | Source |
| umls:C0178874 | Tumor Progression | 2 | BeFree |
| umls:C0007137 | Squamous cell carcinoma | 1 | BeFree |
| umls:C0025202 | melanoma | 1 | BeFree |
| umls:C0027627 | Neoplasm Metastasis | 1 | BeFree |
| umls:C0031117 | Peripheral Neuropathy | 1 | CTD_human |
| umls:C0040336 | Tobacco Use Disorder | 1 | GAD |
|
Copyright 2016-Present - The University of Texas Health Science Center at Houston (UTHealth) Web File Viewing | How to Report, Fraud, Waste and Abuse | State of Texas | Statewide Search | Texas Homeland Security | Site Policies |