 |
| |
| |
| |
| |
| |
| |
|

| TissGeneSummary for ODF3L1 |
 Gene summary Gene summary |
| Basic gene information | Gene symbol | ODF3L1 |
| Gene name | outer dense fiber of sperm tails 3-like 1 | |
| Synonyms | - | |
| Cytomap | UCSC genome browser: 15q24.2 | |
| Type of gene | protein-coding | |
| RefGenes | NM_175881.3, | |
| Description | outer dense fiber protein 3-like protein 1 | |
| Modification date | 20141207 | |
| dbXrefs | HGNC : HGNC | |
| Ensembl : ENSG00000182950 | ||
| HPRD : 11360 | ||
| Vega : OTTHUMG00000142837 | ||
| Protein | UniProt: go to UniProt's Cross Reference DB Table | |
| Expression | CleanEX: HS_ODF3L1 | |
| BioGPS: 161753 | ||
| Pathway | NCI Pathway Interaction Database: ODF3L1 | |
| KEGG: ODF3L1 | ||
| REACTOME: ODF3L1 | ||
| Pathway Commons: ODF3L1 | ||
| Context | iHOP: ODF3L1 | |
| ligand binding site mutation search in PubMed: ODF3L1 | ||
| UCL Cancer Institute: ODF3L1 | ||
| Assigned class in TissGDB* | C | |
| Included tissue-specific gene expression resources | HPA,GTEx | |
| Specific-tissues in normal samples (assigned by TissGDB using HPA, TiGER, and GTEx) | Testis | |
| Cancer types related to the specific-tissues in cancer samples (assigned by TissGDB using TCGA) | TGCT | |
| Reference showing the relevant tissue of ODF3L1 | ||
| Description by TissGene annotations | ||
| * Class A consists of genes with literature evidence and is part of the cTissGenes. Class B consists of only cTissGenes without additional evidence. The remaining genes belong to Class C. |
| Gene ontology having evidence of Inferred from Direct Assay (IDA) from Entrez |
| GO ID | GO term | PubMed ID |
| Top |
| TissGeneExp for ODF3L1 |
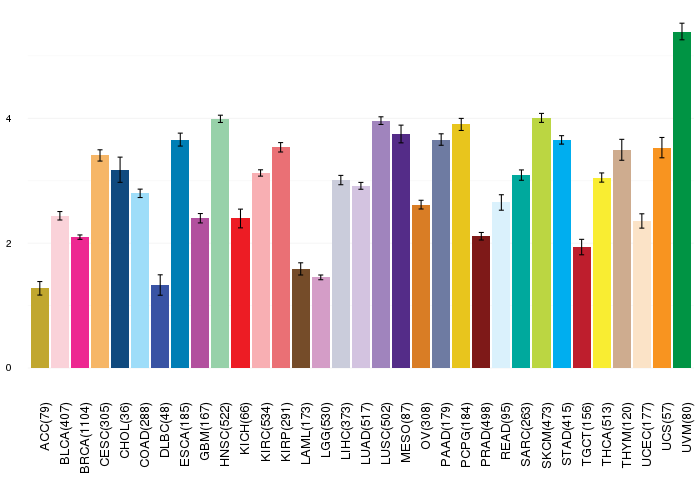
| Gene expressions across 28 cancer types (X-axis: cancer type and Y-axis: log2(norm_counts+1)) (TCGA IlluminaHiSeq_RNASeqV2, pan-cancer normalized log2(norm_counts+1) data, version 2016-08-16) |
 |
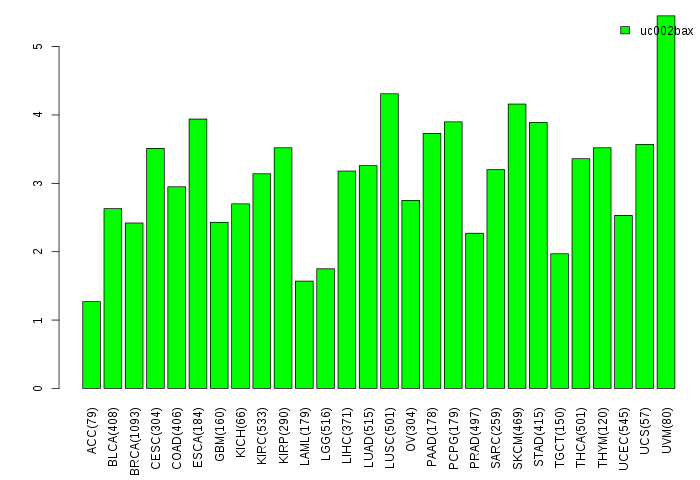
| Gene isoform expressions across 28 cancer types (X-axis: cancer type and Y-axis: log2(norm_counts+1)) (TCGA pan-cancer tcga_rsem_isoform_tpm, version 2016-09-01) |
 |
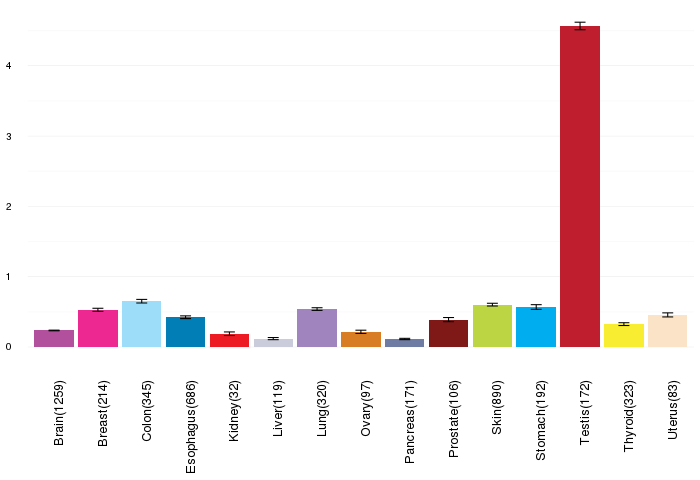
| Gene expressions across normal tissues of GTEx data (GTEx GTEx_Analysis_v6_RNA-seq_RNA-SeQCv1.1.8_gene_rpkm.gct) - Here, we shows the matched tissue types only among our 28 cancer types. |
 |
| Different expressions across 14 cancer types with more than 10 samples between matched tumors and normals (X-axis: cancer type and Y-axis: log2(norm_counts+1)) (TCGA IlluminaHiSeq_RNASeqV2, pan-cancer normalized log2(norm_counts+1) data, version 2016-08-16) |
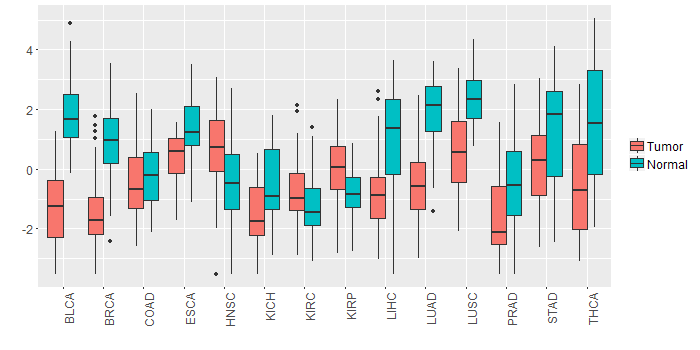 |
| - Significantly differentially expressed cancer types and information. (|Fold change|>1 and FDR<0.05) |
| Cancer type | Mean(exp) in tumor | Mean(exp) in matched normal | Log2FC | P-val. | FDR |
| LUSC | 0.528715408 | 2.341950702 | -1.813235294 | 2.48E-11 | 9.94E-11 |
| BLCA | -1.238256935 | 1.953895697 | -3.192152632 | 5.01E-09 | 5.86E-07 |
| BRCA | -1.54229904 | 0.871214118 | -2.413513158 | 8.35E-39 | 2.27E-37 |
| LIHC | -0.760538513 | 0.955361487 | -1.7159 | 2.50E-07 | 1.57E-06 |
| THCA | -0.55385292 | 1.533145385 | -2.086998305 | 2.78E-09 | 1.51E-08 |
| LUAD | -0.486541962 | 1.918559762 | -2.405101724 | 6.25E-20 | 1.24E-18 |
| STAD | 0.174877112 | 1.274236487 | -1.099359375 | 0.0105 | 0.035833839 |
| PRAD | -1.54661159 | -0.478853898 | -1.067757692 | 0.000245 | 0.000935341 |
| HNSC | 0.706802184 | -0.452069909 | 1.158872093 | 8.02E-05 | 0.000367515 |
| Top |
| TissGene-miRNA for ODF3L1 |
| Significantly anti-correlated miRNAs of TissGene across 28 cancer types (Gene-miRNA relations from TargetScanHuman Relsease 7.1, Conserved_Site_Context_Scores.txt.zip, 06.01.2016) (TCGA IlluminaHiSeq_miRNASeq, log2(RPM+1) data, version 2016-11-21) (TCGA IlluminaHiSeq_RNASeqV2, log2(normalized_count+1) data, version 2016-08-16) (Spearman’s Rank Correlation (p-value<0.05 and coefficient<-0.25)) |
| Cancer type | miRNA id | miRNA accession | P-val. | Coeff. | # samples |
| Top |
| TissGeneMut for ODF3L1 |
| TissGeneSNV for ODF3L1 |
| nsSNV counts per each loci. Different colors of circles represent different cancer types. Circle size denotes number of samples. (TCGA somatic mutation (SNPs and small INDELs) data, version 2016-04-25) * Click on the image to enlarge it in a new window. |
 |
 |
| Somatic nucleotide variants of TissGene across 28 cancer types (X-axis: cancer type and Y-axis: % of mutated samples) The numbers in parentheses are numbers of samples with mutation (nsSNVs). (TCGA somatic mutation (SNPs and small INDELs) data, version 2016-04-25) |
 |
| - nsSNVs sorted by frequency. |
| AAchange | Cancer type | # samples |
| p.L69M | STAD | 1 |
| p.G197R | HNSC | 1 |
| p.V151A | STAD | 1 |
| p.V11A | LUAD | 1 |
| p.R206* | ESCA | 1 |
| p.I259M | LUAD | 1 |
| p.P207T | HNSC | 1 |
| p.R273H | KIRC | 1 |
| p.P172H | STAD | 1 |
| p.P103L | SKCM | 1 |
| p.T256A | SKCM | 1 |
| p.R147H | STAD | 1 |
| p.P201H | STAD | 1 |
| p.A226T | READ | 1 |
| p.R206X | ESCA | 1 |
| p.M35I | SKCM | 1 |
| p.N155S | BLCA | 1 |
| p.P103S | SKCM | 1 |
| p.D153N | BLCA | 1 |
| Top |
| TissGeneCNV for ODF3L1 |
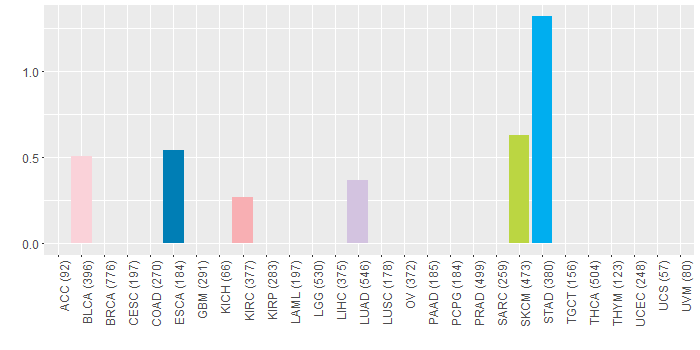
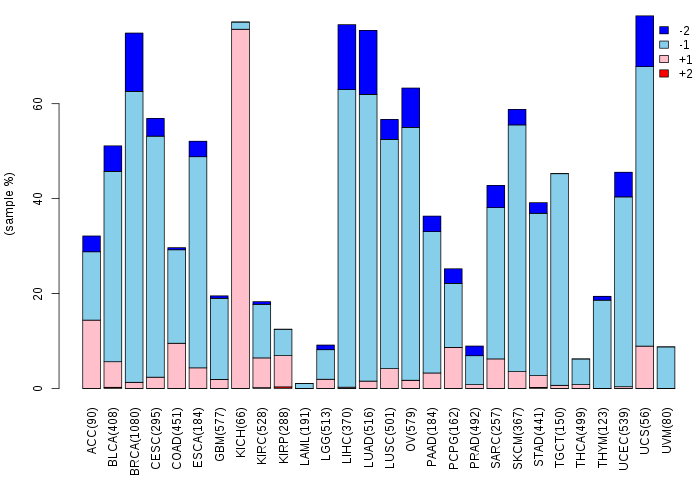
| Copy number variations of TissGene across 28 cancer types (X-axis: cancer type and Y-axis: % of CNV samples) (TCGA Gistic2_CopyNumber_Gistic2_all_data_by_genes, Gistic2 copy number data, version 2016-08-16) |
 |
| Top |
| TissGeneFusions for ODF3L1 |
| Fusion genes including TissGene (ChimerDB 3.0, 2016-12-01 and TCGA fusion Portal 2015-12-01) |
| Database | Src | Cancer type | Sample | Fusion gene | ORF | 5'-gene BP | 3'-gene BP |
| TCGAfusionPortal | PRADA | BRCA | TCGA-D8-A1JK-01A | UBE2Q2-ODF3L1 | Out-of-frame | Chr15:76136187 | Chr15:76017449 |
| Top |
| TissGeneNet for ODF3L1 |
| Co-expressed gene networks based on protein-protein interaction data (CePIN) (TCGA IlluminaHiSeq_RNASeqV2, pan-cancer normalized log2(norm_counts+1) data, version 2016-08-16) (PINA2 ppi data) |
| Top |
| TissGeneProg for ODF3L1 |
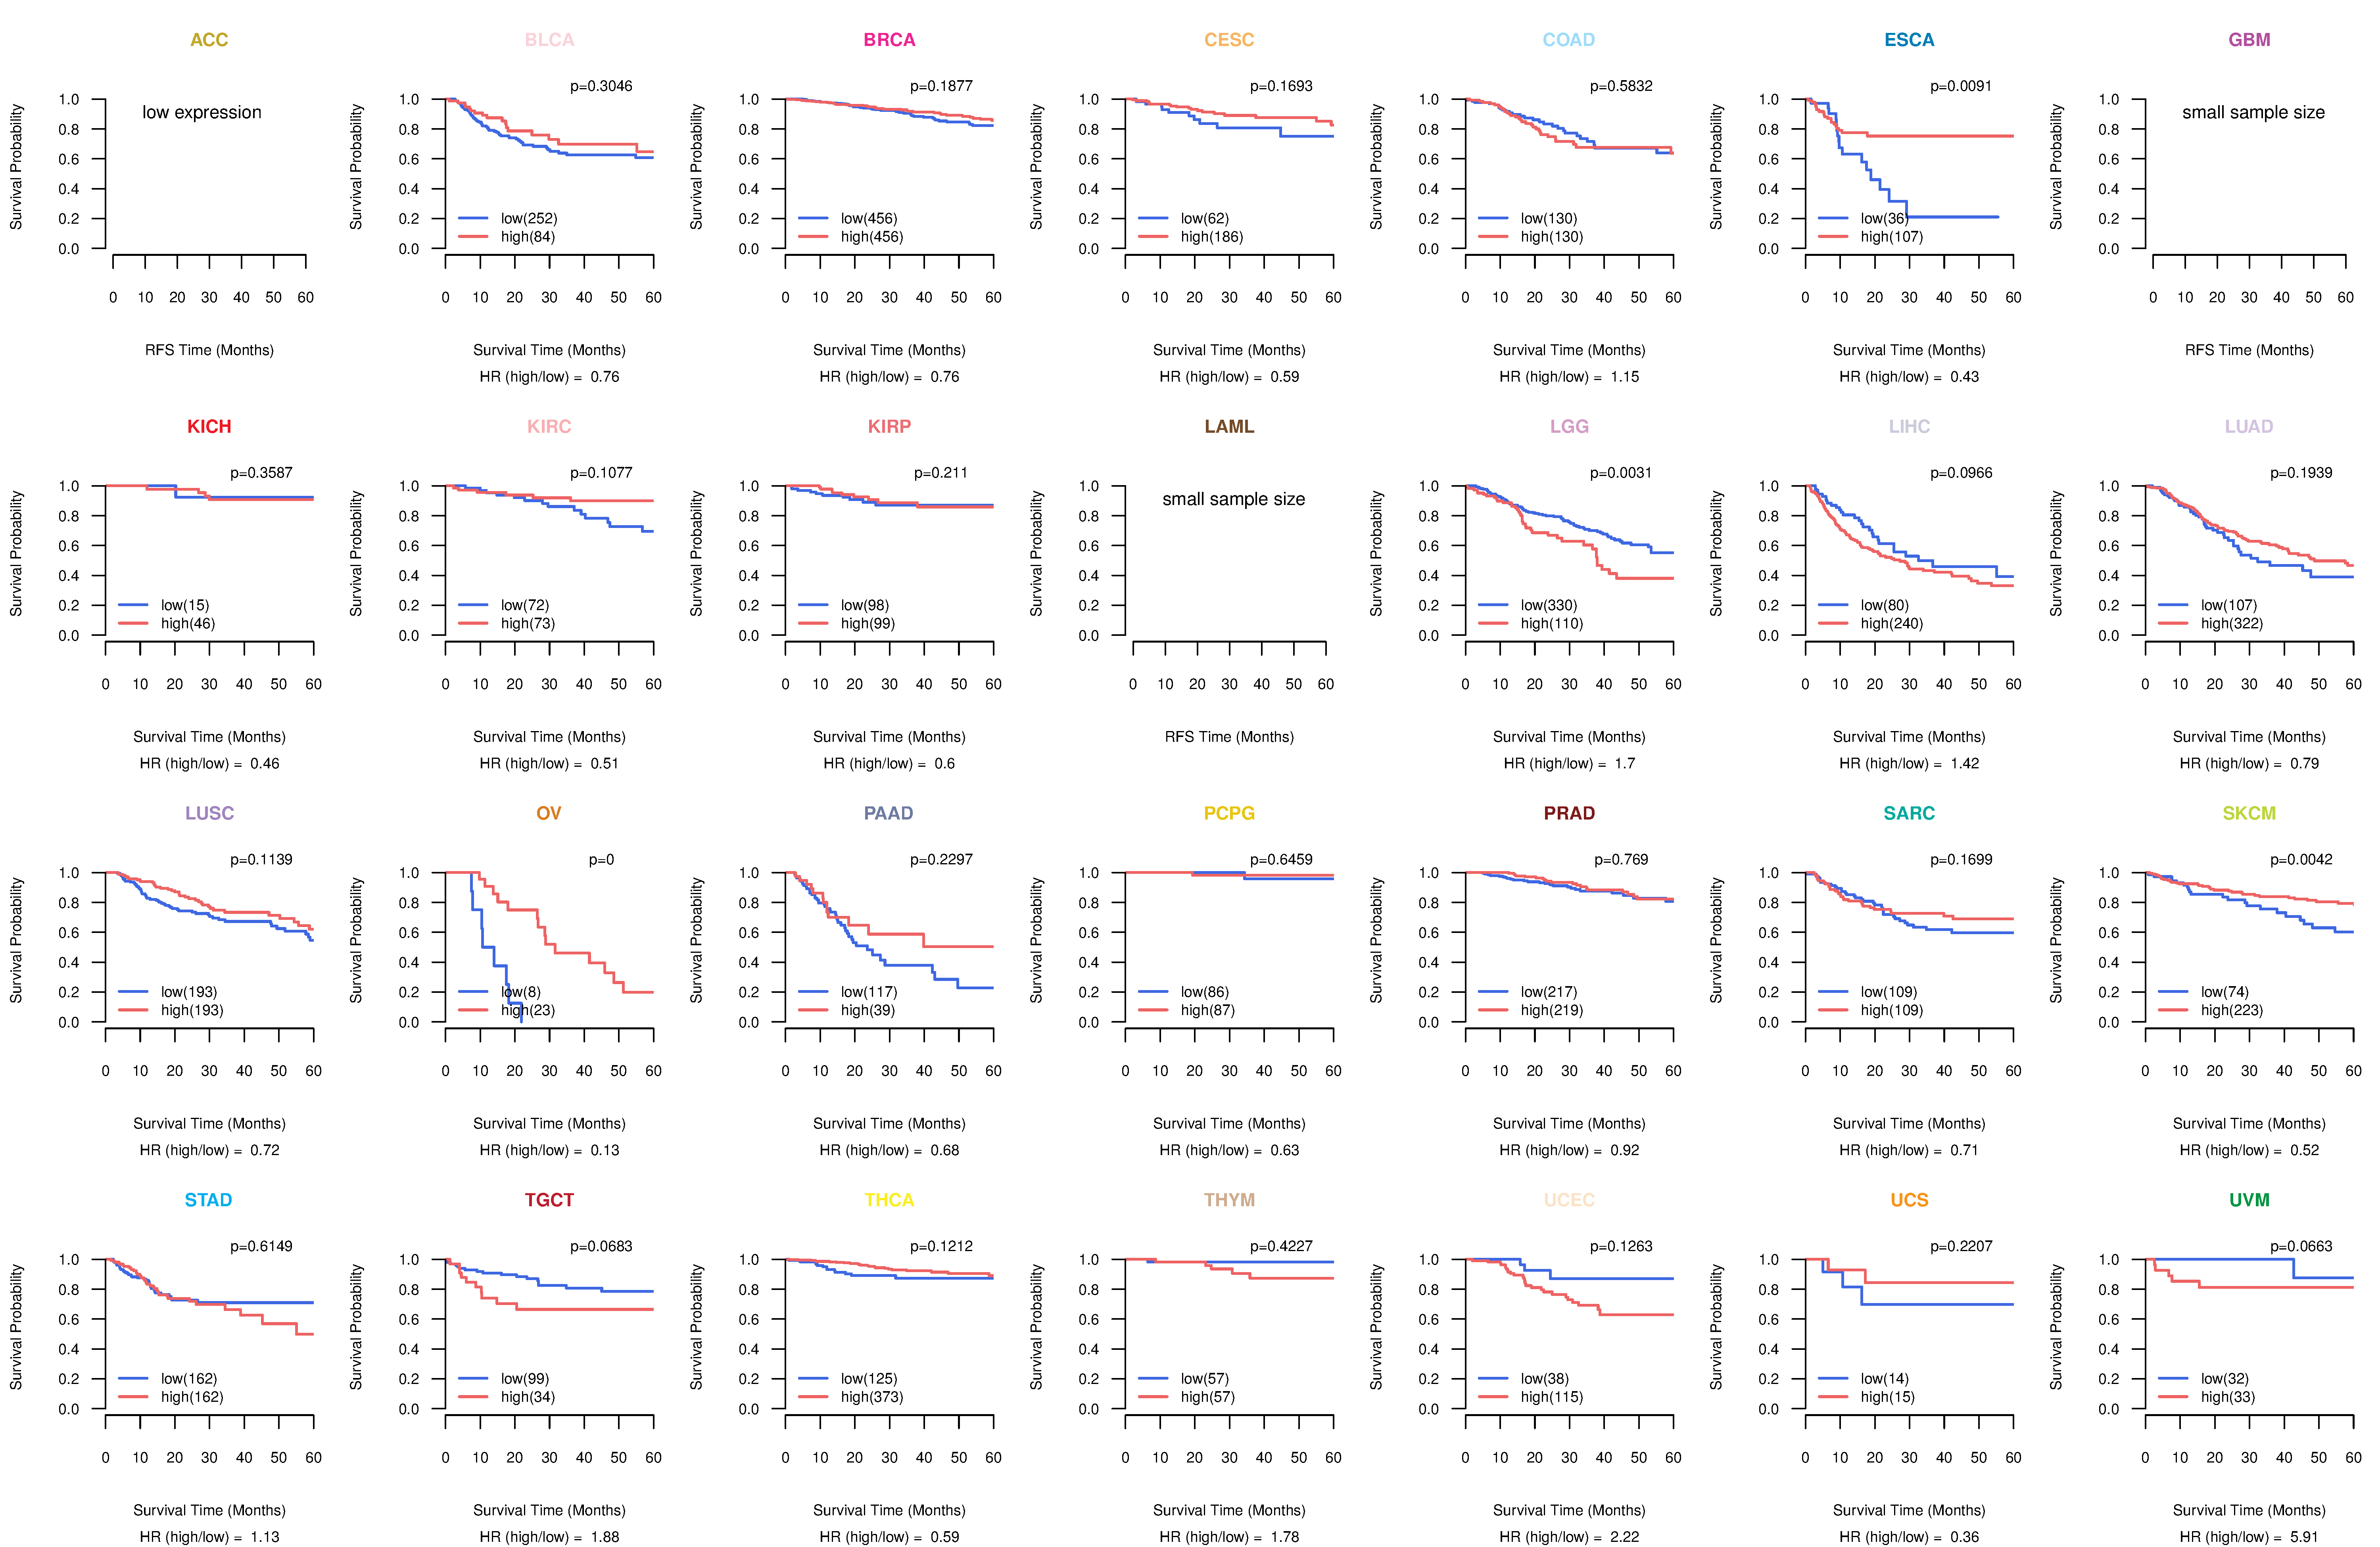
| Kaplan-Meier plots with logrank tests of overall survival (OS) using 28 cancer types (TCGA IlluminaHiSeq_RNASeqV2, pan-cancer normalized log2(norm_counts+1) data, version 2016-08-16) (TCGA clinicalMatrix, phenotype data, version 2016-04-27) * Click on the image to enlarge it in a new window. |
 |
| Kaplan-Meier plots with logrank test of relapse free survival (RFS) using 28 cancer types (TCGA IlluminaHiSeq_RNASeqV2, pan-cancer normalized log2(norm_counts+1) data, version 2016-08-16) (TCGA clinicalMatrix, phenotype data, version 2016-04-27) * Click on the image enlarge it in a new window. |
 |
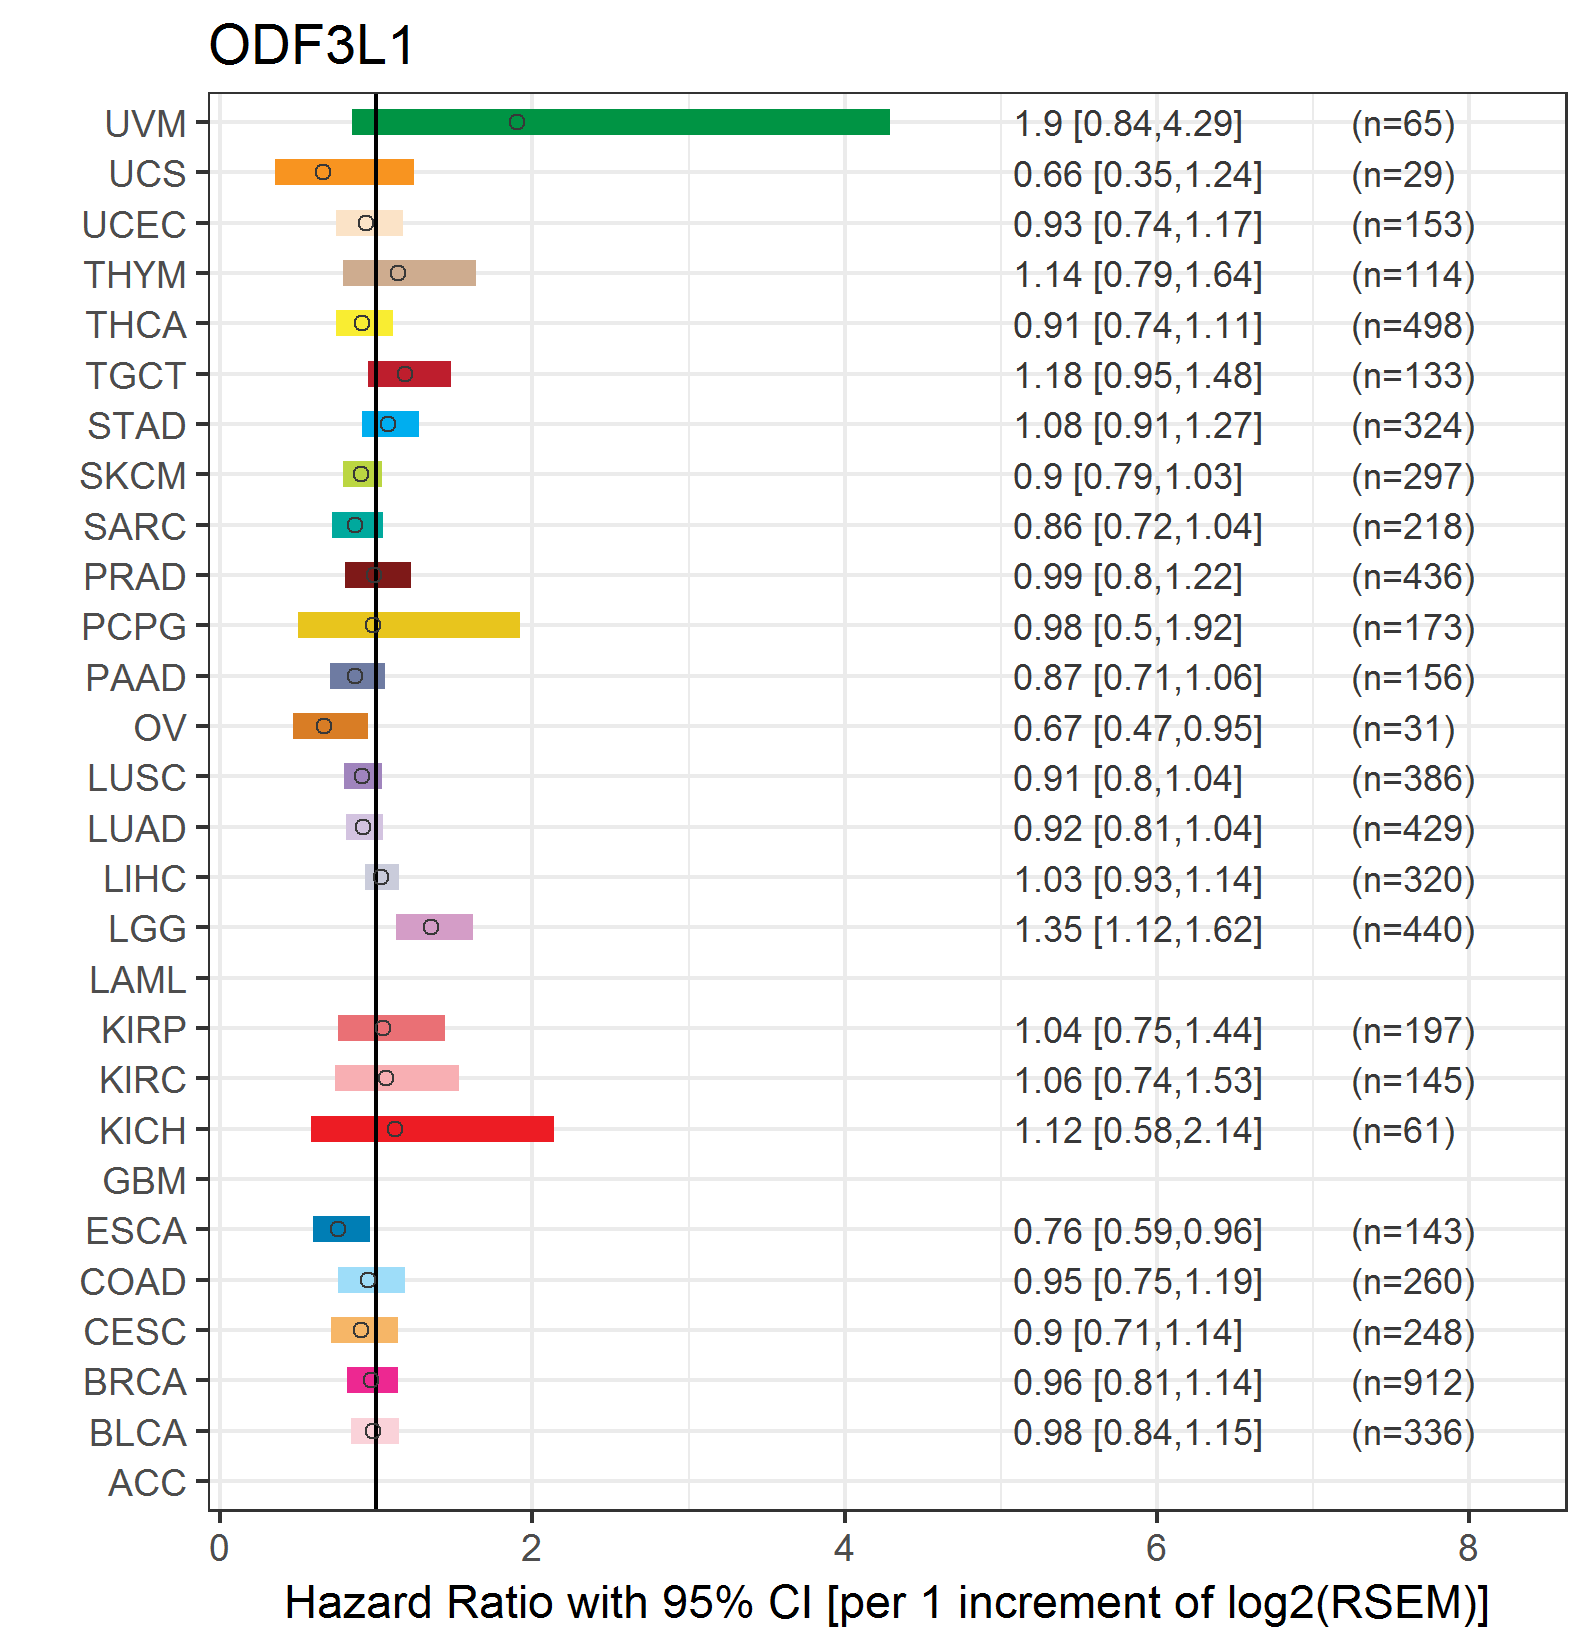
| Forest plot of Cox proportional hazard ratio (HR) and 95% CI of overall survival (OS) using 28 cancer types (TCGA IlluminaHiSeq_RNASeqV2, pan-cancer normalized log2(norm_counts+1) data, version 2016-08-16) (TCGA clinicalMatrix, phenotype data, version 2016-04-27) * Click on the image enlarge it in a new window. |
 |
| Forest plot of Cox proportional hazard ratio (HR) and 95% CI of relapse free survival (RFS) using 28 cancer types (TCGA IlluminaHiSeq_RNASeqV2, pan-cancer normalized log2(norm_counts+1) data, version 2016-08-16) (TCGA clinicalMatrix, phenotype data, version 2016-04-27) * Click on the image enlarge it in a new window. |
 |
| Top |
| TissGeneClin for ODF3L1 |
| TissGeneDrug for ODF3L1 |
| Drug information targeting TissGene (DrugBank Version 5.0.6, 2017-04-01) |
| DrugBank ID | Drug name | Drug activity | Drug type | Drug status |
| Top |
| TissGeneDisease for ODF3L1 |
| Disease information associated with TissGene (DisGeNet, 2016-06-01) |
| Disease ID | Disease name | # pubmeds | Source |
|
Copyright 2016-Present - The University of Texas Health Science Center at Houston (UTHealth) Web File Viewing | How to Report, Fraud, Waste and Abuse | State of Texas | Statewide Search | Texas Homeland Security | Site Policies |