 |
| |
| |
| |
| |
| |
| |
|

| TissGeneSummary for TTLL9 |
 Gene summary Gene summary |
| Basic gene information | Gene symbol | TTLL9 |
| Gene name | tubulin tyrosine ligase-like family, member 9 | |
| Synonyms | C20orf125|dJ310O13.1 | |
| Cytomap | UCSC genome browser: 20q11.21 | |
| Type of gene | protein-coding | |
| RefGenes | NM_001008409.2, | |
| Description | probable tubulin polyglutamylase TTLL9tubulin--tyrosine ligase-like protein 9 | |
| Modification date | 20141207 | |
| dbXrefs | HGNC : HGNC | |
| Ensembl : ENSG00000131044 | ||
| HPRD : 16638 | ||
| Vega : OTTHUMG00000186843 | ||
| Protein | UniProt: go to UniProt's Cross Reference DB Table | |
| Expression | CleanEX: HS_TTLL9 | |
| BioGPS: 164395 | ||
| Pathway | NCI Pathway Interaction Database: TTLL9 | |
| KEGG: TTLL9 | ||
| REACTOME: TTLL9 | ||
| Pathway Commons: TTLL9 | ||
| Context | iHOP: TTLL9 | |
| ligand binding site mutation search in PubMed: TTLL9 | ||
| UCL Cancer Institute: TTLL9 | ||
| Assigned class in TissGDB* | C | |
| Included tissue-specific gene expression resources | TiGER,GTEx | |
| Specific-tissues in normal samples (assigned by TissGDB using HPA, TiGER, and GTEx) | Testis | |
| Cancer types related to the specific-tissues in cancer samples (assigned by TissGDB using TCGA) | TGCT | |
| Reference showing the relevant tissue of TTLL9 | ||
| Description by TissGene annotations | Fused withOncogene | |
| * Class A consists of genes with literature evidence and is part of the cTissGenes. Class B consists of only cTissGenes without additional evidence. The remaining genes belong to Class C. |
| Gene ontology having evidence of Inferred from Direct Assay (IDA) from Entrez |
| GO ID | GO term | PubMed ID |
| Top |
| TissGeneExp for TTLL9 |
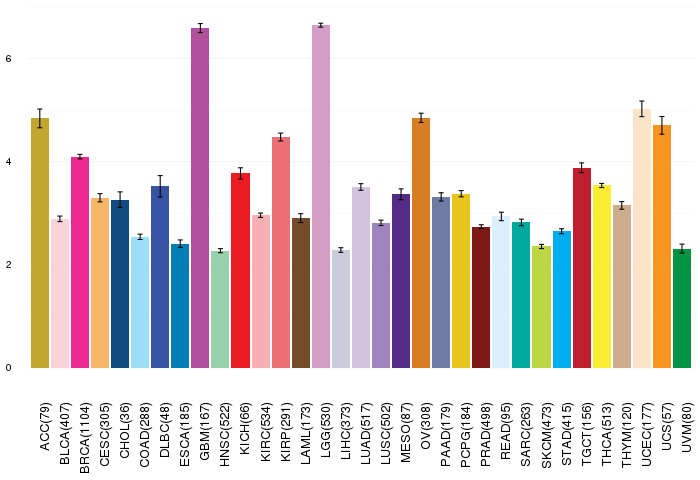
| Gene expressions across 28 cancer types (X-axis: cancer type and Y-axis: log2(norm_counts+1)) (TCGA IlluminaHiSeq_RNASeqV2, pan-cancer normalized log2(norm_counts+1) data, version 2016-08-16) |
 |
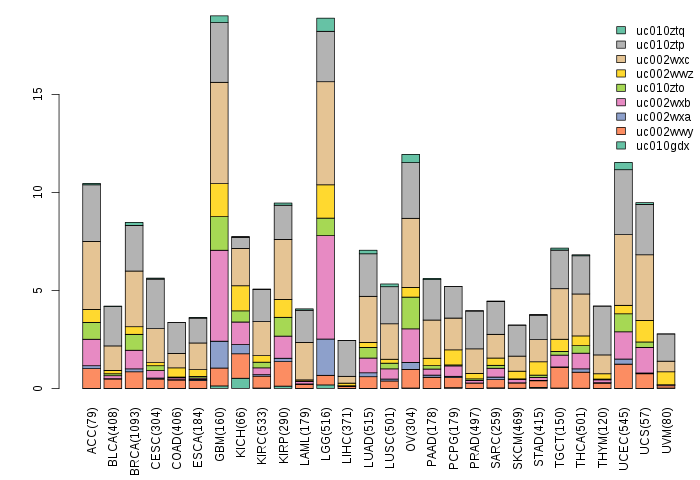
| Gene isoform expressions across 28 cancer types (X-axis: cancer type and Y-axis: log2(norm_counts+1)) (TCGA pan-cancer tcga_rsem_isoform_tpm, version 2016-09-01) |
 |
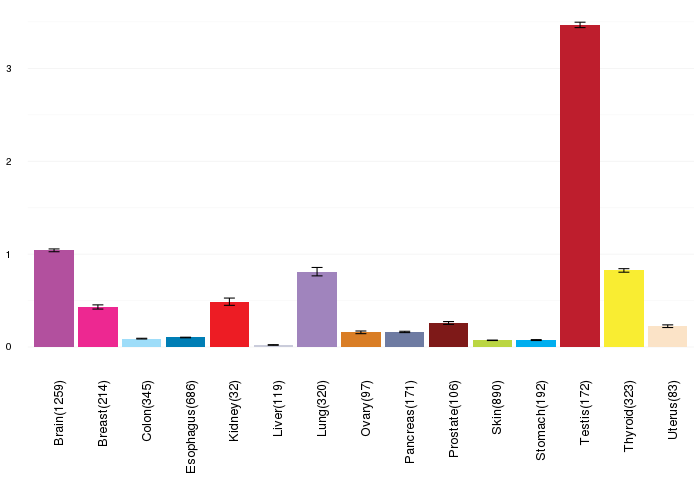
| Gene expressions across normal tissues of GTEx data (GTEx GTEx_Analysis_v6_RNA-seq_RNA-SeQCv1.1.8_gene_rpkm.gct) - Here, we shows the matched tissue types only among our 28 cancer types. |
 |
| Different expressions across 14 cancer types with more than 10 samples between matched tumors and normals (X-axis: cancer type and Y-axis: log2(norm_counts+1)) (TCGA IlluminaHiSeq_RNASeqV2, pan-cancer normalized log2(norm_counts+1) data, version 2016-08-16) |
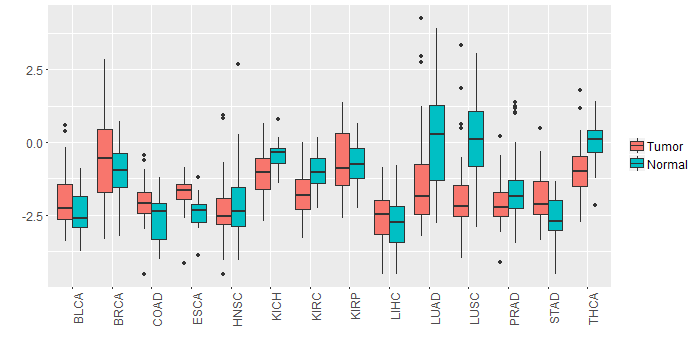 |
| - Significantly differentially expressed cancer types and information. (|Fold change|>1 and FDR<0.05) |
| Cancer type | Mean(exp) in tumor | Mean(exp) in matched normal | Log2FC | P-val. | FDR |
| LUAD | -1.457783393 | 0.152963159 | -1.610746552 | 2.09E-07 | 7.77E-07 |
| LUSC | -1.839380993 | 0.149773909 | -1.989154902 | 2.87E-10 | 1.04E-09 |
| Top |
| TissGene-miRNA for TTLL9 |
| Significantly anti-correlated miRNAs of TissGene across 28 cancer types (Gene-miRNA relations from TargetScanHuman Relsease 7.1, Conserved_Site_Context_Scores.txt.zip, 06.01.2016) (TCGA IlluminaHiSeq_miRNASeq, log2(RPM+1) data, version 2016-11-21) (TCGA IlluminaHiSeq_RNASeqV2, log2(normalized_count+1) data, version 2016-08-16) (Spearman’s Rank Correlation (p-value<0.05 and coefficient<-0.25)) |
| Cancer type | miRNA id | miRNA accession | P-val. | Coeff. | # samples |
| Top |
| TissGeneMut for TTLL9 |
| TissGeneSNV for TTLL9 |
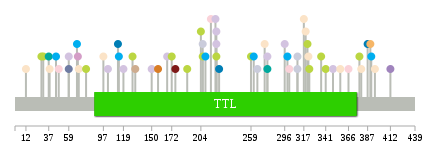
| nsSNV counts per each loci. Different colors of circles represent different cancer types. Circle size denotes number of samples. (TCGA somatic mutation (SNPs and small INDELs) data, version 2016-04-25) * Click on the image to enlarge it in a new window. |
 |
 |
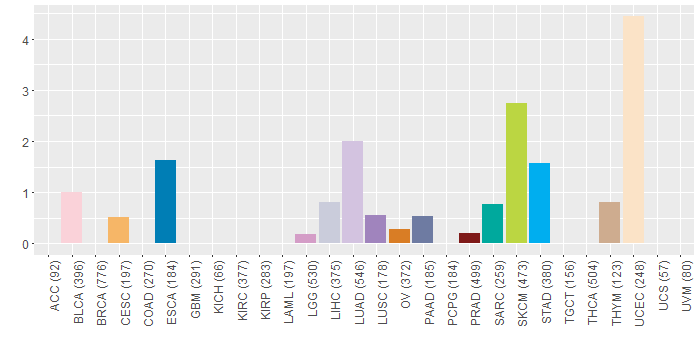
| Somatic nucleotide variants of TissGene across 28 cancer types (X-axis: cancer type and Y-axis: % of mutated samples) The numbers in parentheses are numbers of samples with mutation (nsSNVs). (TCGA somatic mutation (SNPs and small INDELs) data, version 2016-04-25) |
 |
| - nsSNVs sorted by frequency. |
| AAchange | Cancer type | # samples |
| p.S349N | LUAD | 1 |
| p.E336K | SKCM | 1 |
| p.A42T | HNSC | 1 |
| p.W189* | SKCM | 1 |
| p.R59H | PAAD | 1 |
| p.E132D | THYM | 1 |
| p.G29S | SKCM | 1 |
| p.E70K | UCEC | 1 |
| p.T48S | BLCA | 1 |
| p.R317C | UCEC | 1 |
| p.Q310X | LIHC | 1 |
| p.Q310* | LIHC | 1 |
| p.G221R | SKCM | 1 |
| p.C78F | SKCM | 1 |
| p.T323A | SKCM | 1 |
| p.G391V | STAD | 1 |
| p.G176D | PRAD | 1 |
| p.H366N | BLCA | 1 |
| p.T412A | LUSC | 1 |
| p.N341I | SKCM | 1 |
| p.E206G | LIHC | 1 |
| p.R277C | SARC | 1 |
| p.S262P | STAD | 1 |
| p.E37D | SARC | 1 |
| p.K357N | UCEC | 1 |
| p.E215D | BLCA | 1 |
| p.K224R | ESCA | 1 |
| p.R380Q | UCEC | 1 |
| p.R102Q | LUAD | 1 |
| p.V209A | STAD | 1 |
| p.M113I | ESCA | 1 |
| p.R319* | UCEC | 1 |
| p.I220M | LUAD | 1 |
| p.R38* | UCEC | 1 |
| p.R395I | UCEC | 1 |
| p.R157P | OV | 1 |
| p.M387I | ESCA | 1 |
| p.T274M | UCEC | 1 |
| p.G12D | UCEC | 1 |
| p.G129E | SKCM | 1 |
| p.D69A | LGG | 1 |
| p.L58F | HNSC | 1 |
| p.D299N | STAD | 1 |
| p.F46L | CHOL | 1 |
| p.R119Q | LUAD | 1 |
| p.E206K | SKCM | 1 |
| p.G31E | SKCM | 1 |
| p.H150Y | LUAD | 1 |
| p.S221L | LUAD | 1 |
| p.E321K | SKCM | 1 |
| p.R277C | LUAD | 1 |
| p.P204S | SKCM | 1 |
| p.H266N | LIHC | 1 |
| p.S172F | SKCM | 1 |
| p.R296S | LUAD | 1 |
| p.R97W | UCEC | 1 |
| p.E322* | UCEC | 1 |
| p.R59C | LUAD | 1 |
| p.R45Q | STAD | 1 |
| p.K167N | LUAD | 1 |
| p.W259* | SKCM | 1 |
| p.V114M | STAD | 1 |
| p.G221R | LUAD | 1 |
| p.K68T | STAD | 1 |
| p.E378K | SKCM | 1 |
| p.I301M | BLCA | 1 |
| p.D390N | CESC | 1 |
| Top |
| TissGeneCNV for TTLL9 |
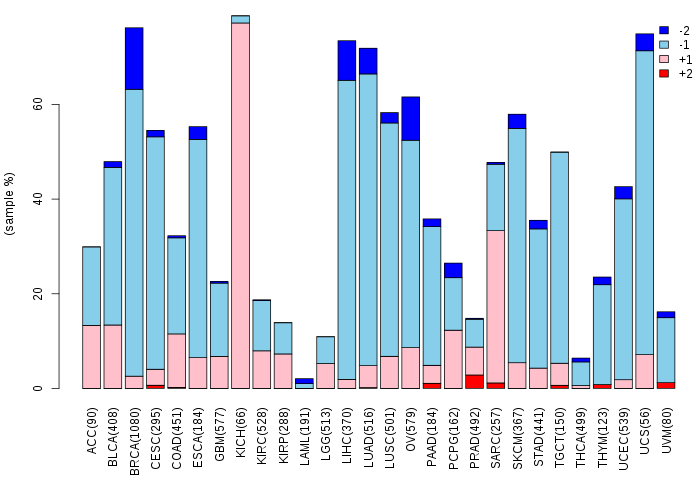
| Copy number variations of TissGene across 28 cancer types (X-axis: cancer type and Y-axis: % of CNV samples) (TCGA Gistic2_CopyNumber_Gistic2_all_data_by_genes, Gistic2 copy number data, version 2016-08-16) |
 |
| Top |
| TissGeneFusions for TTLL9 |
| Fusion genes including TissGene (ChimerDB 3.0, 2016-12-01 and TCGA fusion Portal 2015-12-01) |
| Database | Src | Cancer type | Sample | Fusion gene | ORF | 5'-gene BP | 3'-gene BP |
| Chimerdb3.0 | ChiTaRs | NA | DB360697 | TTLL9-CTNNB1 | chr20:30469688 | chr3:41280671 | |
| Chimerdb3.0 | TopHat-Fusion | LUAD | TCGA-69-8253-01A | ELMO2-TTLL9 | In-Frame | chr20:45001314 | chr20:30466127 |
| Top |
| TissGeneNet for TTLL9 |
| Co-expressed gene networks based on protein-protein interaction data (CePIN) (TCGA IlluminaHiSeq_RNASeqV2, pan-cancer normalized log2(norm_counts+1) data, version 2016-08-16) (PINA2 ppi data) |
| Top |
| TissGeneProg for TTLL9 |
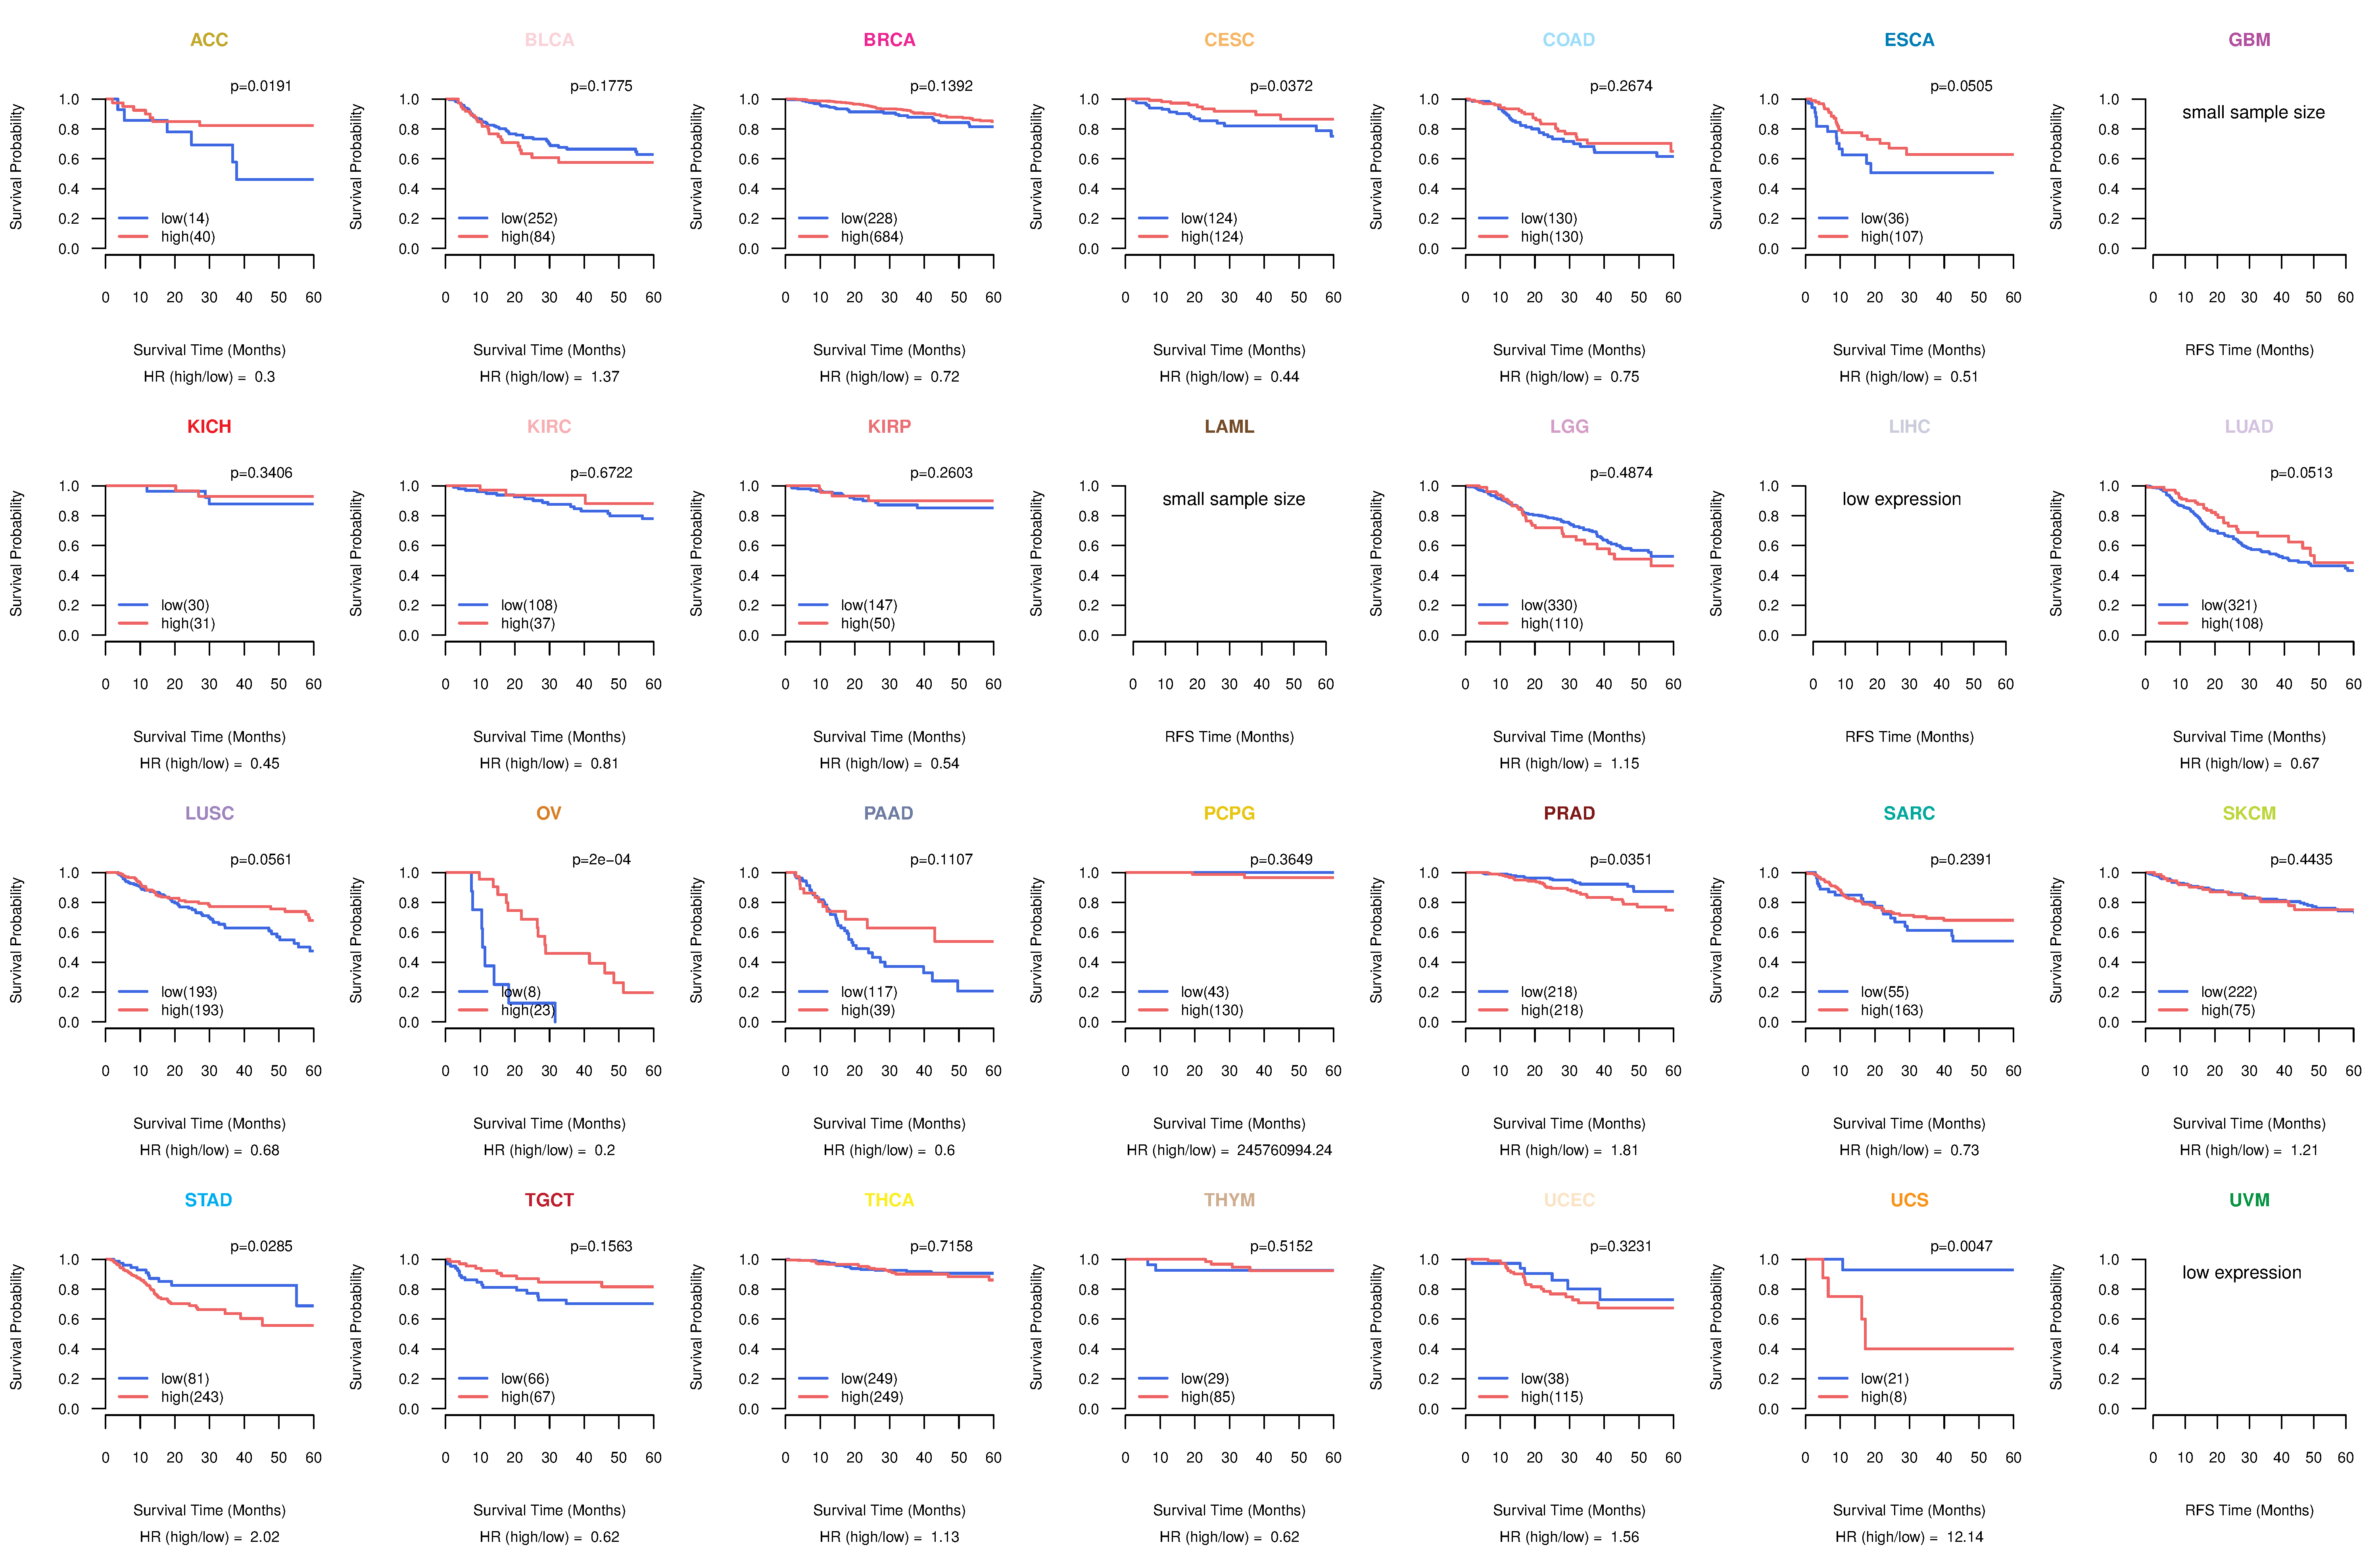
| Kaplan-Meier plots with logrank tests of overall survival (OS) using 28 cancer types (TCGA IlluminaHiSeq_RNASeqV2, pan-cancer normalized log2(norm_counts+1) data, version 2016-08-16) (TCGA clinicalMatrix, phenotype data, version 2016-04-27) * Click on the image to enlarge it in a new window. |
 |
| Kaplan-Meier plots with logrank test of relapse free survival (RFS) using 28 cancer types (TCGA IlluminaHiSeq_RNASeqV2, pan-cancer normalized log2(norm_counts+1) data, version 2016-08-16) (TCGA clinicalMatrix, phenotype data, version 2016-04-27) * Click on the image enlarge it in a new window. |
 |
| Forest plot of Cox proportional hazard ratio (HR) and 95% CI of overall survival (OS) using 28 cancer types (TCGA IlluminaHiSeq_RNASeqV2, pan-cancer normalized log2(norm_counts+1) data, version 2016-08-16) (TCGA clinicalMatrix, phenotype data, version 2016-04-27) * Click on the image enlarge it in a new window. |
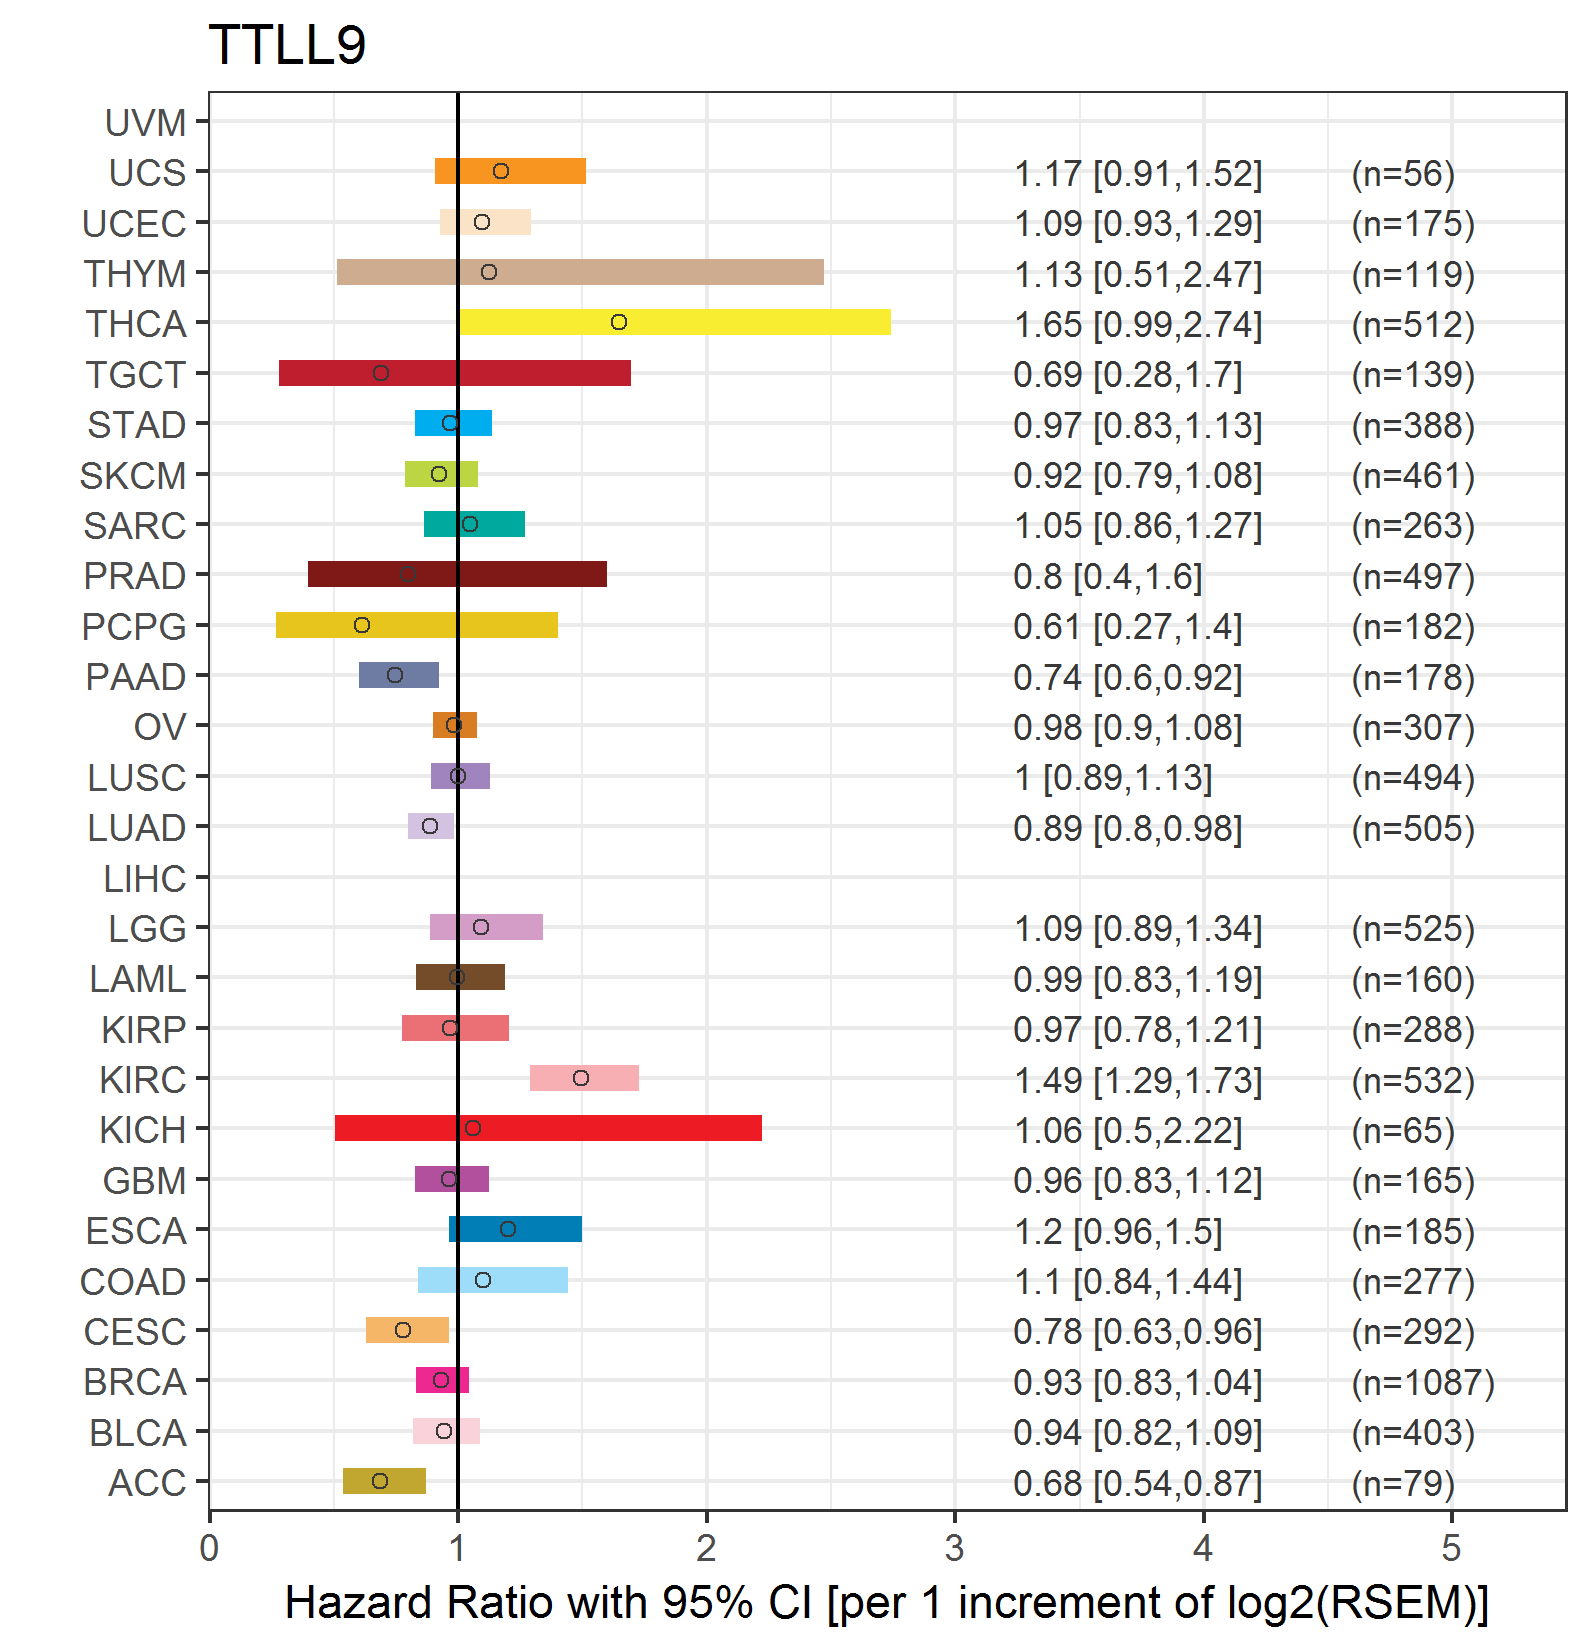 |
| Forest plot of Cox proportional hazard ratio (HR) and 95% CI of relapse free survival (RFS) using 28 cancer types (TCGA IlluminaHiSeq_RNASeqV2, pan-cancer normalized log2(norm_counts+1) data, version 2016-08-16) (TCGA clinicalMatrix, phenotype data, version 2016-04-27) * Click on the image enlarge it in a new window. |
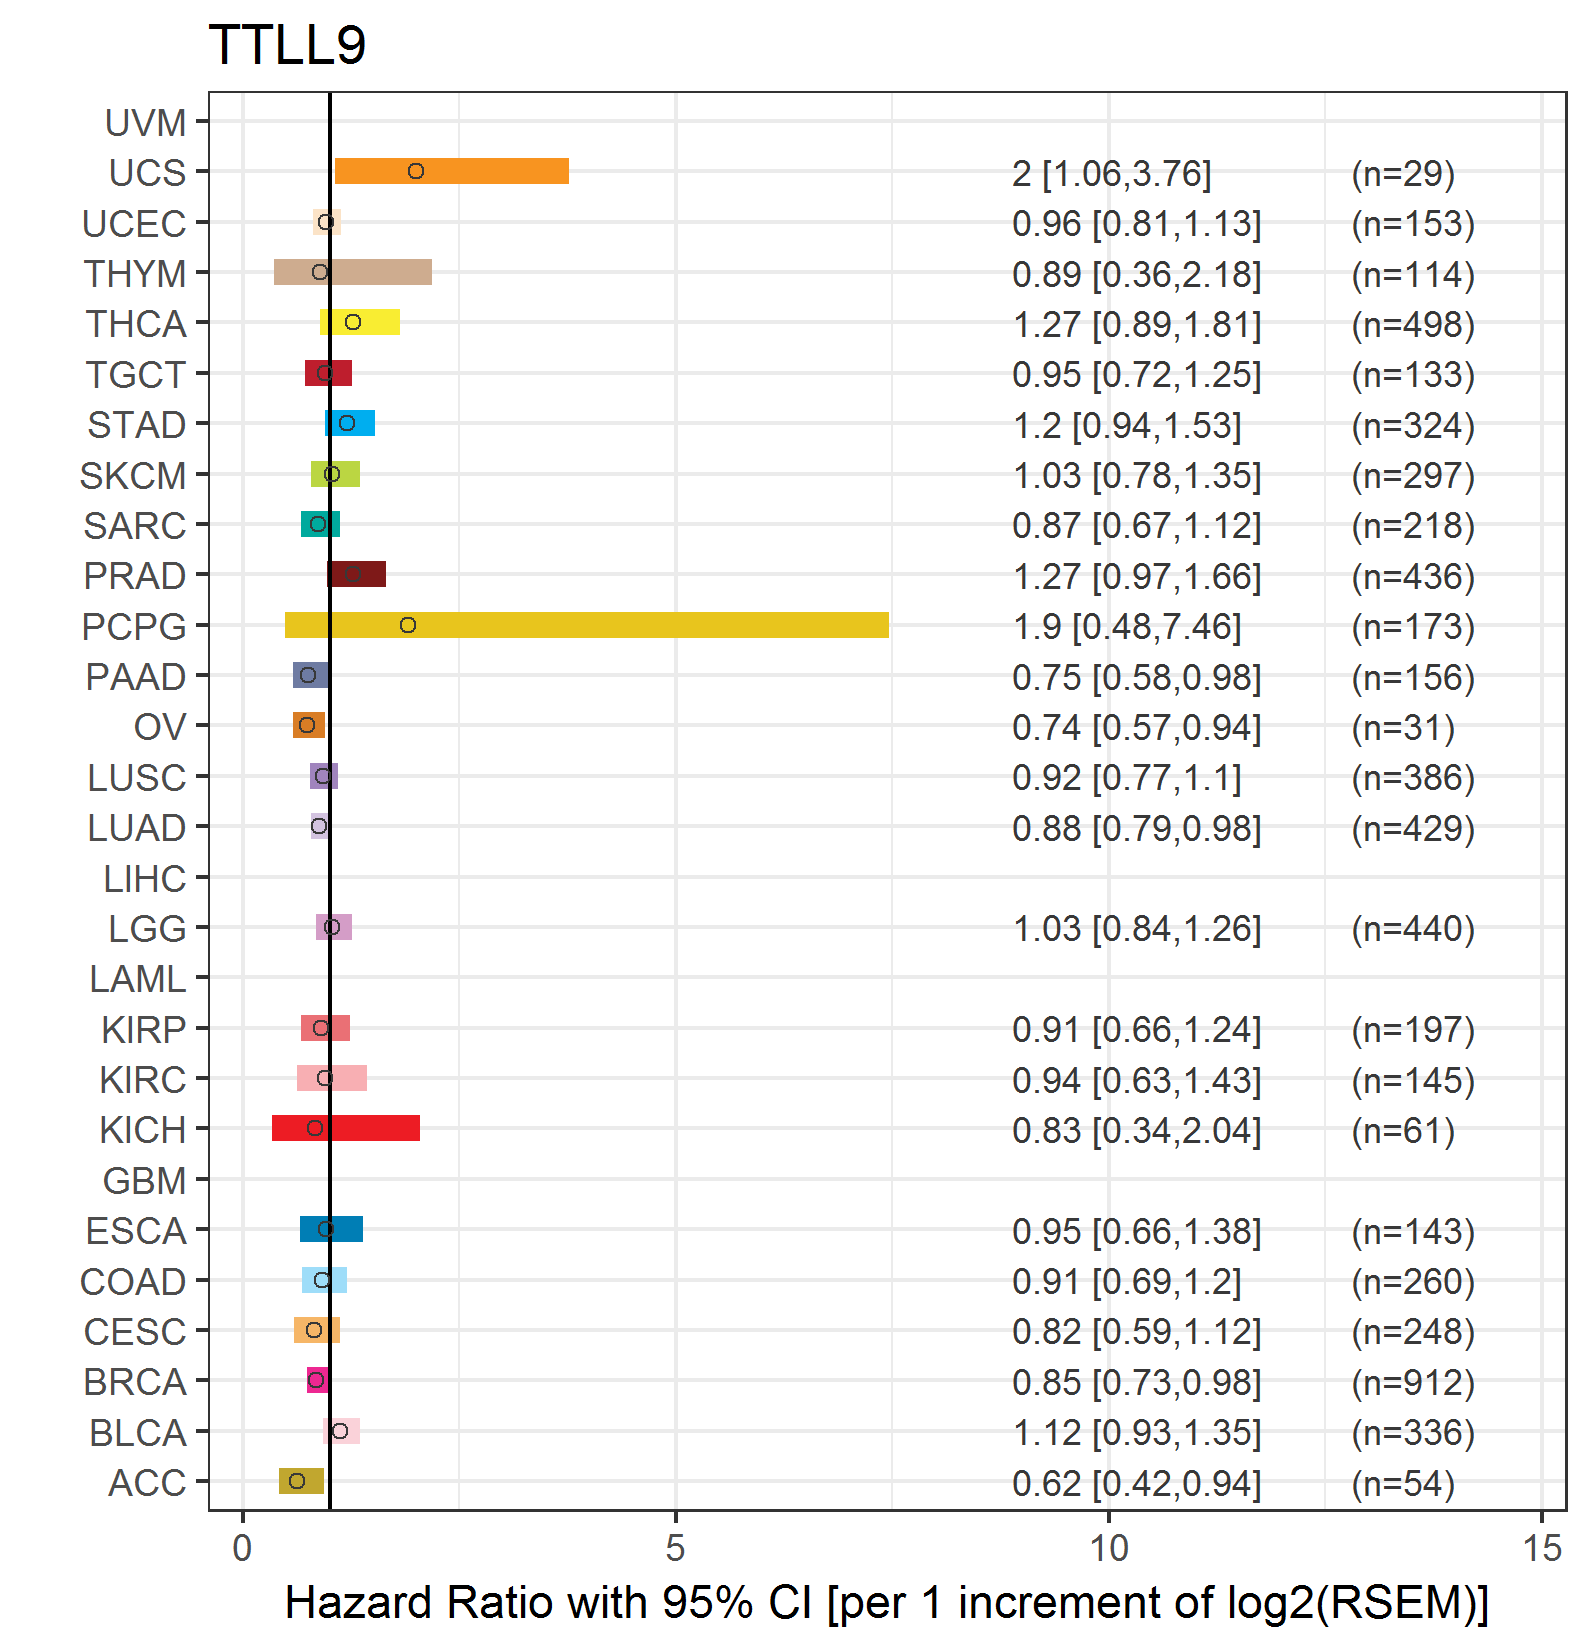 |
| Top |
| TissGeneClin for TTLL9 |
| TissGeneDrug for TTLL9 |
| Drug information targeting TissGene (DrugBank Version 5.0.6, 2017-04-01) |
| DrugBank ID | Drug name | Drug activity | Drug type | Drug status |
| Top |
| TissGeneDisease for TTLL9 |
| Disease information associated with TissGene (DisGeNet, 2016-06-01) |
| Disease ID | Disease name | # pubmeds | Source |
| umls:C0023903 | Liver neoplasms | 1 | CTD_human |
| umls:C0032460 | Polycystic Ovary Syndrome | 1 | CTD_human |
| umls:C0032927 | Precancerous Conditions | 1 | CTD_human |
|
Copyright 2016-Present - The University of Texas Health Science Center at Houston (UTHealth) Web File Viewing | How to Report, Fraud, Waste and Abuse | State of Texas | Statewide Search | Texas Homeland Security | Site Policies |