 |
| |
| |
| |
| |
| |
| |
|

| TissGeneSummary for KCNV2 |
 Gene summary Gene summary |
| Basic gene information | Gene symbol | KCNV2 |
| Gene name | potassium channel, subfamily V, member 2 | |
| Synonyms | KV11.1|Kv8.2|RCD3B | |
| Cytomap | UCSC genome browser: 9p24.2 | |
| Type of gene | protein-coding | |
| RefGenes | NM_133497.3, | |
| Description | potassium voltage-gated channel subfamily V member 2voltage-gated potassium channel subunit Kv8.2 | |
| Modification date | 20141207 | |
| dbXrefs | MIM : 607604 | |
| HGNC : HGNC | ||
| Ensembl : ENSG00000168263 | ||
| HPRD : 12126 | ||
| Vega : OTTHUMG00000019449 | ||
| Protein | UniProt: go to UniProt's Cross Reference DB Table | |
| Expression | CleanEX: HS_KCNV2 | |
| BioGPS: 169522 | ||
| Pathway | NCI Pathway Interaction Database: KCNV2 | |
| KEGG: KCNV2 | ||
| REACTOME: KCNV2 | ||
| Pathway Commons: KCNV2 | ||
| Context | iHOP: KCNV2 | |
| ligand binding site mutation search in PubMed: KCNV2 | ||
| UCL Cancer Institute: KCNV2 | ||
| Assigned class in TissGDB* | B | |
| Included tissue-specific gene expression resources | HPA,TiGER,GTEx | |
| Specific-tissues in normal samples (assigned by TissGDB using HPA, TiGER, and GTEx) | TestisEye | |
| Cancer types related to the specific-tissues in cancer samples (assigned by TissGDB using TCGA) | TGCTUVM | |
| Reference showing the relevant tissue of KCNV2 | ||
| Description by TissGene annotations | ||
| * Class A consists of genes with literature evidence and is part of the cTissGenes. Class B consists of only cTissGenes without additional evidence. The remaining genes belong to Class C. |
| Gene ontology having evidence of Inferred from Direct Assay (IDA) from Entrez |
| GO ID | GO term | PubMed ID |
| Top |
| TissGeneExp for KCNV2 |
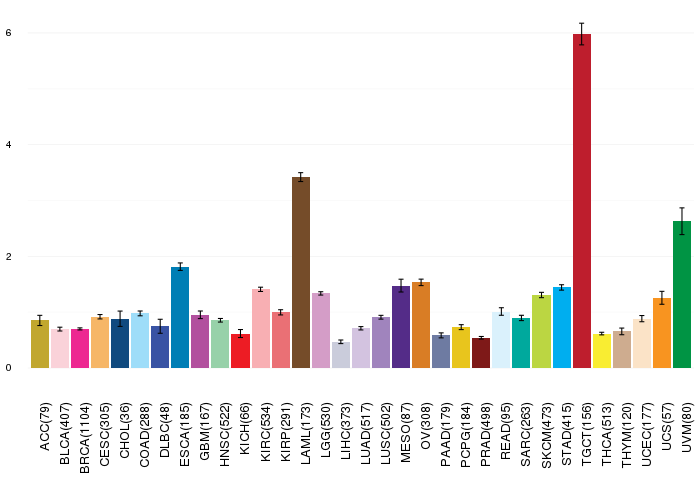
| Gene expressions across 28 cancer types (X-axis: cancer type and Y-axis: log2(norm_counts+1)) (TCGA IlluminaHiSeq_RNASeqV2, pan-cancer normalized log2(norm_counts+1) data, version 2016-08-16) |
 |
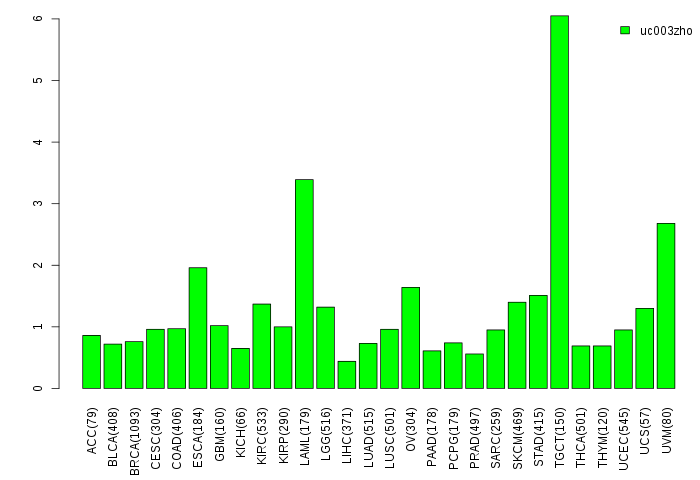
| Gene isoform expressions across 28 cancer types (X-axis: cancer type and Y-axis: log2(norm_counts+1)) (TCGA pan-cancer tcga_rsem_isoform_tpm, version 2016-09-01) |
 |
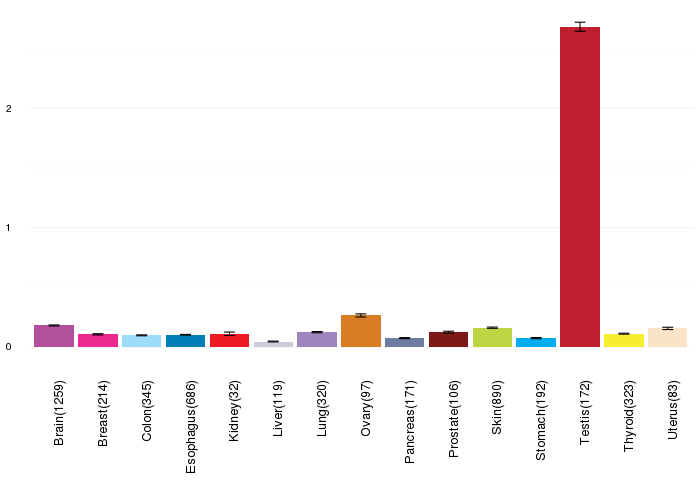
| Gene expressions across normal tissues of GTEx data (GTEx GTEx_Analysis_v6_RNA-seq_RNA-SeQCv1.1.8_gene_rpkm.gct) - Here, we shows the matched tissue types only among our 28 cancer types. |
 |
| Different expressions across 14 cancer types with more than 10 samples between matched tumors and normals (X-axis: cancer type and Y-axis: log2(norm_counts+1)) (TCGA IlluminaHiSeq_RNASeqV2, pan-cancer normalized log2(norm_counts+1) data, version 2016-08-16) |
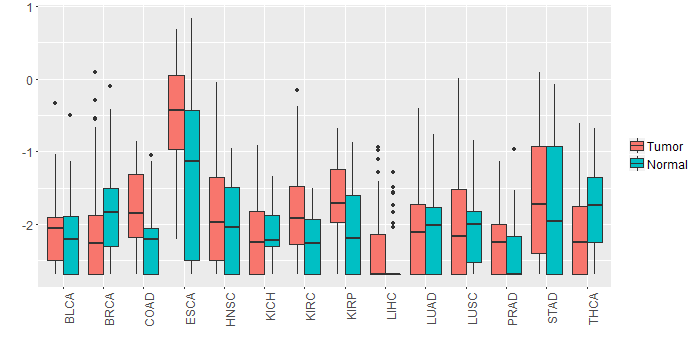 |
| - Significantly differentially expressed cancer types and information. (|Fold change|>1 and FDR<0.05) |
| Cancer type | Mean(exp) in tumor | Mean(exp) in matched normal | Log2FC | P-val. | FDR |
| Top |
| TissGene-miRNA for KCNV2 |
| Significantly anti-correlated miRNAs of TissGene across 28 cancer types (Gene-miRNA relations from TargetScanHuman Relsease 7.1, Conserved_Site_Context_Scores.txt.zip, 06.01.2016) (TCGA IlluminaHiSeq_miRNASeq, log2(RPM+1) data, version 2016-11-21) (TCGA IlluminaHiSeq_RNASeqV2, log2(normalized_count+1) data, version 2016-08-16) (Spearman’s Rank Correlation (p-value<0.05 and coefficient<-0.25)) |
| Cancer type | miRNA id | miRNA accession | P-val. | Coeff. | # samples |
| Top |
| TissGeneMut for KCNV2 |
| TissGeneSNV for KCNV2 |
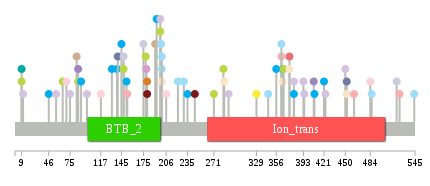
| nsSNV counts per each loci. Different colors of circles represent different cancer types. Circle size denotes number of samples. (TCGA somatic mutation (SNPs and small INDELs) data, version 2016-04-25) * Click on the image to enlarge it in a new window. |
 |
 |
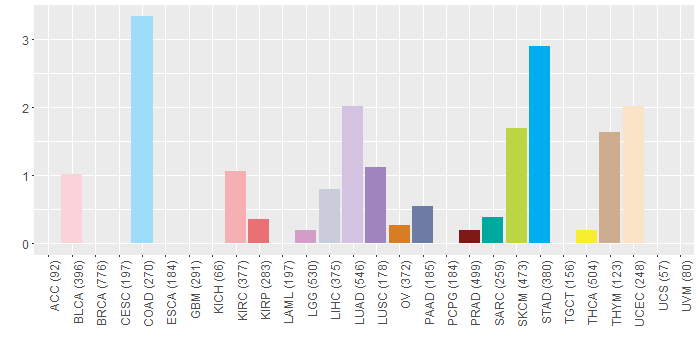
| Somatic nucleotide variants of TissGene across 28 cancer types (X-axis: cancer type and Y-axis: % of mutated samples) The numbers in parentheses are numbers of samples with mutation (nsSNVs). (TCGA somatic mutation (SNPs and small INDELs) data, version 2016-04-25) |
 |
| - nsSNVs sorted by frequency. |
| AAchange | Cancer type | # samples |
| p.G461E | HNSC | 1 |
| p.G117S | BLCA | 1 |
| p.R285C | UCEC | 1 |
| p.E284K | SKCM | 1 |
| p.R9Q | SKCM | 1 |
| p.D235N | STAD | 1 |
| p.C198Y | SKCM | 1 |
| p.R221C | MESO | 1 |
| p.D65N | SKCM | 1 |
| p.T365M | STAD | 1 |
| p.R191W | THYM | 1 |
| p.R200H | UCEC | 1 |
| p.T98M | LUAD | 1 |
| p.G175R | LIHC | 1 |
| p.A84T | THYM | 1 |
| p.L484I | BLCA | 1 |
| p.G117S | READ | 1 |
| p.R245H | PRAD | 1 |
| p.E544D | COAD | 1 |
| p.Q349* | CHOL | 1 |
| p.R200C | COAD | 1 |
| p.G363D | COAD | 1 |
| p.G486R | COAD | 1 |
| p.D152N | STAD | 1 |
| p.G421S | HNSC | 1 |
| p.T98M | HNSC | 1 |
| p.R132H | STAD | 1 |
| p.C139Y | STAD | 1 |
| p.L271F | SKCM | 1 |
| p.P86H | LUSC | 1 |
| p.R179H | LGG | 1 |
| p.T365M | UCEC | 1 |
| p.R200H | COAD | 1 |
| p.R332H | HNSC | 1 |
| p.E56K | LUAD | 1 |
| p.V366M | SKCM | 1 |
| p.D70N | BLCA | 1 |
| p.G421D | STAD | 1 |
| p.S90N | STAD | 1 |
| p.R380C | STAD | 1 |
| p.Q374R | KIRP | 1 |
| p.L539P | DLBC | 1 |
| p.K193R | STAD | 1 |
| p.S394A | LUAD | 1 |
| p.C407* | LUSC | 1 |
| p.R153H | KIRC | 1 |
| p.F520C | LIHC | 1 |
| p.C199Y | COAD | 1 |
| p.R380H | LUAD | 1 |
| p.P86L | SKCM | 1 |
| p.H393D | LUAD | 1 |
| p.D462G | KIRC | 1 |
| p.T356M | STAD | 1 |
| p.D75E | LUAD | 1 |
| p.R180H | PRAD | 1 |
| p.E148K | LIHC | 1 |
| p.R9W | SARC | 1 |
| p.E230D | COAD | 1 |
| p.A524T | KIRC | 1 |
| p.G363S | READ | 1 |
| p.P178L | SKCM | 1 |
| p.G363C | KIRC | 1 |
| p.Q374H | UCEC | 1 |
| p.Q145L | STAD | 1 |
| p.W46* | STAD | 1 |
| p.A452T | PAAD | 1 |
| p.D140N | PAAD | 1 |
| p.R329H | THCA | 1 |
| p.R180P | OV | 1 |
| p.Q291K | LUAD | 1 |
| p.R206W | BLCA | 1 |
| p.P345L | COAD | 1 |
| p.G486R | READ | 1 |
| p.Y408C | STAD | 1 |
| p.F423V | LUAD | 1 |
| p.A452T | UCEC | 1 |
| p.W450R | LUAD | 1 |
| p.A222V | COAD | 1 |
| p.E148K | SKCM | 1 |
| p.C198S | LUAD | 1 |
| p.W11* | LUAD | 1 |
| Top |
| TissGeneCNV for KCNV2 |
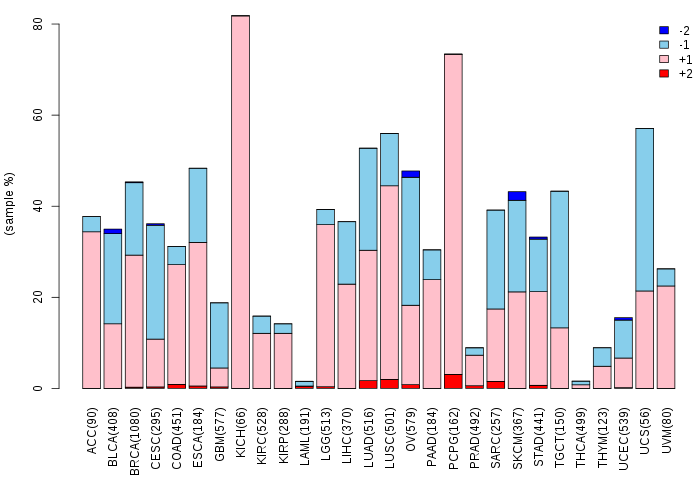
| Copy number variations of TissGene across 28 cancer types (X-axis: cancer type and Y-axis: % of CNV samples) (TCGA Gistic2_CopyNumber_Gistic2_all_data_by_genes, Gistic2 copy number data, version 2016-08-16) |
 |
| Top |
| TissGeneFusions for KCNV2 |
| Fusion genes including TissGene (ChimerDB 3.0, 2016-12-01 and TCGA fusion Portal 2015-12-01) |
| Database | Src | Cancer type | Sample | Fusion gene | ORF | 5'-gene BP | 3'-gene BP |
| Top |
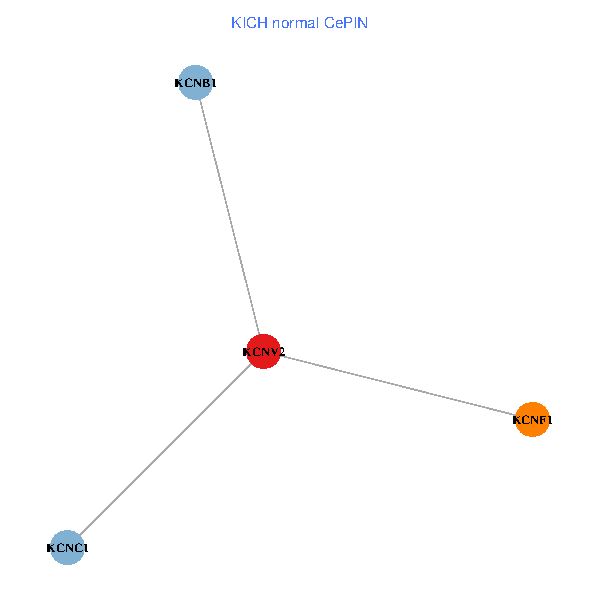
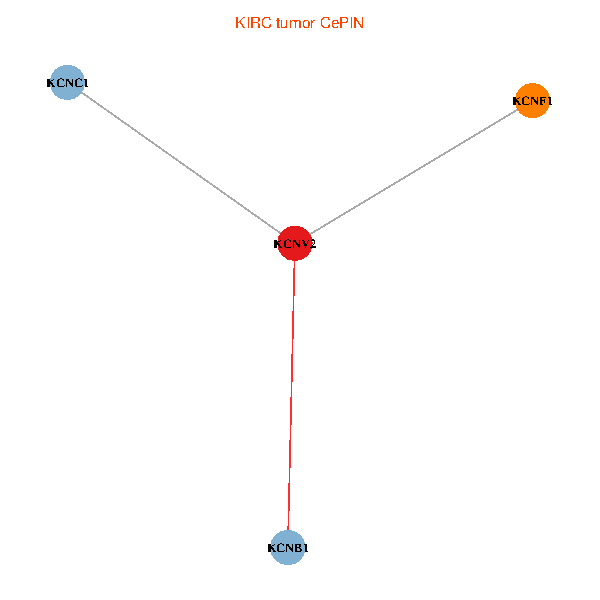
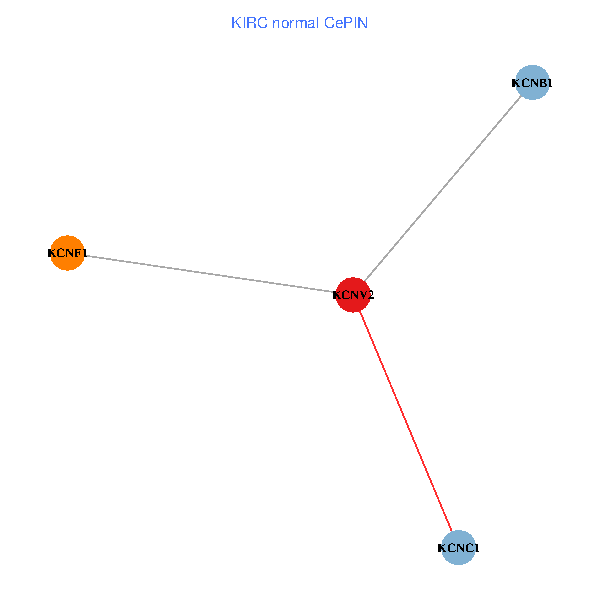
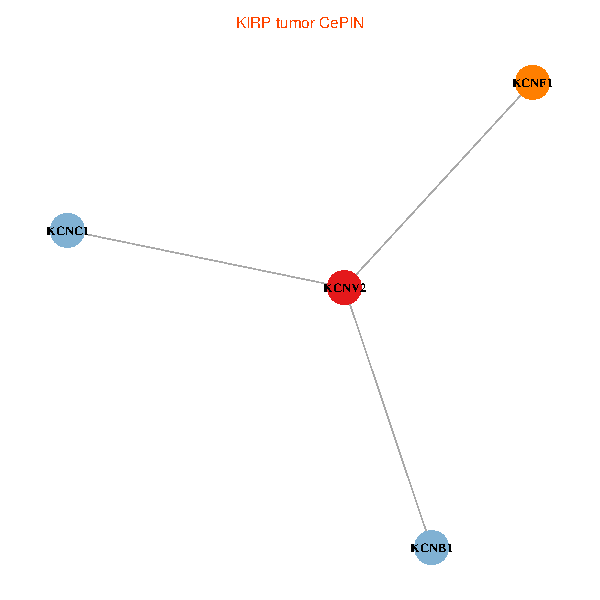
| TissGeneNet for KCNV2 |
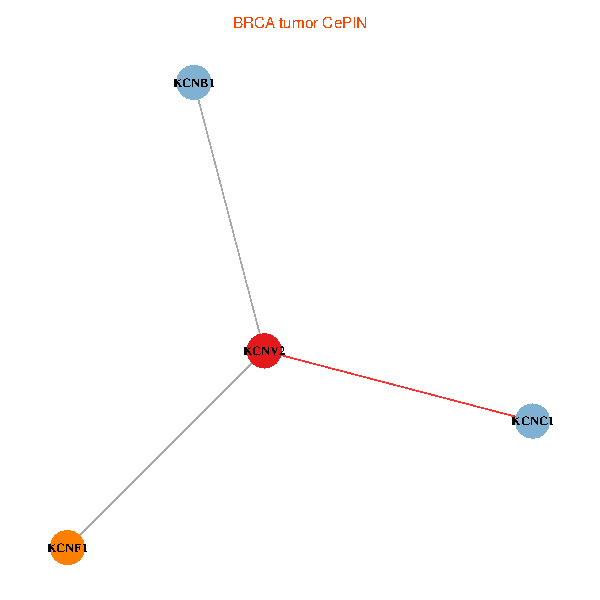
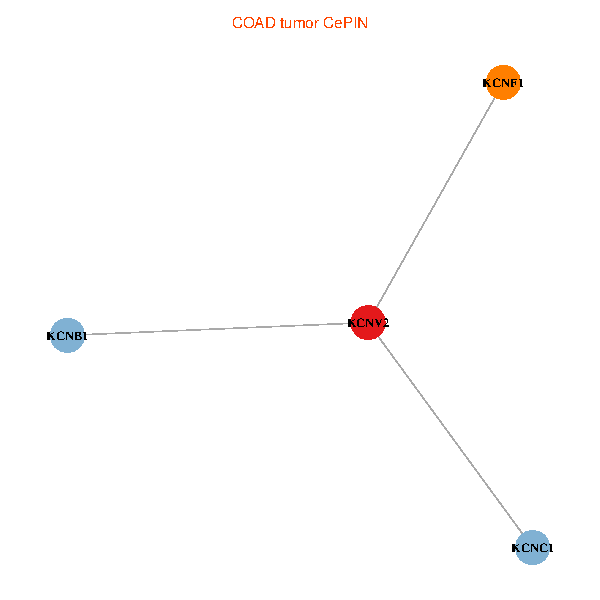
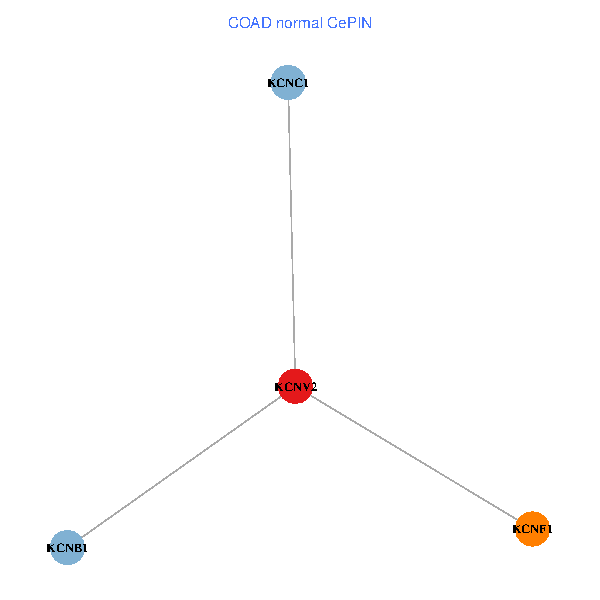
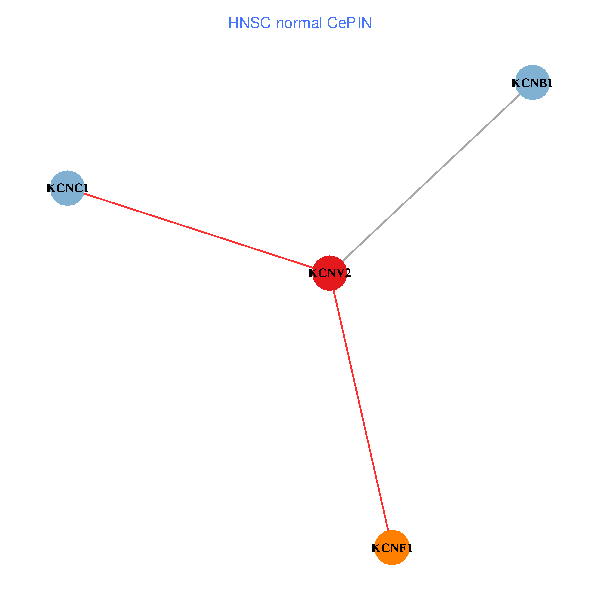
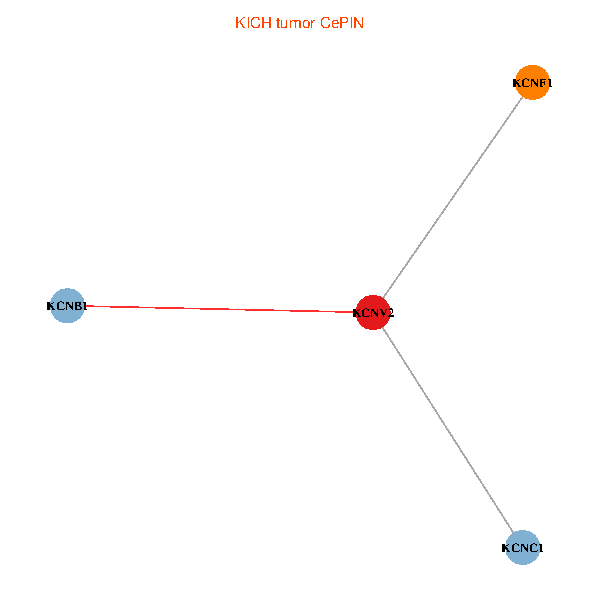
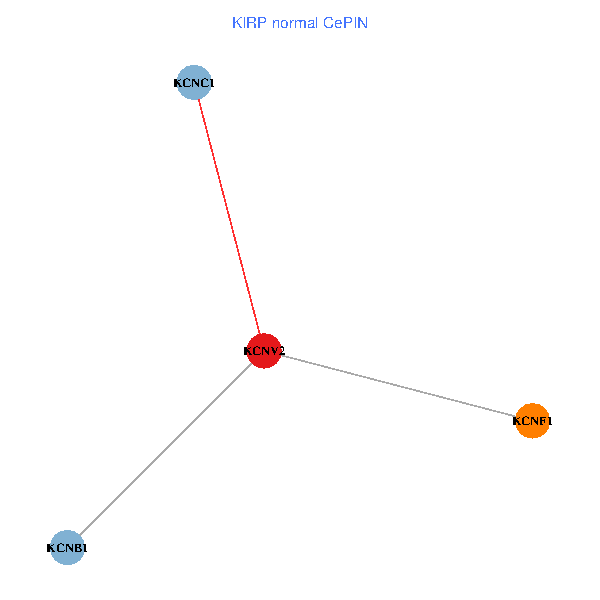
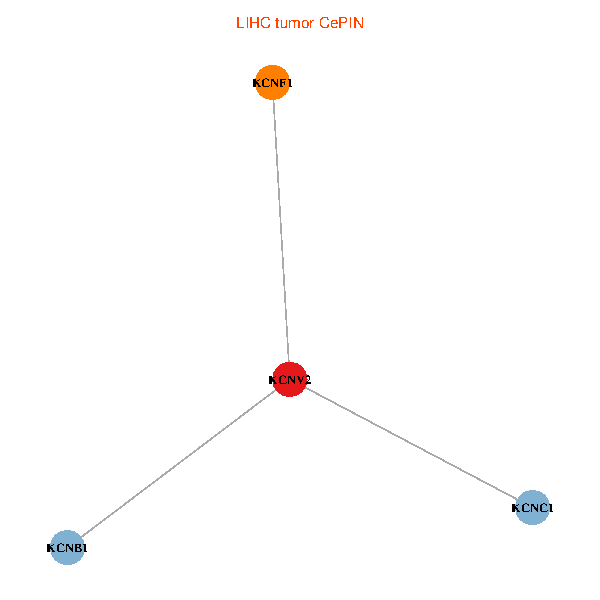
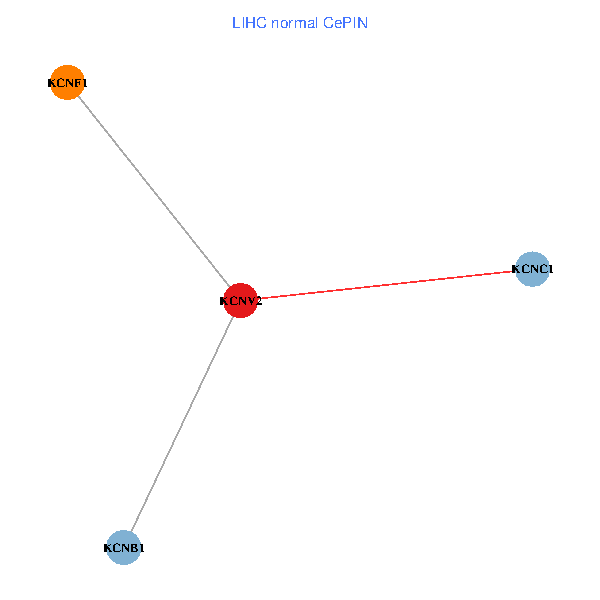
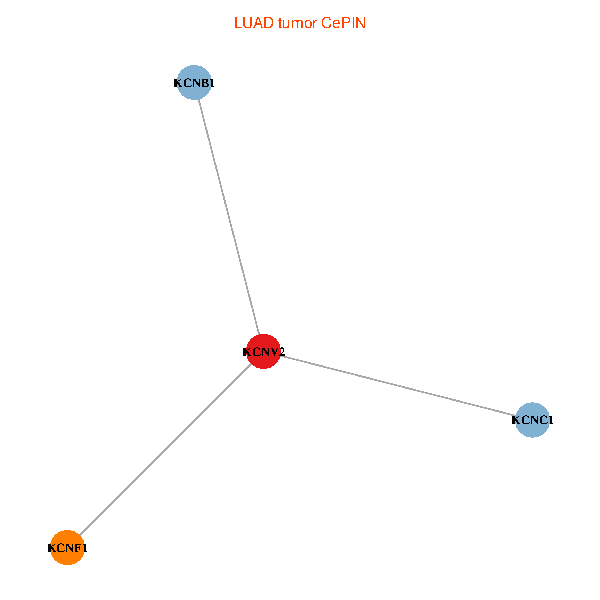
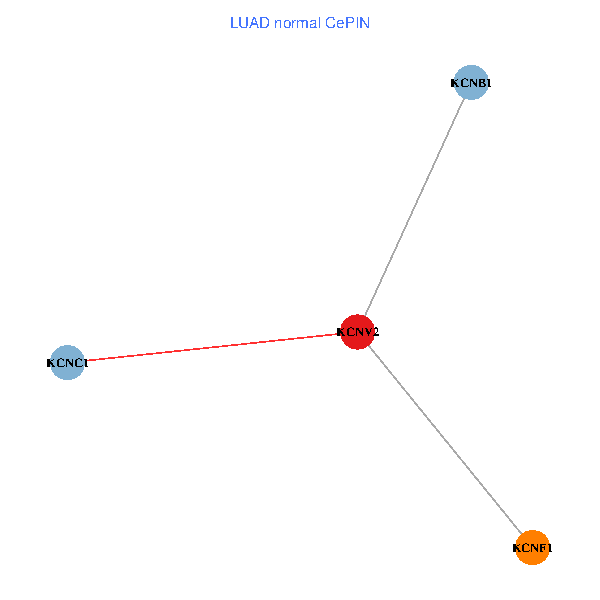
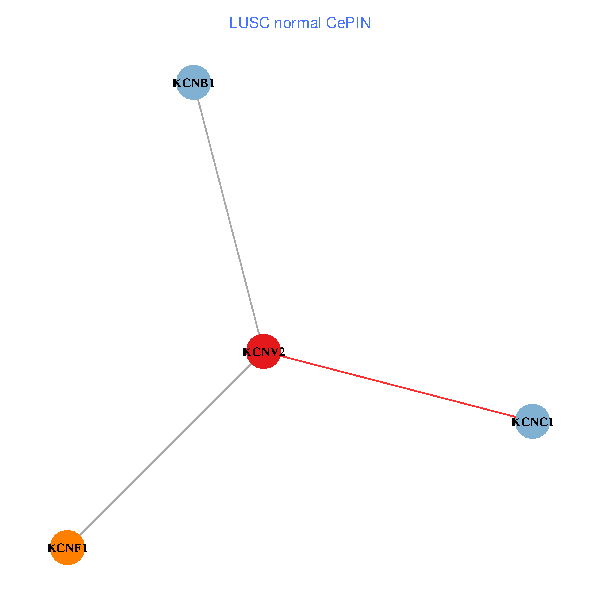
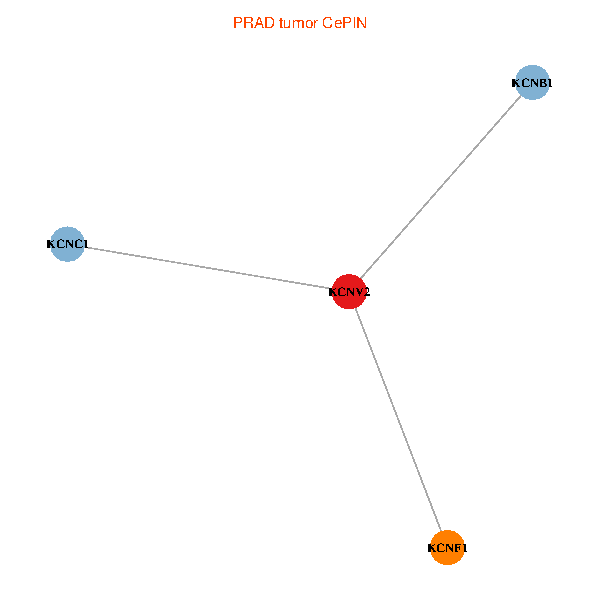
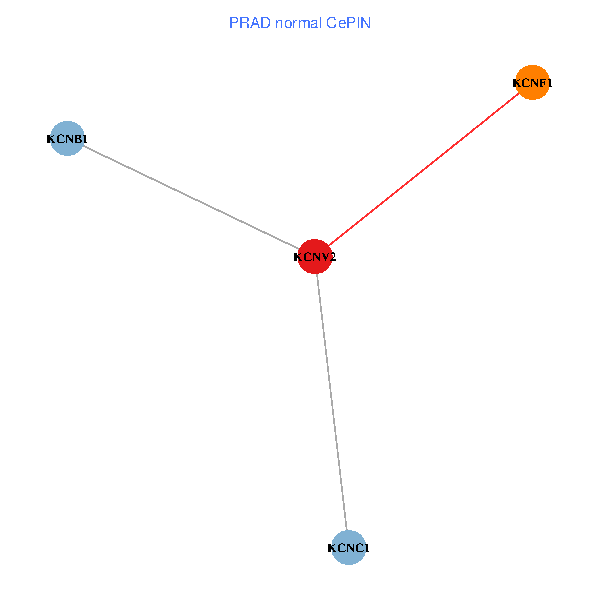
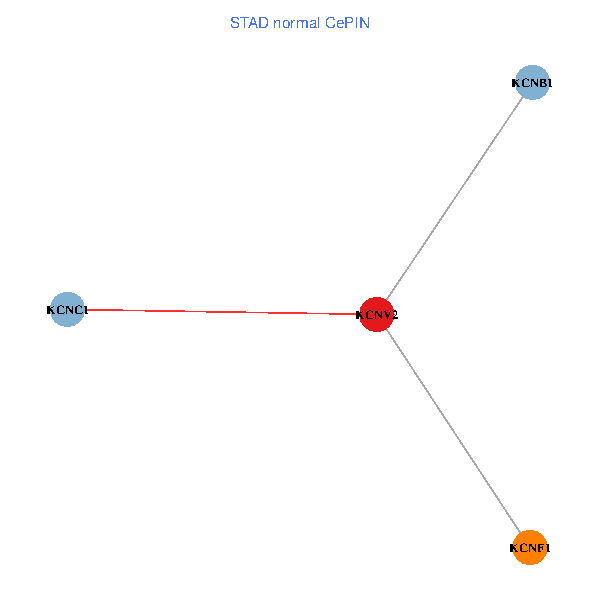
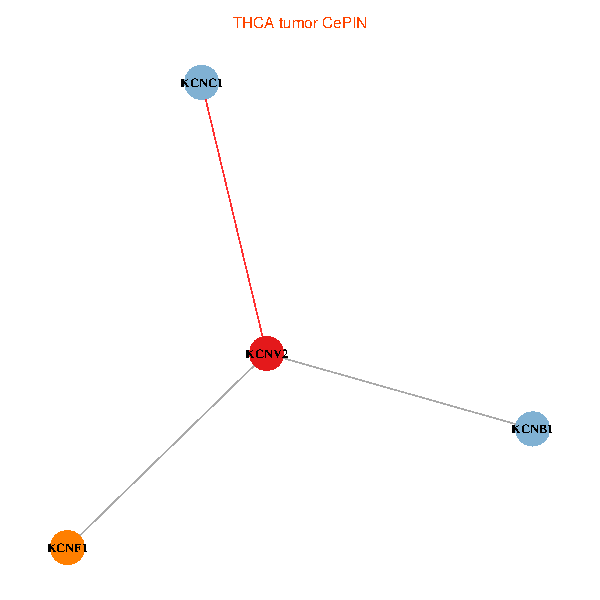
| Co-expressed gene networks based on protein-protein interaction data (CePIN) (TCGA IlluminaHiSeq_RNASeqV2, pan-cancer normalized log2(norm_counts+1) data, version 2016-08-16) (PINA2 ppi data) |
| BRCA (tumor) | BRCA (normal) |
| KCNV2, KCNC1, KCNB1, KCNF1 (tumor) | KCNV2, KCNC1, KCNB1, KCNF1 (normal) |
 |  |
| COAD (tumor) | COAD (normal) |
| KCNV2, KCNC1, KCNB1, KCNF1 (tumor) | KCNV2, KCNC1, KCNB1, KCNF1 (normal) |
 |  |
| HNSC (tumor) | HNSC (normal) |
| KCNV2, KCNC1, KCNB1, KCNF1 (tumor) | KCNV2, KCNC1, KCNB1, KCNF1 (normal) |
 |  |
| KICH (tumor) | KICH (normal) |
| KCNV2, KCNC1, KCNB1, KCNF1 (tumor) | KCNV2, KCNC1, KCNB1, KCNF1 (normal) |
 |  |
| KIRC (tumor) | KIRC (normal) |
| KCNV2, KCNC1, KCNB1, KCNF1 (tumor) | KCNV2, KCNC1, KCNB1, KCNF1 (normal) |
 |  |
| KIRP (tumor) | KIRP (normal) |
| KCNV2, KCNC1, KCNB1, KCNF1 (tumor) | KCNV2, KCNC1, KCNB1, KCNF1 (normal) |
 |  |
| LIHC (tumor) | LIHC (normal) |
| KCNV2, KCNC1, KCNB1, KCNF1 (tumor) | KCNV2, KCNC1, KCNB1, KCNF1 (normal) |
 |  |
| LUAD (tumor) | LUAD (normal) |
| KCNV2, KCNC1, KCNB1, KCNF1 (tumor) | KCNV2, KCNC1, KCNB1, KCNF1 (normal) |
 |  |
| LUSC (tumor) | LUSC (normal) |
| KCNV2, KCNC1, KCNB1, KCNF1 (tumor) | KCNV2, KCNC1, KCNB1, KCNF1 (normal) |
 |  |
| PRAD (tumor) | PRAD (normal) |
| KCNV2, KCNC1, KCNB1, KCNF1 (tumor) | KCNV2, KCNC1, KCNB1, KCNF1 (normal) |
 |  |
| STAD (tumor) | STAD (normal) |
| KCNV2, KCNC1, KCNB1, KCNF1 (tumor) | KCNV2, KCNC1, KCNB1, KCNF1 (normal) |
 |  |
| THCA (tumor) | THCA (normal) |
| KCNV2, KCNC1, KCNB1, KCNF1 (tumor) | KCNV2, KCNC1, KCNB1, KCNF1 (normal) |
 |  |
| Top |
| TissGeneProg for KCNV2 |
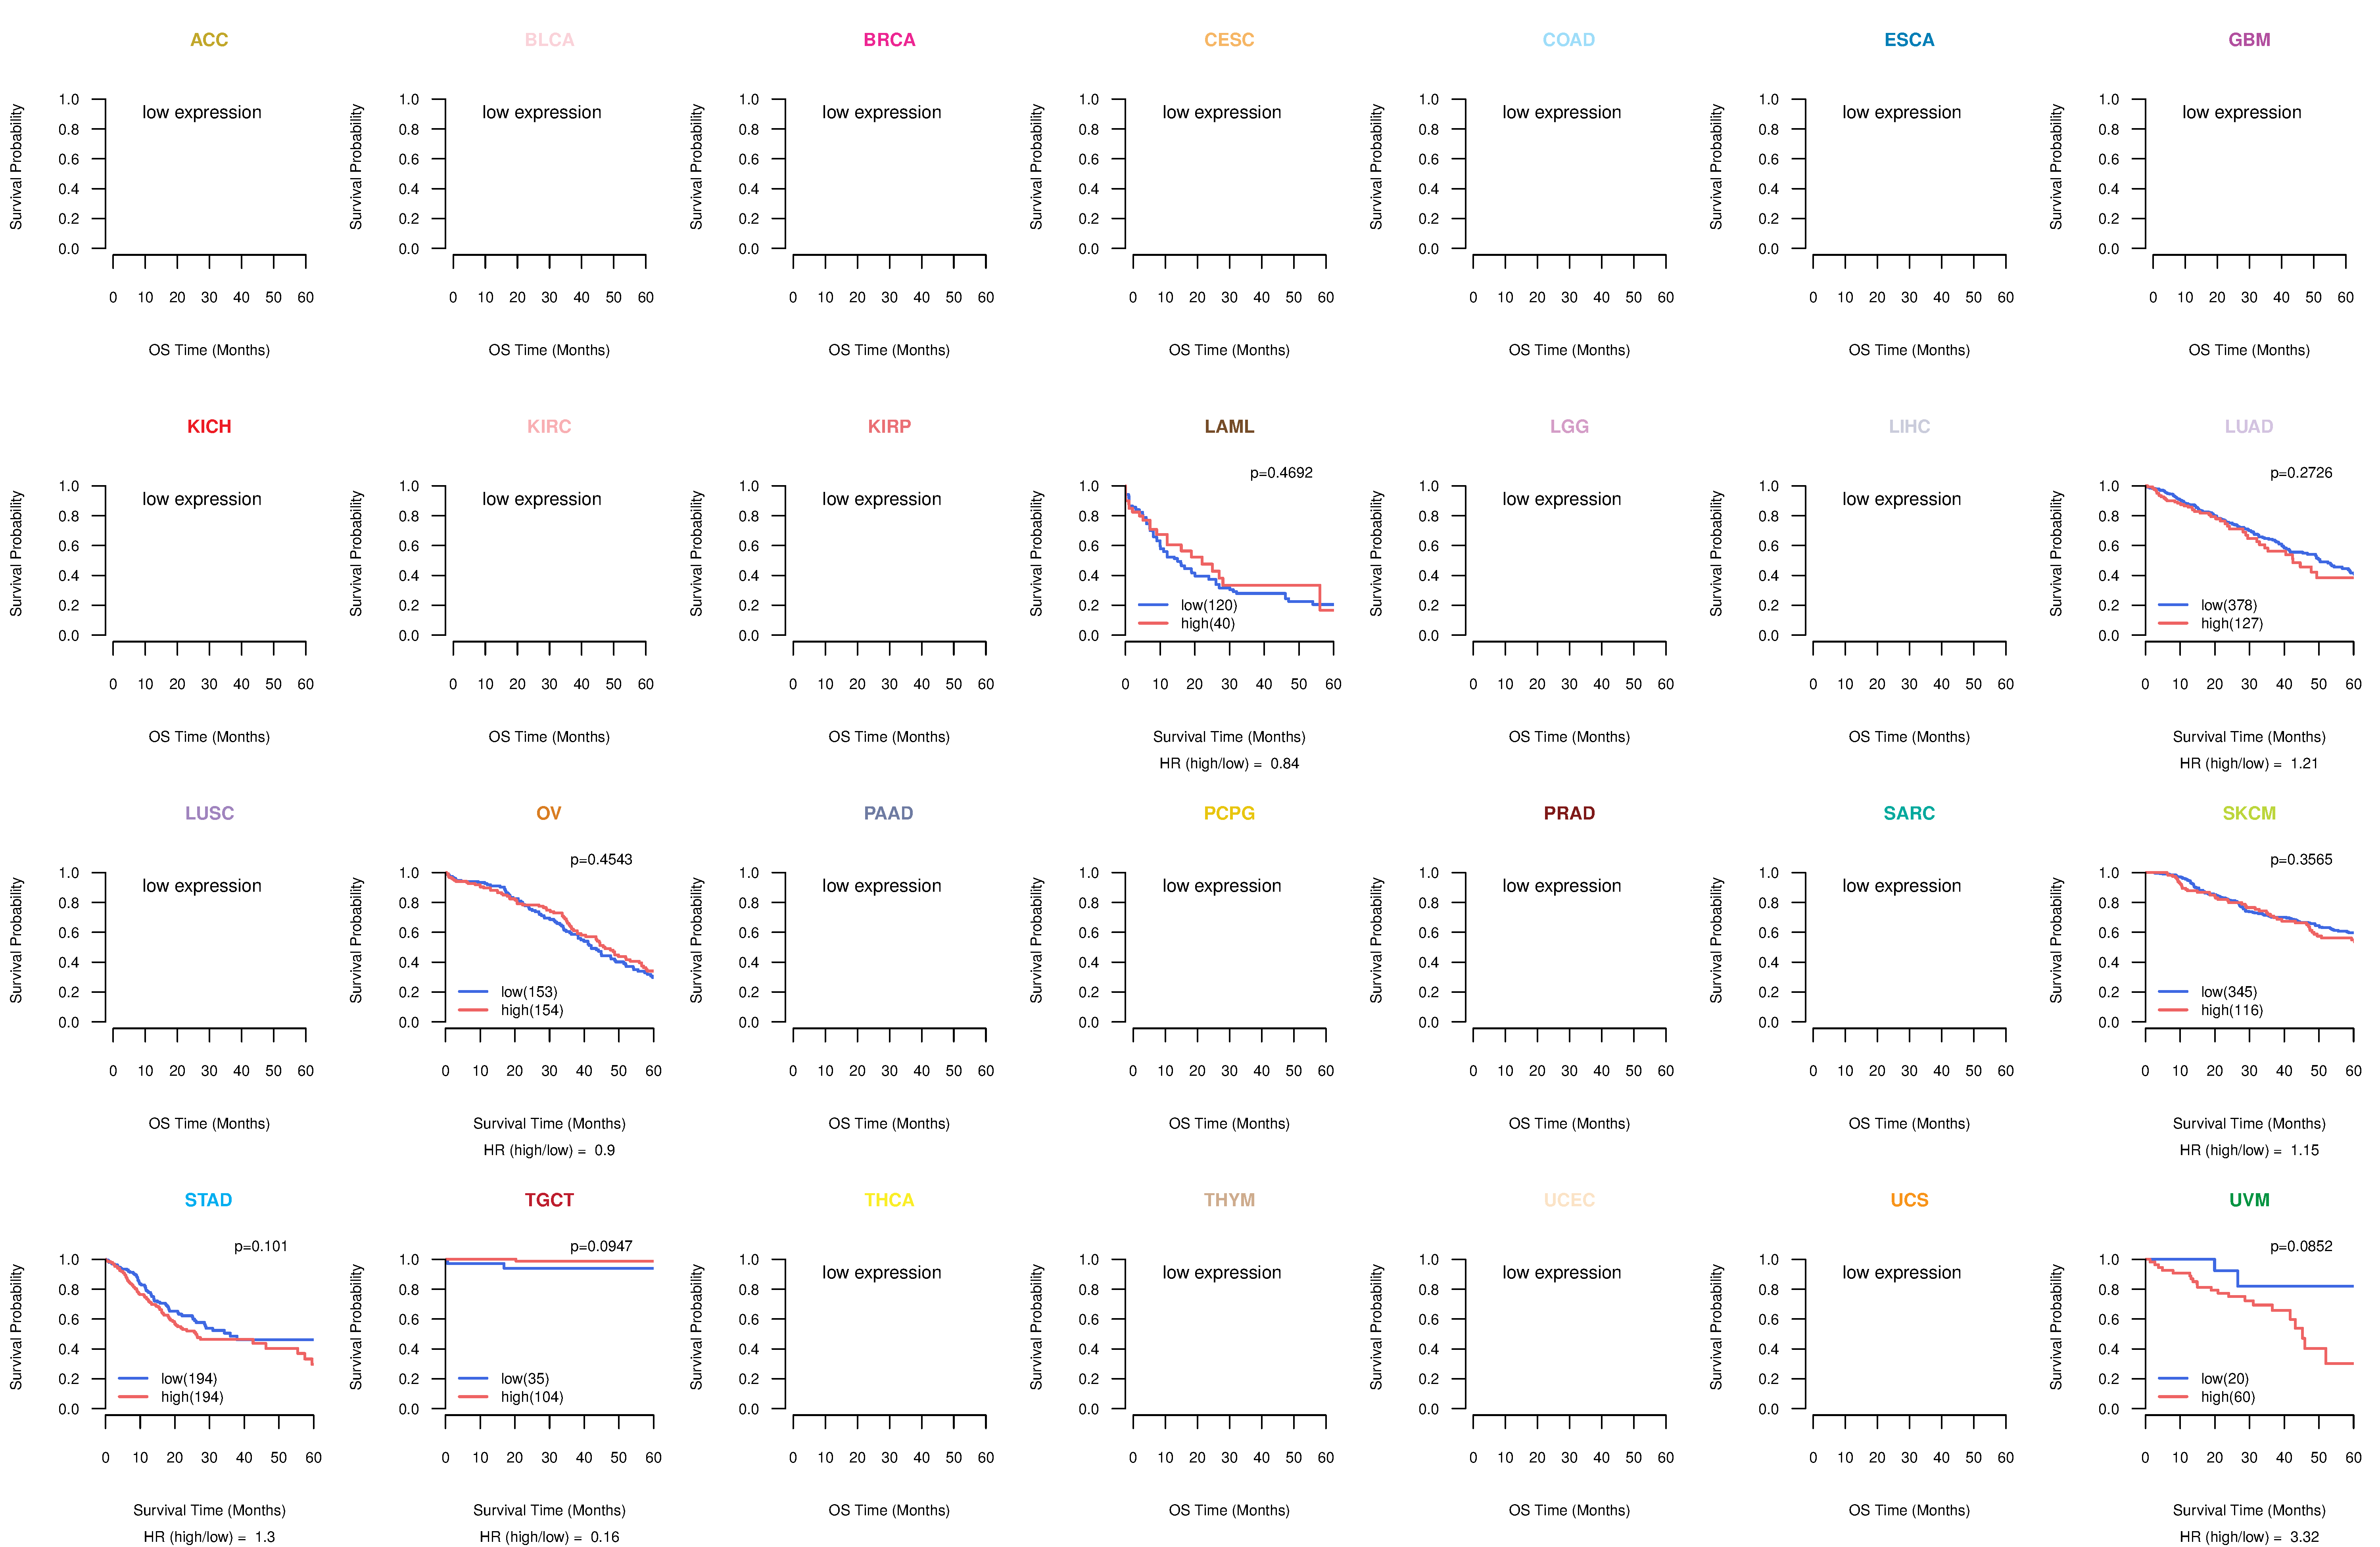
| Kaplan-Meier plots with logrank tests of overall survival (OS) using 28 cancer types (TCGA IlluminaHiSeq_RNASeqV2, pan-cancer normalized log2(norm_counts+1) data, version 2016-08-16) (TCGA clinicalMatrix, phenotype data, version 2016-04-27) * Click on the image to enlarge it in a new window. |
 |
| Kaplan-Meier plots with logrank test of relapse free survival (RFS) using 28 cancer types (TCGA IlluminaHiSeq_RNASeqV2, pan-cancer normalized log2(norm_counts+1) data, version 2016-08-16) (TCGA clinicalMatrix, phenotype data, version 2016-04-27) * Click on the image enlarge it in a new window. |
 |
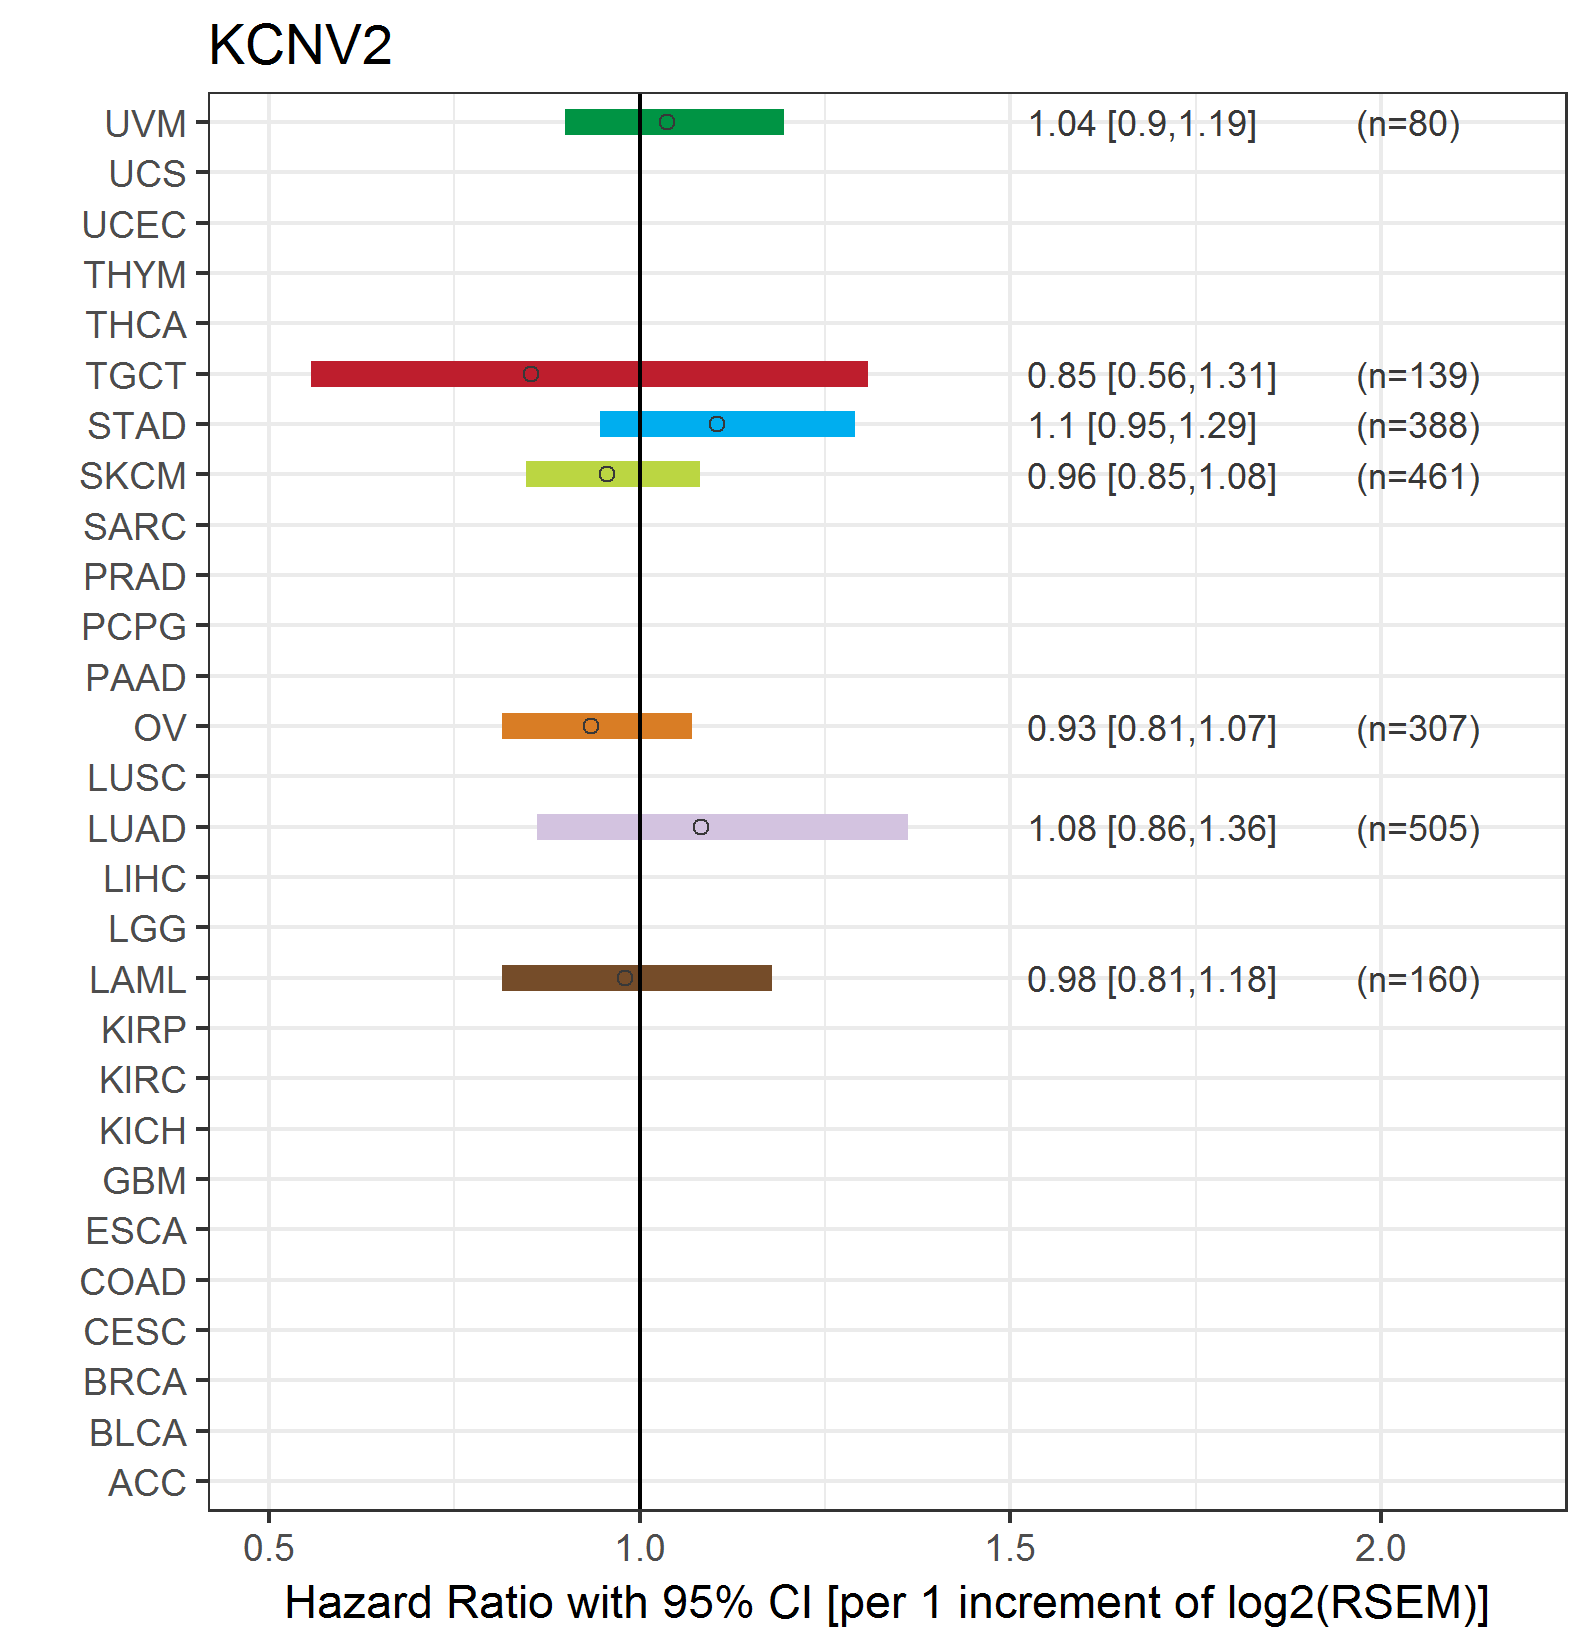
| Forest plot of Cox proportional hazard ratio (HR) and 95% CI of overall survival (OS) using 28 cancer types (TCGA IlluminaHiSeq_RNASeqV2, pan-cancer normalized log2(norm_counts+1) data, version 2016-08-16) (TCGA clinicalMatrix, phenotype data, version 2016-04-27) * Click on the image enlarge it in a new window. |
 |
| Forest plot of Cox proportional hazard ratio (HR) and 95% CI of relapse free survival (RFS) using 28 cancer types (TCGA IlluminaHiSeq_RNASeqV2, pan-cancer normalized log2(norm_counts+1) data, version 2016-08-16) (TCGA clinicalMatrix, phenotype data, version 2016-04-27) * Click on the image enlarge it in a new window. |
 |
| Top |
| TissGeneClin for KCNV2 |
| TissGeneDrug for KCNV2 |
| Drug information targeting TissGene (DrugBank Version 5.0.6, 2017-04-01) |
| DrugBank ID | Drug name | Drug activity | Drug type | Drug status |
| Top |
| TissGeneDisease for KCNV2 |
| Disease information associated with TissGene (DisGeNet, 2016-06-01) |
| Disease ID | Disease name | # pubmeds | Source |
| umls:C0730290 | Cone dystrophy | 11 | BeFree |
| umls:C0023976 | Long QT Syndrome | 7 | BeFree |
| umls:C0035309 | Retinal Diseases | 4 | BeFree |
| umls:C0018790 | Cardiac Arrest | 2 | BeFree |
| umls:C1835897 | Retinal Cone Dystrophy 3B | 2 | BeFree,CLINVAR,CTD_human,ORPHANET,UNIPROT |
| umls:C0015397 | Disorder of eye | 1 | BeFree |
| umls:C0017638 | Glioma | 1 | BeFree |
| umls:C0854723 | Retinal Dystrophies | 1 | BeFree |
| umls:C1141890 | Congenital long QT syndrome | 1 | BeFree |
| umls:C1621958 | Glioblastoma Multiforme | 1 | BeFree |
|
Copyright 2016-Present - The University of Texas Health Science Center at Houston (UTHealth) Web File Viewing | How to Report, Fraud, Waste and Abuse | State of Texas | Statewide Search | Texas Homeland Security | Site Policies |