 |
| |
| |
| |
| |
| |
| |
|

| TissGeneSummary for CYS1 |
 Gene summary Gene summary |
| Basic gene information | Gene symbol | CYS1 |
| Gene name | cystin 1 | |
| Synonyms | - | |
| Cytomap | UCSC genome browser: 2p25.1 | |
| Type of gene | protein-coding | |
| RefGenes | NM_001037160.2, | |
| Description | cilia-associated proteincystin-1 | |
| Modification date | 20141207 | |
| dbXrefs | HGNC : HGNC | |
| Ensembl : ENSG00000205795 | ||
| HPRD : 18744 | ||
| Vega : OTTHUMG00000151703 | ||
| Protein | UniProt: go to UniProt's Cross Reference DB Table | |
| Expression | CleanEX: HS_CYS1 | |
| BioGPS: 192668 | ||
| Pathway | NCI Pathway Interaction Database: CYS1 | |
| KEGG: CYS1 | ||
| REACTOME: CYS1 | ||
| Pathway Commons: CYS1 | ||
| Context | iHOP: CYS1 | |
| ligand binding site mutation search in PubMed: CYS1 | ||
| UCL Cancer Institute: CYS1 | ||
| Assigned class in TissGDB* | C | |
| Included tissue-specific gene expression resources | HPA,GTEx | |
| Specific-tissues in normal samples (assigned by TissGDB using HPA, TiGER, and GTEx) | Kidney | |
| Cancer types related to the specific-tissues in cancer samples (assigned by TissGDB using TCGA) | KIRC,KIRP,KICH | |
| Reference showing the relevant tissue of CYS1 | ||
| Description by TissGene annotations | ||
| * Class A consists of genes with literature evidence and is part of the cTissGenes. Class B consists of only cTissGenes without additional evidence. The remaining genes belong to Class C. |
| Gene ontology having evidence of Inferred from Direct Assay (IDA) from Entrez |
| GO ID | GO term | PubMed ID |
| Top |
| TissGeneExp for CYS1 |
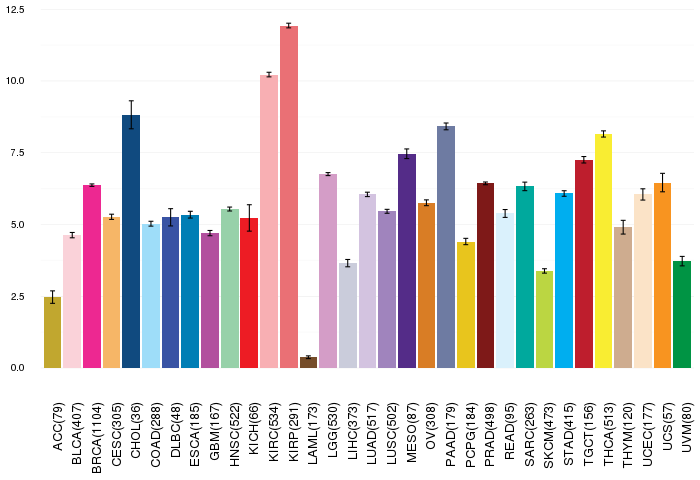
| Gene expressions across 28 cancer types (X-axis: cancer type and Y-axis: log2(norm_counts+1)) (TCGA IlluminaHiSeq_RNASeqV2, pan-cancer normalized log2(norm_counts+1) data, version 2016-08-16) |
 |
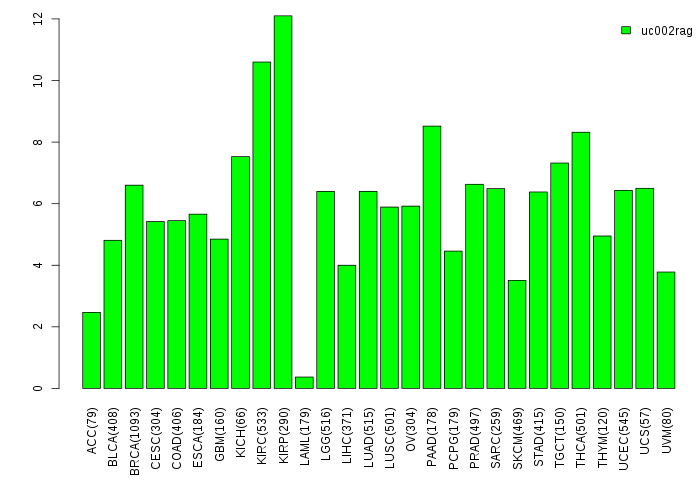
| Gene isoform expressions across 28 cancer types (X-axis: cancer type and Y-axis: log2(norm_counts+1)) (TCGA pan-cancer tcga_rsem_isoform_tpm, version 2016-09-01) |
 |
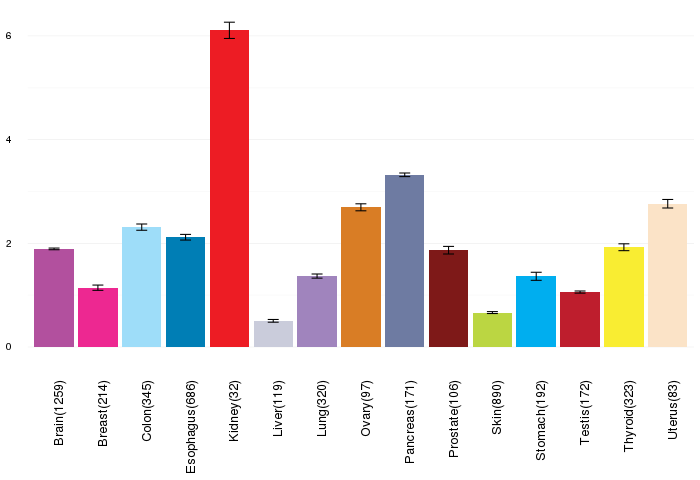
| Gene expressions across normal tissues of GTEx data (GTEx GTEx_Analysis_v6_RNA-seq_RNA-SeQCv1.1.8_gene_rpkm.gct) - Here, we shows the matched tissue types only among our 28 cancer types. |
 |
| Different expressions across 14 cancer types with more than 10 samples between matched tumors and normals (X-axis: cancer type and Y-axis: log2(norm_counts+1)) (TCGA IlluminaHiSeq_RNASeqV2, pan-cancer normalized log2(norm_counts+1) data, version 2016-08-16) |
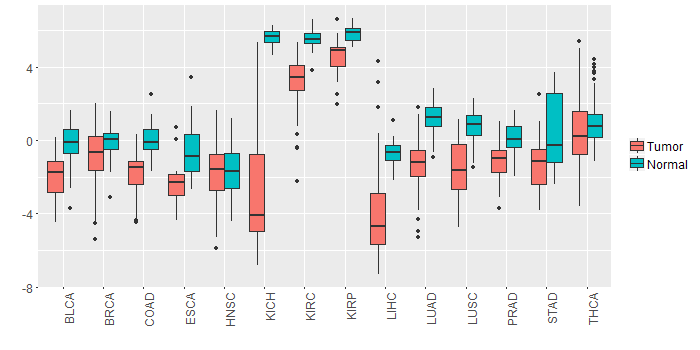 |
| - Significantly differentially expressed cancer types and information. (|Fold change|>1 and FDR<0.05) |
| Cancer type | Mean(exp) in tumor | Mean(exp) in matched normal | Log2FC | P-val. | FDR |
| KIRC | 3.199772435 | 5.534665491 | -2.334893056 | 4.65E-23 | 4.69E-22 |
| LUSC | -1.490971764 | 0.795973334 | -2.286945098 | 6.73E-14 | 3.57E-13 |
| KICH | -2.702631842 | 5.657792158 | -8.360424 | 2.39E-12 | 2.62E-11 |
| KIRP | 4.601572783 | 5.837422783 | -1.23585 | 3.27E-08 | 2.24E-07 |
| PRAD | -1.137196689 | 0.042230235 | -1.179426923 | 1.09E-09 | 1.71E-08 |
| LUAD | -1.298588532 | 1.162342502 | -2.460931034 | 8.23E-20 | 1.59E-18 |
| COAD | -1.844517842 | 0.12738985 | -1.971907692 | 1.90E-07 | 1.27E-06 |
| LIHC | -3.982869842 | -0.668795842 | -3.314074 | 6.49E-12 | 1.08E-10 |
| BLCA | -1.885188895 | -0.251078369 | -1.634110526 | 0.000379 | 0.00321716 |
| STAD | -1.440364717 | 0.429350908 | -1.869715625 | 7.54E-05 | 0.000599204 |
| Top |
| TissGene-miRNA for CYS1 |
| Significantly anti-correlated miRNAs of TissGene across 28 cancer types (Gene-miRNA relations from TargetScanHuman Relsease 7.1, Conserved_Site_Context_Scores.txt.zip, 06.01.2016) (TCGA IlluminaHiSeq_miRNASeq, log2(RPM+1) data, version 2016-11-21) (TCGA IlluminaHiSeq_RNASeqV2, log2(normalized_count+1) data, version 2016-08-16) (Spearman’s Rank Correlation (p-value<0.05 and coefficient<-0.25)) |
| Cancer type | miRNA id | miRNA accession | P-val. | Coeff. | # samples |
| Top |
| TissGeneMut for CYS1 |
| TissGeneSNV for CYS1 |
| nsSNV counts per each loci. Different colors of circles represent different cancer types. Circle size denotes number of samples. (TCGA somatic mutation (SNPs and small INDELs) data, version 2016-04-25) * Click on the image to enlarge it in a new window. |
 |
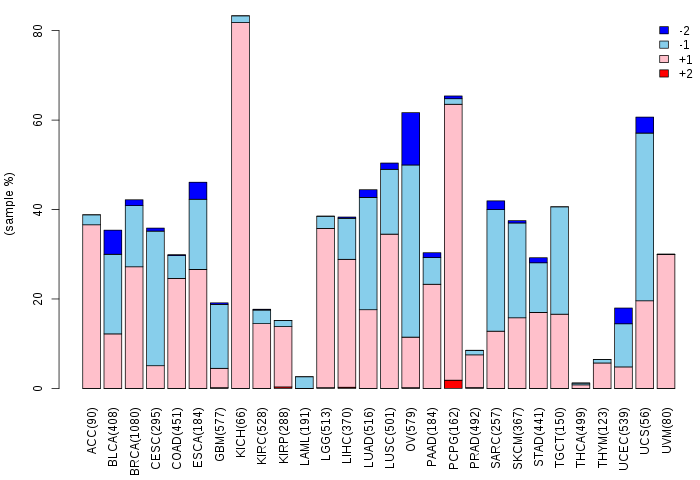
| Somatic nucleotide variants of TissGene across 28 cancer types (X-axis: cancer type and Y-axis: % of mutated samples) The numbers in parentheses are numbers of samples with mutation (nsSNVs). (TCGA somatic mutation (SNPs and small INDELs) data, version 2016-04-25) |
 |
| - nsSNVs sorted by frequency. |
| AAchange | Cancer type | # samples |
| p.P136L | COAD | 1 |
| p.S119R | LUAD | 1 |
| p.E155K | SKCM | 1 |
| p.S144L | PRAD | 1 |
| p.E146K | SKCM | 1 |
| p.P136L | UCEC | 1 |
| Top |
| TissGeneCNV for CYS1 |
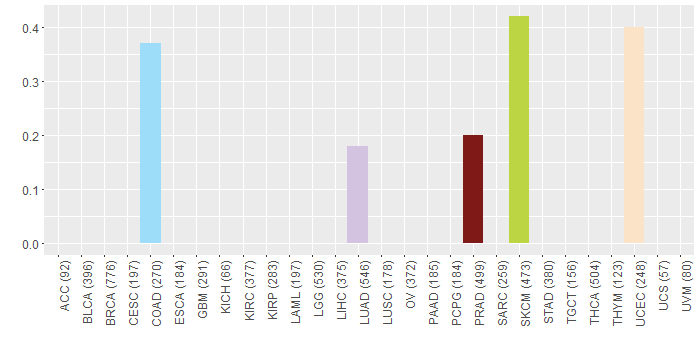
| Copy number variations of TissGene across 28 cancer types (X-axis: cancer type and Y-axis: % of CNV samples) (TCGA Gistic2_CopyNumber_Gistic2_all_data_by_genes, Gistic2 copy number data, version 2016-08-16) |
 |
| Top |
| TissGeneFusions for CYS1 |
| Fusion genes including TissGene (ChimerDB 3.0, 2016-12-01 and TCGA fusion Portal 2015-12-01) |
| Database | Src | Cancer type | Sample | Fusion gene | ORF | 5'-gene BP | 3'-gene BP |
| Top |
| TissGeneNet for CYS1 |
| Co-expressed gene networks based on protein-protein interaction data (CePIN) (TCGA IlluminaHiSeq_RNASeqV2, pan-cancer normalized log2(norm_counts+1) data, version 2016-08-16) (PINA2 ppi data) |
| Top |
| TissGeneProg for CYS1 |
| Kaplan-Meier plots with logrank tests of overall survival (OS) using 28 cancer types (TCGA IlluminaHiSeq_RNASeqV2, pan-cancer normalized log2(norm_counts+1) data, version 2016-08-16) (TCGA clinicalMatrix, phenotype data, version 2016-04-27) * Click on the image to enlarge it in a new window. |
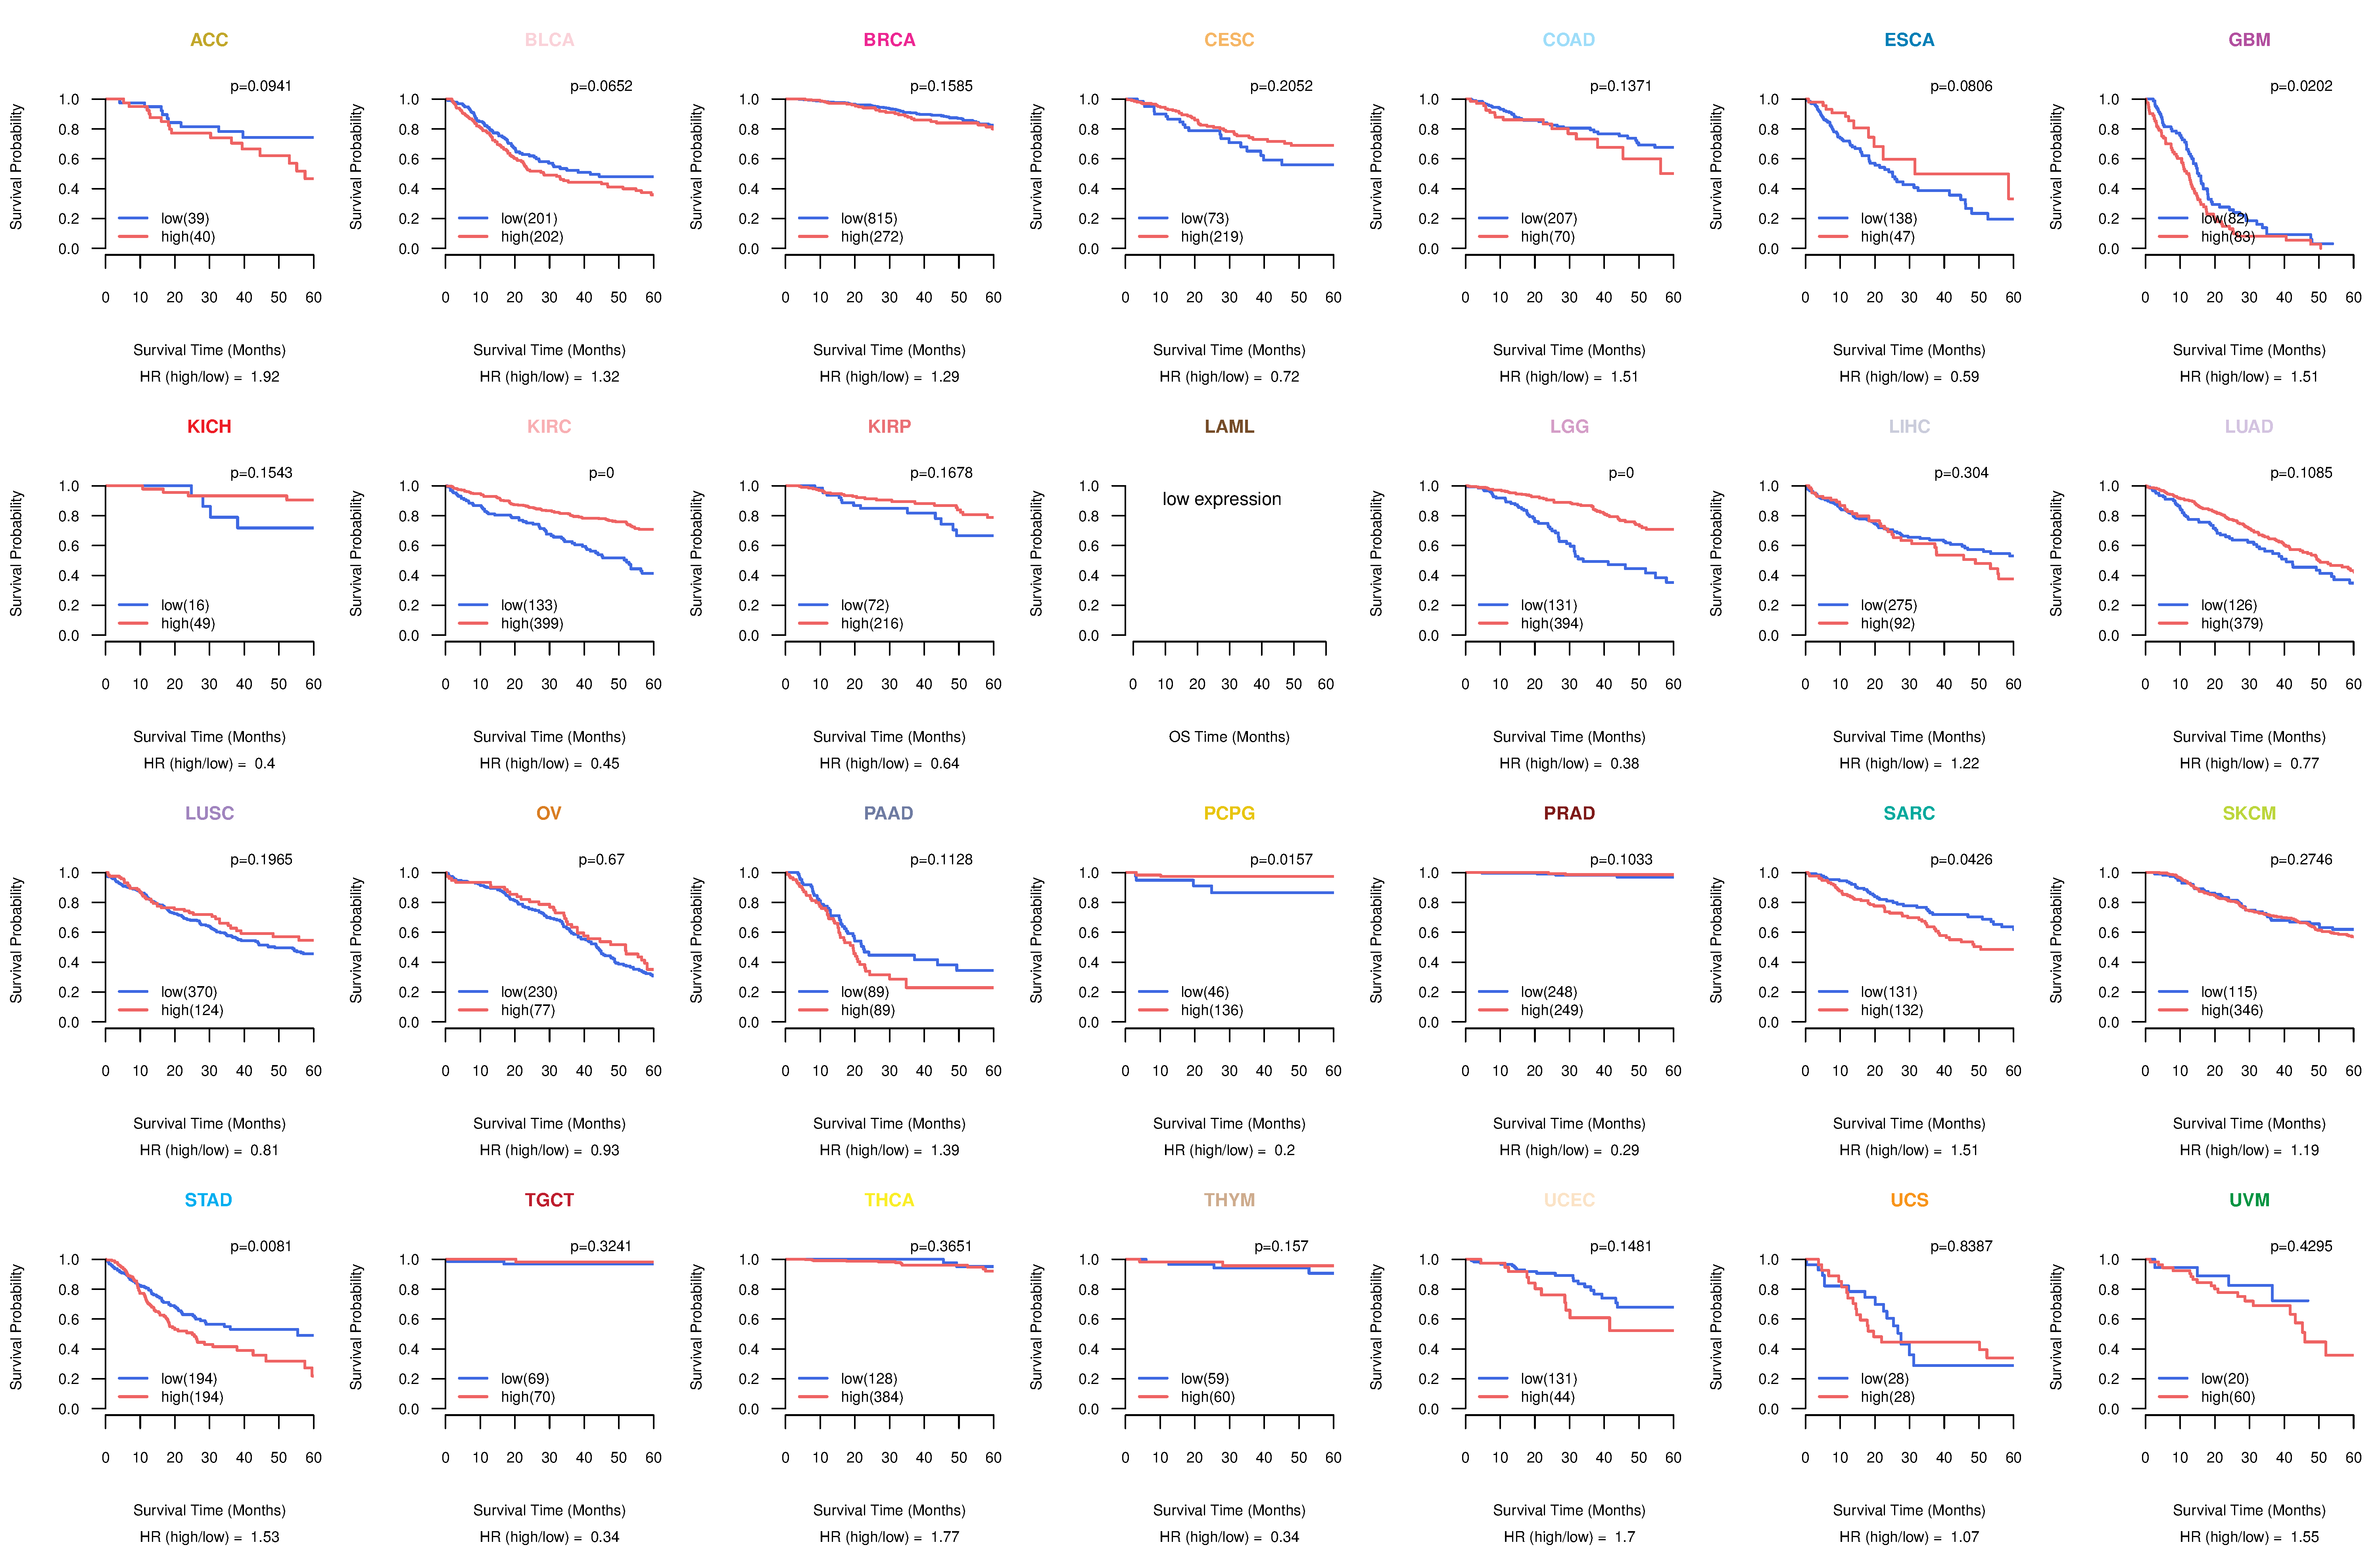 |
| Kaplan-Meier plots with logrank test of relapse free survival (RFS) using 28 cancer types (TCGA IlluminaHiSeq_RNASeqV2, pan-cancer normalized log2(norm_counts+1) data, version 2016-08-16) (TCGA clinicalMatrix, phenotype data, version 2016-04-27) * Click on the image enlarge it in a new window. |
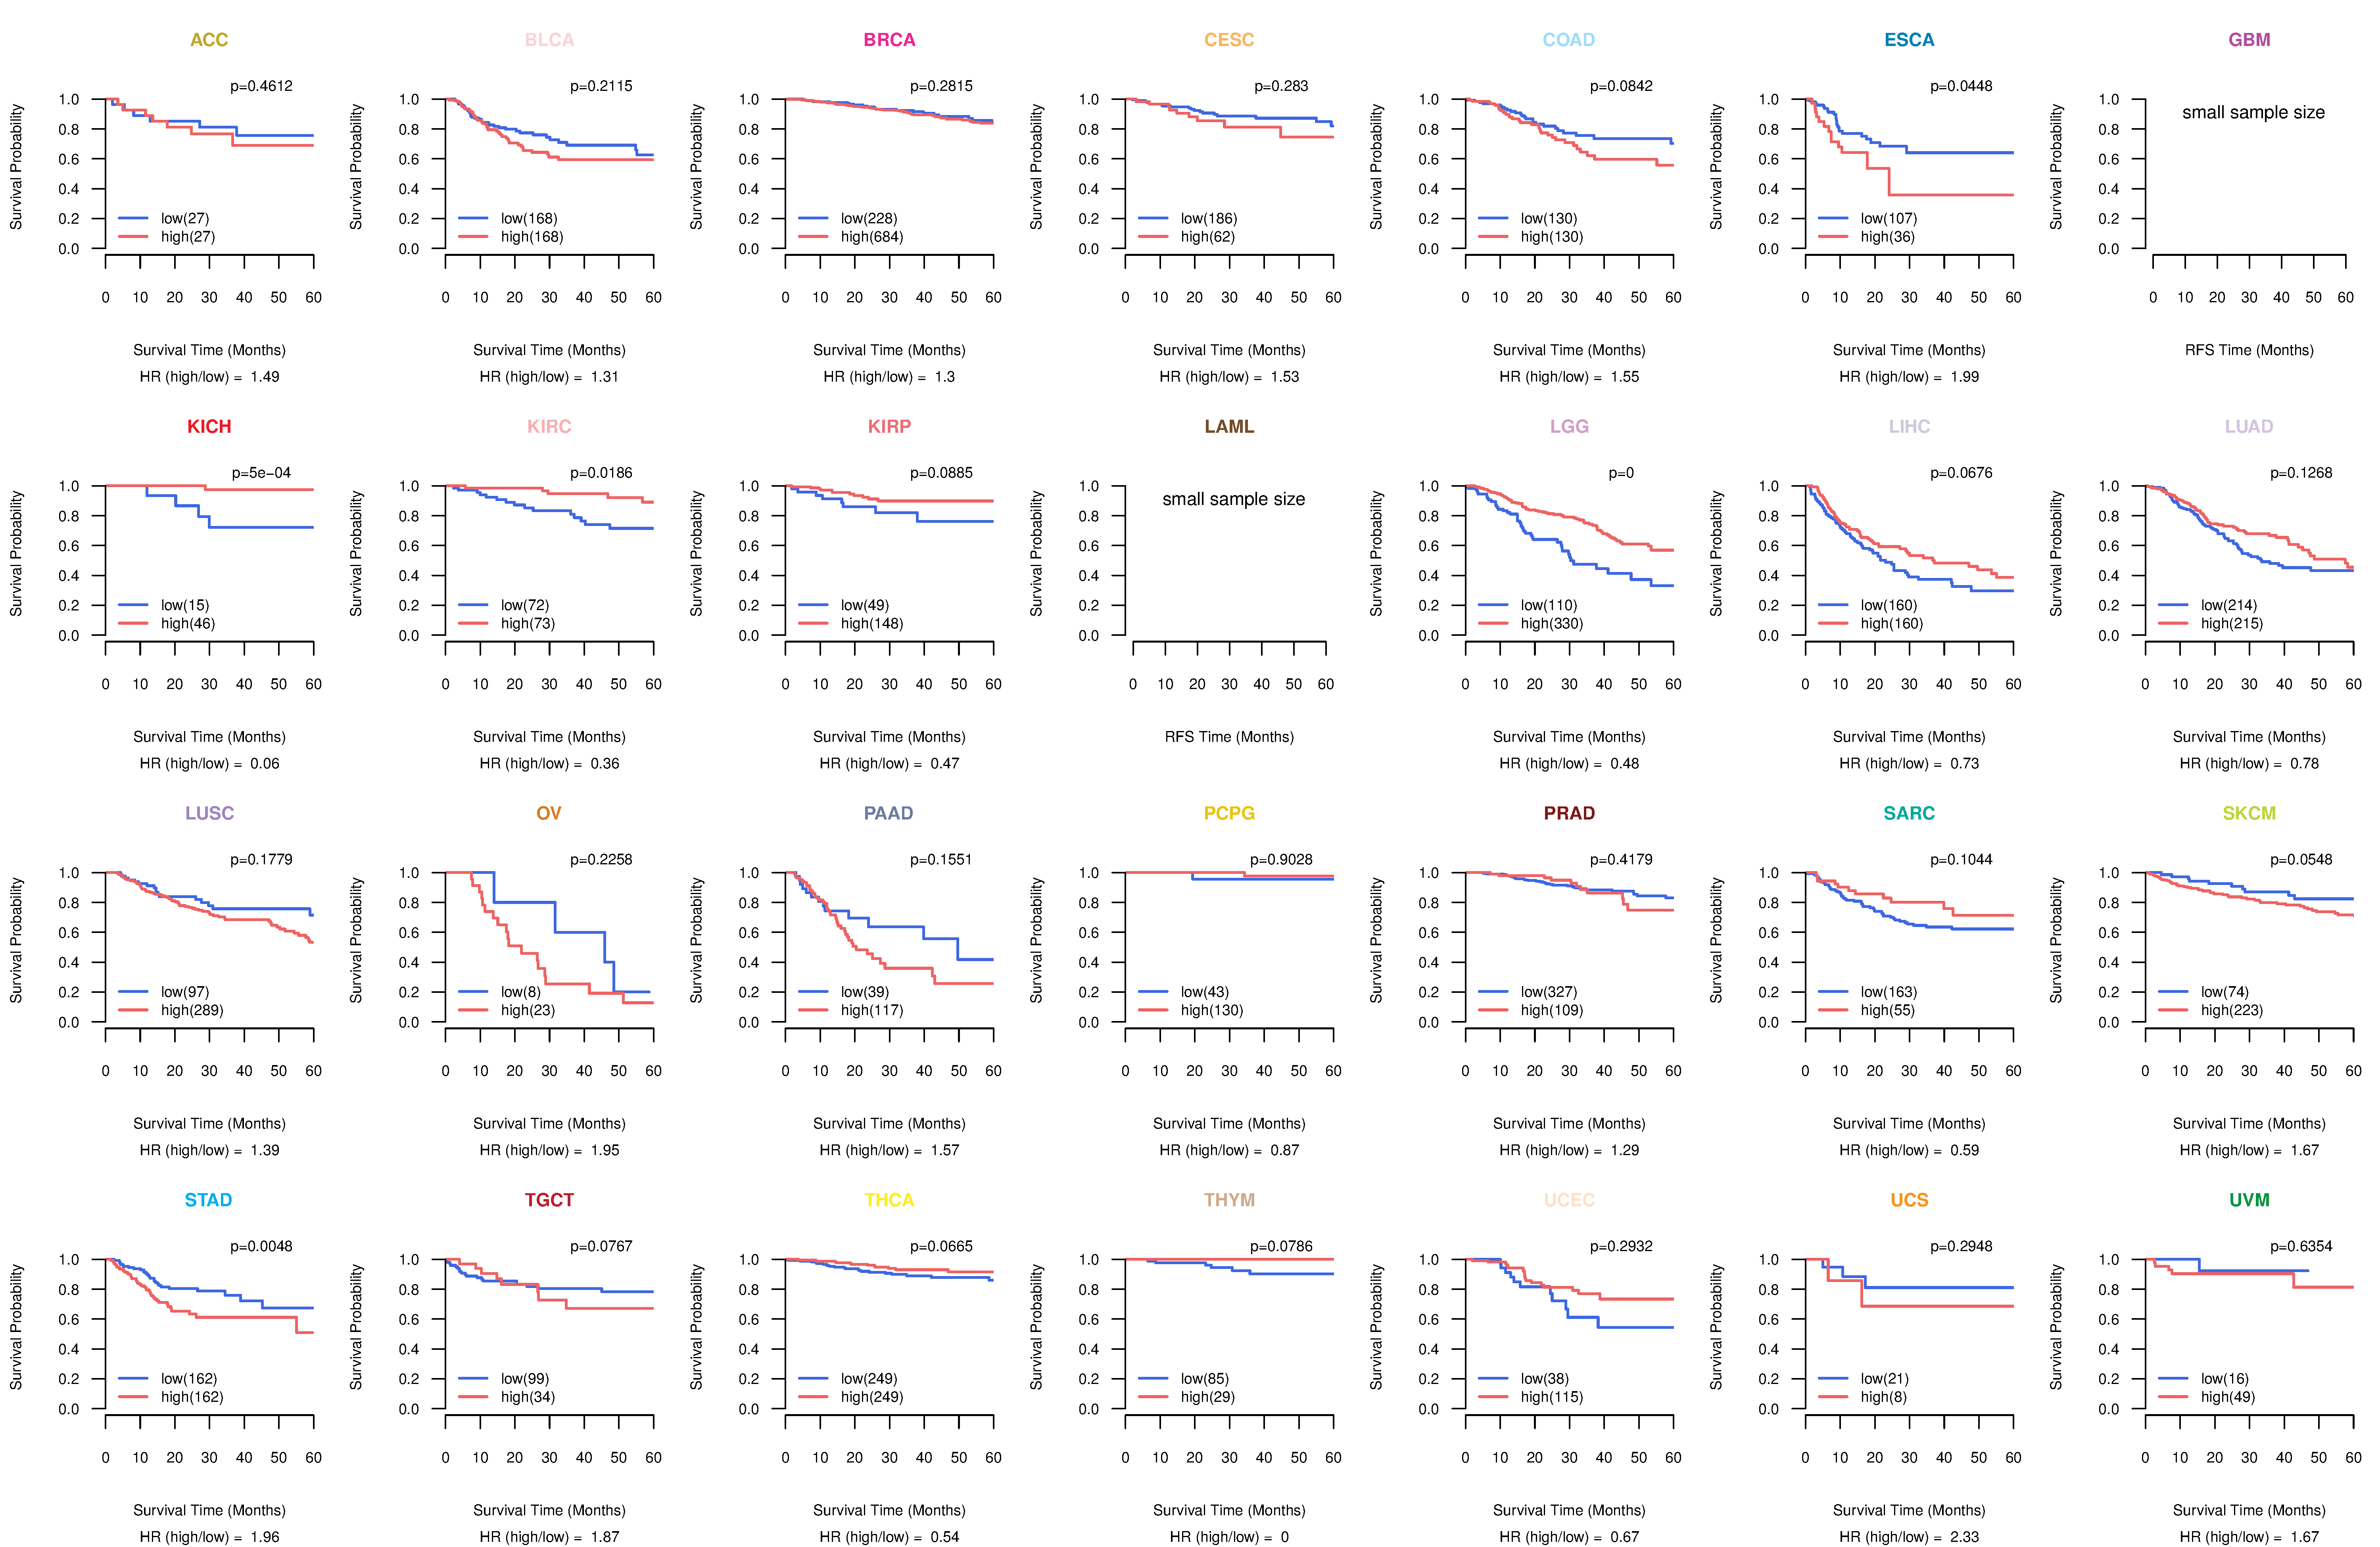 |
| Forest plot of Cox proportional hazard ratio (HR) and 95% CI of overall survival (OS) using 28 cancer types (TCGA IlluminaHiSeq_RNASeqV2, pan-cancer normalized log2(norm_counts+1) data, version 2016-08-16) (TCGA clinicalMatrix, phenotype data, version 2016-04-27) * Click on the image enlarge it in a new window. |
 |
| Forest plot of Cox proportional hazard ratio (HR) and 95% CI of relapse free survival (RFS) using 28 cancer types (TCGA IlluminaHiSeq_RNASeqV2, pan-cancer normalized log2(norm_counts+1) data, version 2016-08-16) (TCGA clinicalMatrix, phenotype data, version 2016-04-27) * Click on the image enlarge it in a new window. |
 |
| Top |
| TissGeneClin for CYS1 |
| TissGeneDrug for CYS1 |
| Drug information targeting TissGene (DrugBank Version 5.0.6, 2017-04-01) |
| DrugBank ID | Drug name | Drug activity | Drug type | Drug status |
| Top |
| TissGeneDisease for CYS1 |
| Disease information associated with TissGene (DisGeNet, 2016-06-01) |
| Disease ID | Disease name | # pubmeds | Source |
| umls:C0008677 | Bronchitis, Chronic | 1 | GWASCAT |
| umls:C0024117 | Chronic Obstructive Airway Disease | 1 | GWASCAT |
| umls:C0085548 | Autosomal Recessive Polycystic Kidney Disease | 1 | BeFree,MGD |
| umls:C0268800 | Simple renal cyst | 1 | BeFree |
| umls:C0687120 | Nephronophthisis | 1 | BeFree |
|
Copyright 2016-Present - The University of Texas Health Science Center at Houston (UTHealth) Web File Viewing | How to Report, Fraud, Waste and Abuse | State of Texas | Statewide Search | Texas Homeland Security | Site Policies |