 |
| |
| |
| |
| |
| |
| |
|

| TissGeneSummary for EHHADH |
 Gene summary Gene summary |
| Basic gene information | Gene symbol | EHHADH |
| Gene name | enoyl-CoA, hydratase/3-hydroxyacyl CoA dehydrogenase | |
| Synonyms | ECHD|FRTS3|L-PBE|LBFP|LBP|PBFE | |
| Cytomap | UCSC genome browser: 3q26.3-q28 | |
| Type of gene | protein-coding | |
| RefGenes | NM_001166415.1, NM_001966.3, | |
| Description | 3,2-trans-enoyl-CoA isomeraseL-3-hydroxyacyl-CoA dehydrogenaseL-bifunctional protein, peroxisomalPBEenoyl-Coenzyme A, hydratase/3-hydroxyacyl Coenzyme A dehydrogenaseperoxisomal bifunctional enzymeperoxisomal enoyl-CoA hydratase | |
| Modification date | 20141207 | |
| dbXrefs | MIM : 607037 | |
| HGNC : HGNC | ||
| Ensembl : ENSG00000113790 | ||
| HPRD : 06125 | ||
| Vega : OTTHUMG00000156698 | ||
| Protein | UniProt: go to UniProt's Cross Reference DB Table | |
| Expression | CleanEX: HS_EHHADH | |
| BioGPS: 1962 | ||
| Pathway | NCI Pathway Interaction Database: EHHADH | |
| KEGG: EHHADH | ||
| REACTOME: EHHADH | ||
| Pathway Commons: EHHADH | ||
| Context | iHOP: EHHADH | |
| ligand binding site mutation search in PubMed: EHHADH | ||
| UCL Cancer Institute: EHHADH | ||
| Assigned class in TissGDB* | C | |
| Included tissue-specific gene expression resources | TiGER,GTEx | |
| Specific-tissues in normal samples (assigned by TissGDB using HPA, TiGER, and GTEx) | KidneyLiver | |
| Cancer types related to the specific-tissues in cancer samples (assigned by TissGDB using TCGA) | KIRC,KIRP,KICHLIHC | |
| Reference showing the relevant tissue of EHHADH | ||
| Description by TissGene annotations | ||
| * Class A consists of genes with literature evidence and is part of the cTissGenes. Class B consists of only cTissGenes without additional evidence. The remaining genes belong to Class C. |
| Gene ontology having evidence of Inferred from Direct Assay (IDA) from Entrez |
| GO ID | GO term | PubMed ID | GO:0006475 | internal protein amino acid acetylation | 20167786 | GO:0006475 | internal protein amino acid acetylation | 20167786 |
| Top |
| TissGeneExp for EHHADH |
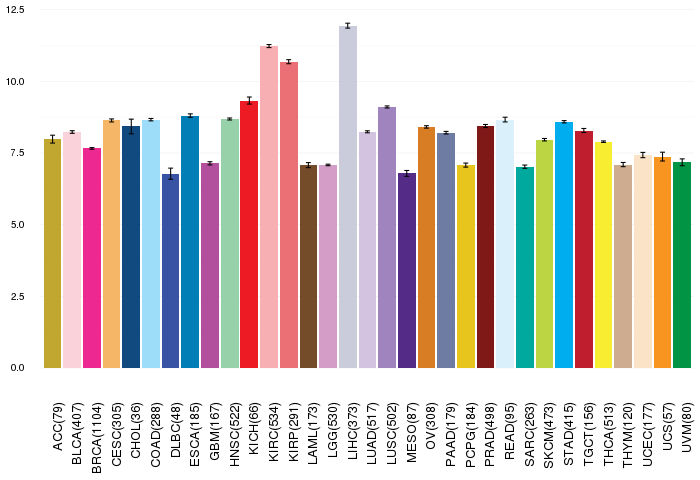
| Gene expressions across 28 cancer types (X-axis: cancer type and Y-axis: log2(norm_counts+1)) (TCGA IlluminaHiSeq_RNASeqV2, pan-cancer normalized log2(norm_counts+1) data, version 2016-08-16) |
 |
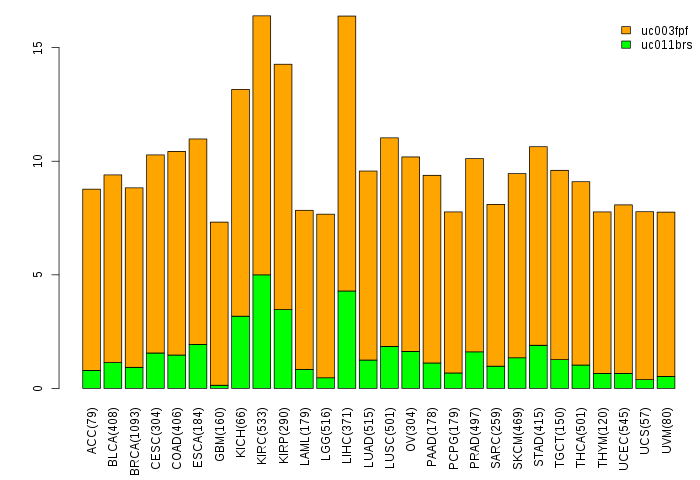
| Gene isoform expressions across 28 cancer types (X-axis: cancer type and Y-axis: log2(norm_counts+1)) (TCGA pan-cancer tcga_rsem_isoform_tpm, version 2016-09-01) |
 |
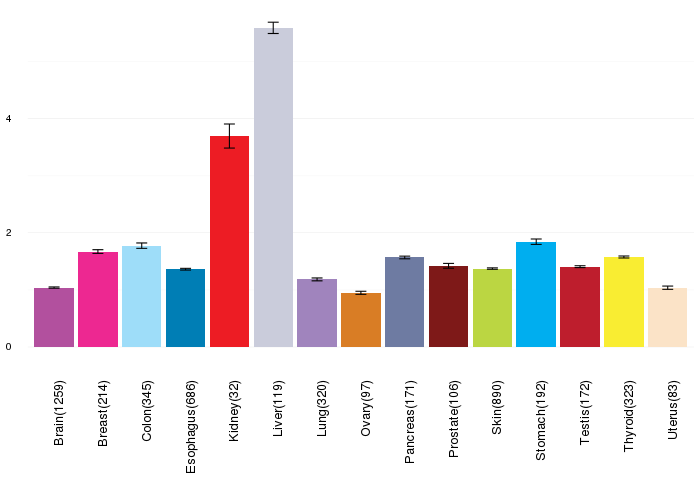
| Gene expressions across normal tissues of GTEx data (GTEx GTEx_Analysis_v6_RNA-seq_RNA-SeQCv1.1.8_gene_rpkm.gct) - Here, we shows the matched tissue types only among our 28 cancer types. |
 |
| Different expressions across 14 cancer types with more than 10 samples between matched tumors and normals (X-axis: cancer type and Y-axis: log2(norm_counts+1)) (TCGA IlluminaHiSeq_RNASeqV2, pan-cancer normalized log2(norm_counts+1) data, version 2016-08-16) |
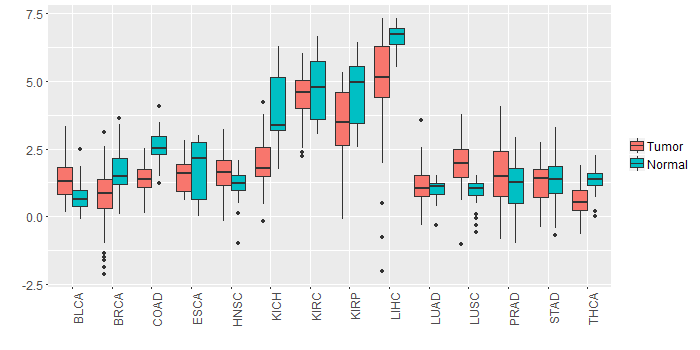 |
| - Significantly differentially expressed cancer types and information. (|Fold change|>1 and FDR<0.05) |
| Cancer type | Mean(exp) in tumor | Mean(exp) in matched normal | Log2FC | P-val. | FDR |
| KICH | 2.028788496 | 3.896232496 | -1.867444 | 1.59E-07 | 7.04E-07 |
| LUSC | 1.969463163 | 0.952533751 | 1.016929412 | 1.90E-10 | 6.95E-10 |
| LIHC | 4.987178496 | 6.593288496 | -1.60611 | 2.68E-07 | 1.65E-06 |
| COAD | 1.422011881 | 2.557877266 | -1.135865385 | 1.46E-08 | 1.25E-07 |
| KIRP | 3.510824621 | 4.696002746 | -1.185178125 | 0.000467 | 0.001384939 |
| Top |
| TissGene-miRNA for EHHADH |
| Significantly anti-correlated miRNAs of TissGene across 28 cancer types (Gene-miRNA relations from TargetScanHuman Relsease 7.1, Conserved_Site_Context_Scores.txt.zip, 06.01.2016) (TCGA IlluminaHiSeq_miRNASeq, log2(RPM+1) data, version 2016-11-21) (TCGA IlluminaHiSeq_RNASeqV2, log2(normalized_count+1) data, version 2016-08-16) (Spearman’s Rank Correlation (p-value<0.05 and coefficient<-0.25)) |
| Cancer type | miRNA id | miRNA accession | P-val. | Coeff. | # samples |
| Top |
| TissGeneMut for EHHADH |
| TissGeneSNV for EHHADH |
| nsSNV counts per each loci. Different colors of circles represent different cancer types. Circle size denotes number of samples. (TCGA somatic mutation (SNPs and small INDELs) data, version 2016-04-25) * Click on the image to enlarge it in a new window. |
 |
 |
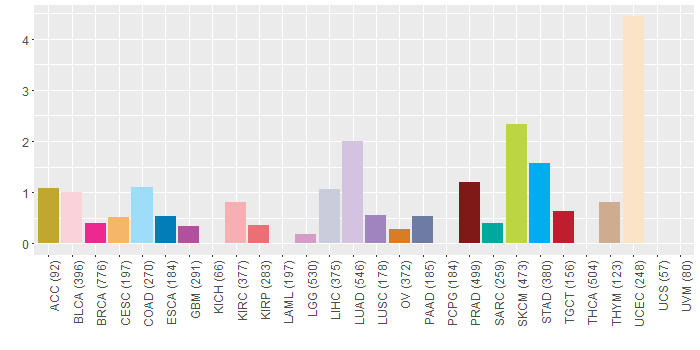
| Somatic nucleotide variants of TissGene across 28 cancer types (X-axis: cancer type and Y-axis: % of mutated samples) The numbers in parentheses are numbers of samples with mutation (nsSNVs). (TCGA somatic mutation (SNPs and small INDELs) data, version 2016-04-25) |
 |
| - nsSNVs sorted by frequency. |
| AAchange | Cancer type | # samples |
| p.P188S | SKCM | 2 |
| p.P284S | SKCM | 2 |
| p.R64C | SKCM | 2 |
| p.R570L | LUAD | 2 |
| p.G705A | ESCA | 1 |
| p.L396R | LIHC | 1 |
| p.T283A | DLBC | 1 |
| p.E677D | UCEC | 1 |
| p.S720R | OV | 1 |
| p.R551* | GBM | 1 |
| p.G636E | SKCM | 1 |
| p.K464T | UCEC | 1 |
| p.S349F | SKCM | 1 |
| p.P549S | SKCM | 1 |
| p.R424H | PRAD | 1 |
| p.H438D | LUAD | 1 |
| p.P560T | SKCM | 1 |
| p.A20T | COAD | 1 |
| p.H426Y | LIHC | 1 |
| p.H608D | LUAD | 1 |
| p.V675A | BRCA | 1 |
| p.S367L | LIHC | 1 |
| p.R196H | UCEC | 1 |
| p.E567* | UCEC | 1 |
| p.F398L | COAD | 1 |
| p.K574N | ACC | 1 |
| p.R602W | PRAD | 1 |
| p.I152V | LIHC | 1 |
| p.Y450* | LGG | 1 |
| p.D150N | KIRC | 1 |
| p.G474C | UCEC | 1 |
| p.A144V | COAD | 1 |
| p.I168V | STAD | 1 |
| p.E644K | SKCM | 1 |
| p.F433L | SARC | 1 |
| p.S533F | HNSC | 1 |
| p.L169I | UCEC | 1 |
| p.L698V | LIHC | 1 |
| p.Q704H | LUAD | 1 |
| p.L159V | PRAD | 1 |
| p.P123A | HNSC | 1 |
| p.E252D | PRAD | 1 |
| p.R266T | BLCA | 1 |
| p.P284L | SKCM | 1 |
| p.P464T | SKCM | 1 |
| p.Q223K | UCEC | 1 |
| p.L715S | DLBC | 1 |
| p.R85I | STAD | 1 |
| p.R557M | LUAD | 1 |
| p.N86K | MESO | 1 |
| p.T75A | KIRC | 1 |
| p.A278T | UCEC | 1 |
| p.R318S | LUAD | 1 |
| p.L620I | LIHC | 1 |
| p.K56T | UCEC | 1 |
| p.Q581K | LIHC | 1 |
| p.Q704H | PRAD | 1 |
| p.I182T | UCEC | 1 |
| p.T26A | STAD | 1 |
| p.P708L | HNSC | 1 |
| p.G540E | SKCM | 1 |
| p.R604T | BLCA | 1 |
| p.S718F | SKCM | 1 |
| p.T431S | LUAD | 1 |
| p.K478N | ACC | 1 |
| p.Q223K | THYM | 1 |
| p.T136A | KIRP | 1 |
| p.S626X | LIHC | 1 |
| p.G286R | STAD | 1 |
| p.N337K | LIHC | 1 |
| p.S219Y | READ | 1 |
| p.P425S | LIHC | 1 |
| p.S601L | PRAD | 1 |
| p.P708S | HNSC | 1 |
| p.H590Y | BRCA | 1 |
| p.Y603H | STAD | 1 |
| p.L64P | UCEC | 1 |
| p.Q449H | LUSC | 1 |
| p.R570* | PAAD | 1 |
| p.E548K | SKCM | 1 |
| p.R156S | LUAD | 1 |
| p.S718F | STAD | 1 |
| p.S154L | LUAD | 1 |
| p.E254K | BLCA | 1 |
| p.V378L | BRCA | 1 |
| p.E630K | BLCA | 1 |
| p.N18T | TGCT | 1 |
| p.A292T | KIRC | 1 |
| p.Q186* | CESC | 1 |
| p.R622C | LUAD | 1 |
| p.G671V | LUAD | 1 |
| p.S622F | SKCM | 1 |
| p.S299* | PRAD | 1 |
| p.S451F | LIHC | 1 |
| Top |
| TissGeneCNV for EHHADH |
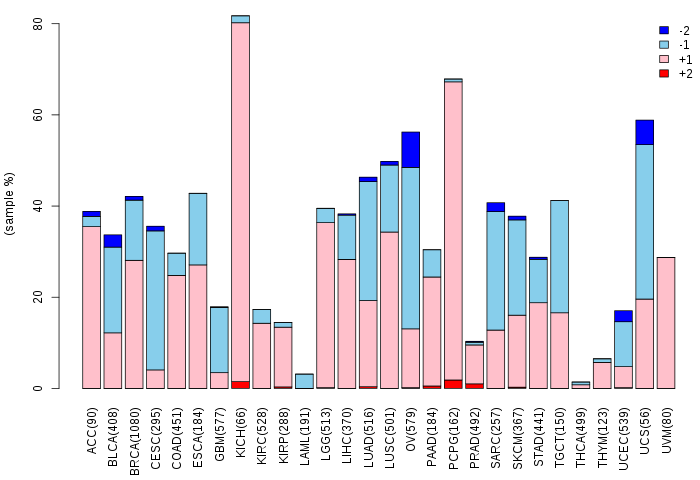
| Copy number variations of TissGene across 28 cancer types (X-axis: cancer type and Y-axis: % of CNV samples) (TCGA Gistic2_CopyNumber_Gistic2_all_data_by_genes, Gistic2 copy number data, version 2016-08-16) |
 |
| Top |
| TissGeneFusions for EHHADH |
| Fusion genes including TissGene (ChimerDB 3.0, 2016-12-01 and TCGA fusion Portal 2015-12-01) |
| Database | Src | Cancer type | Sample | Fusion gene | ORF | 5'-gene BP | 3'-gene BP |
| TCGAfusionPortal | PRADA | BRCA | TCGA-D8-A27N-01A | EHHADH-ABCC5 | In-frame | Chr3:184922204 | Chr3:183696439 |
| Top |
| TissGeneNet for EHHADH |
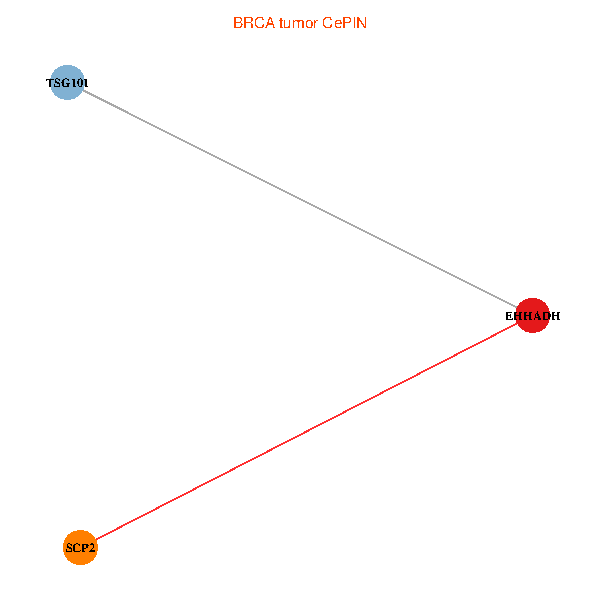
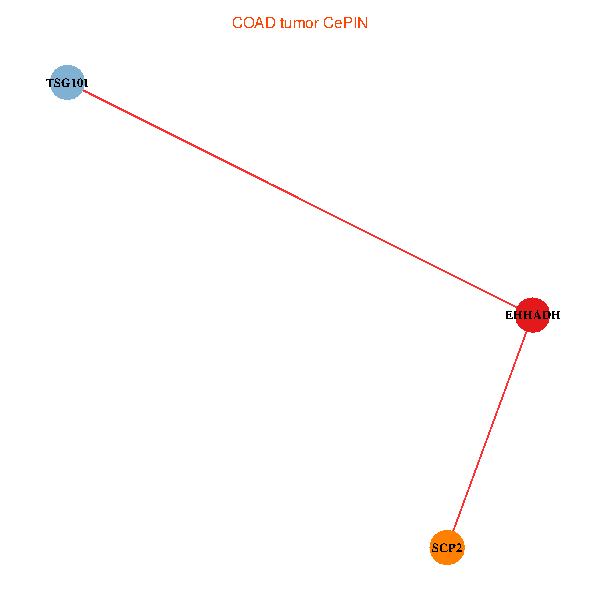
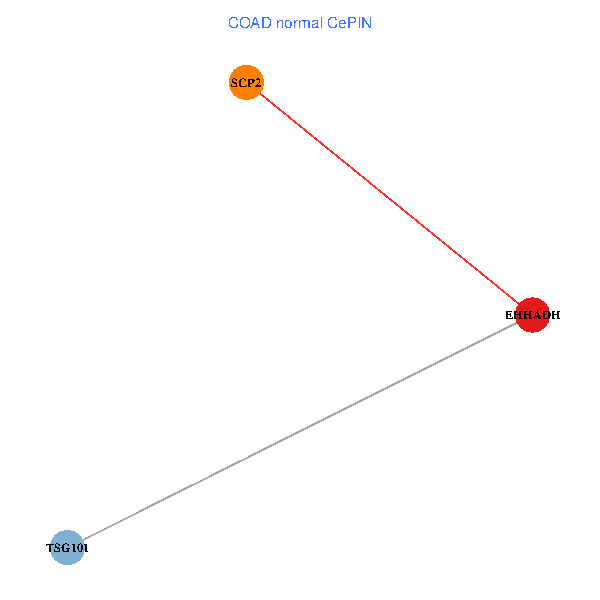
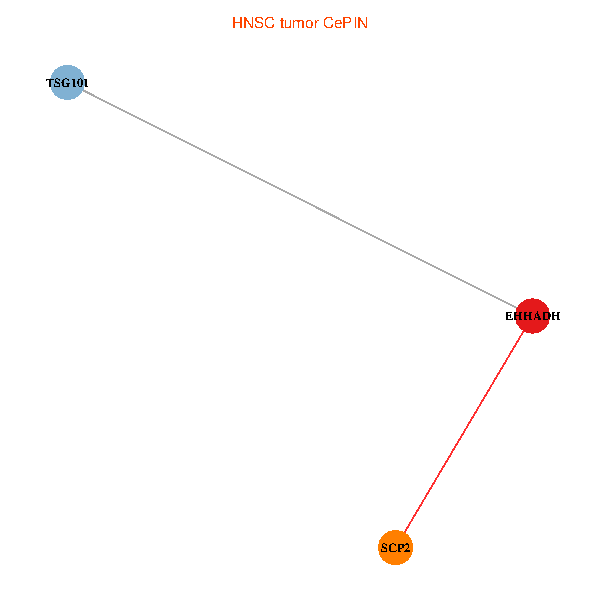
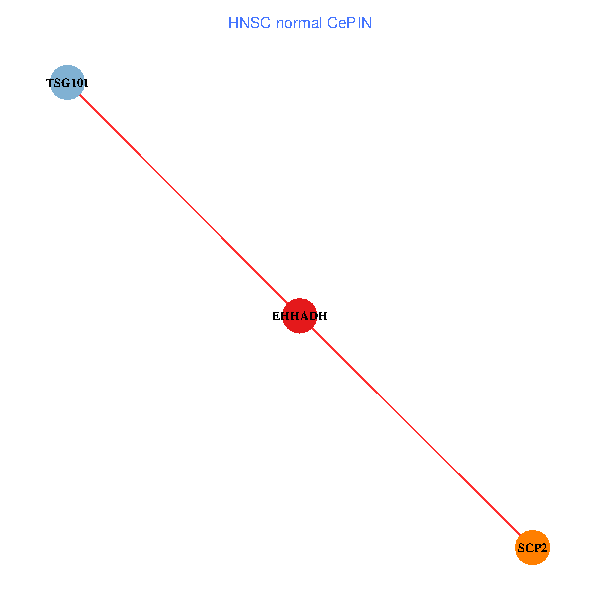
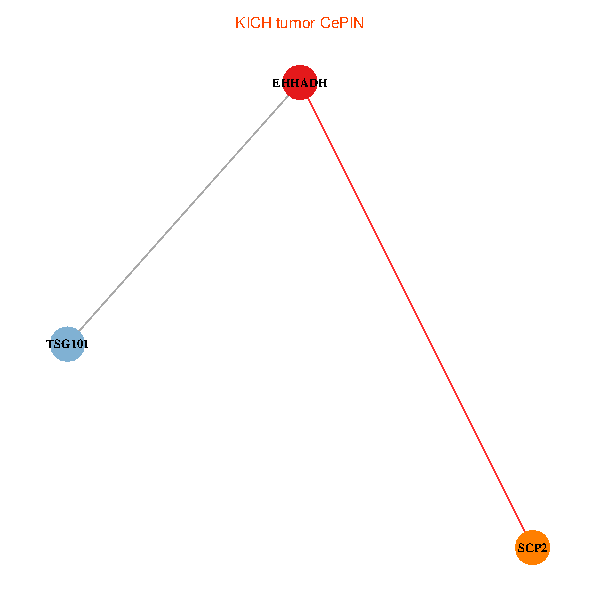
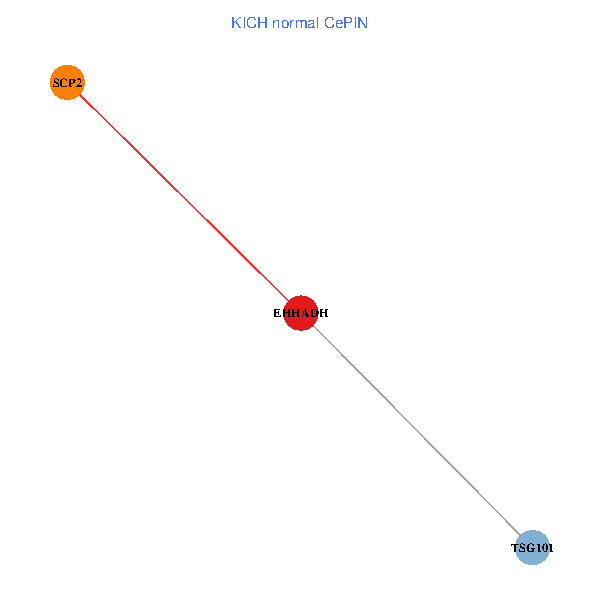
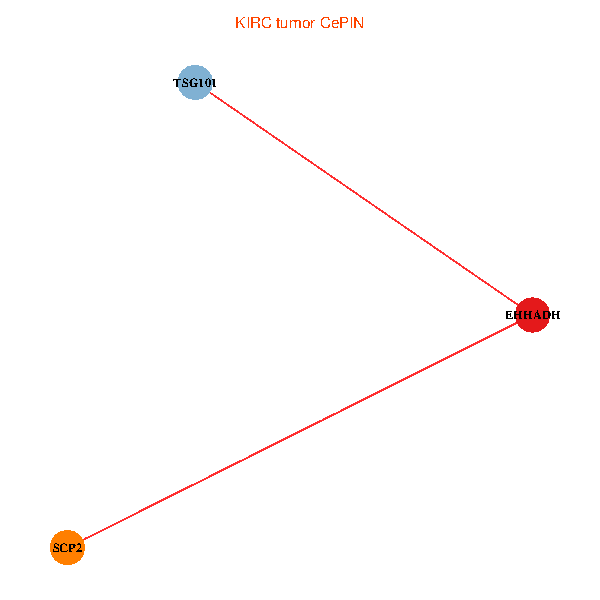
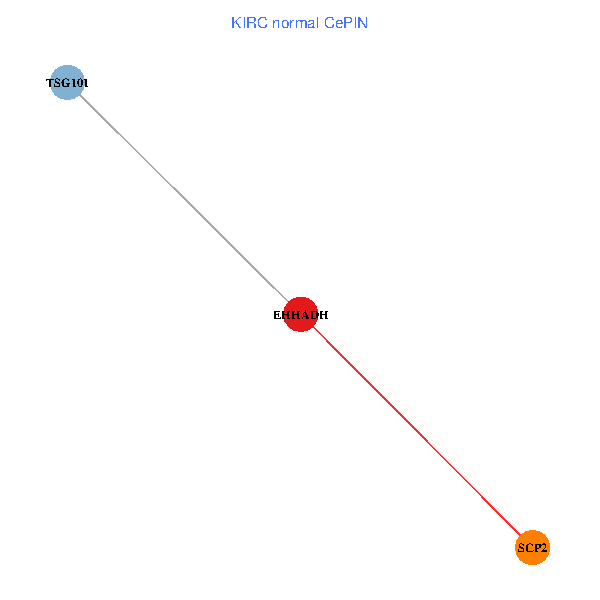
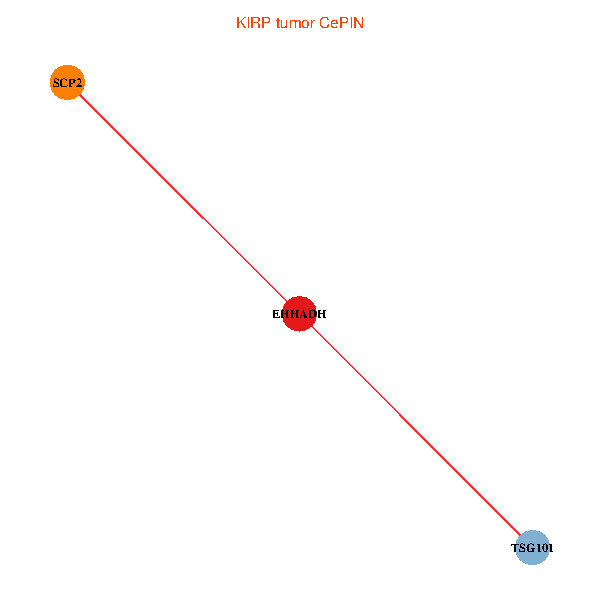
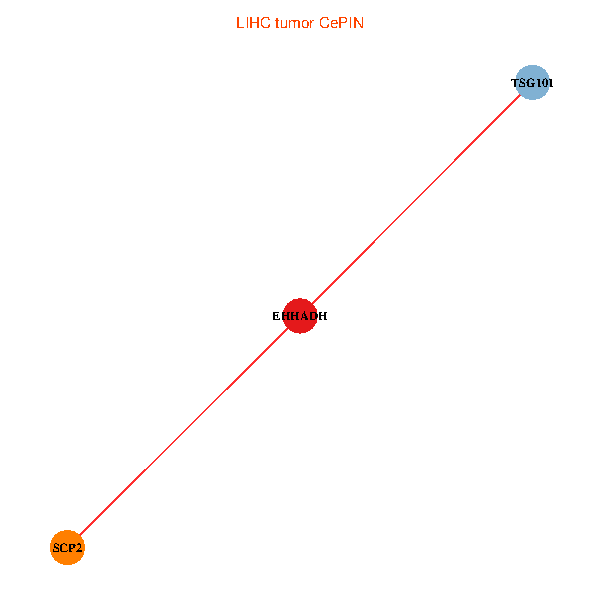
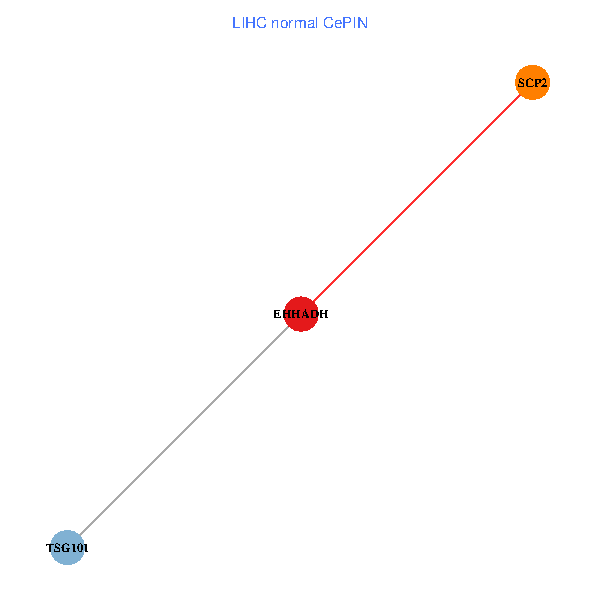
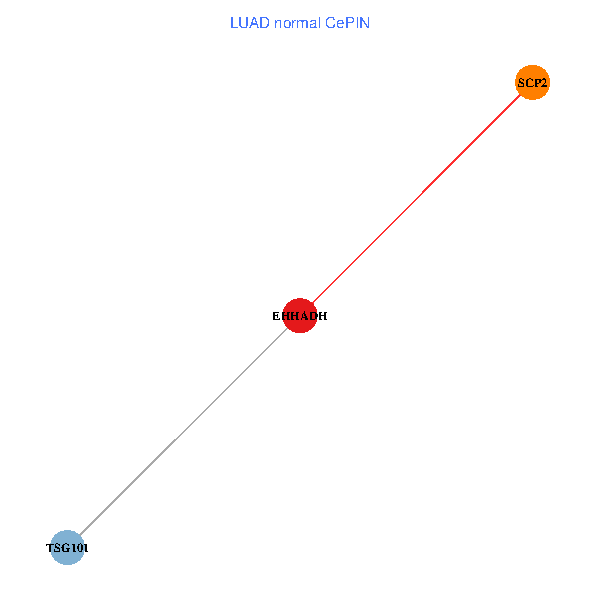
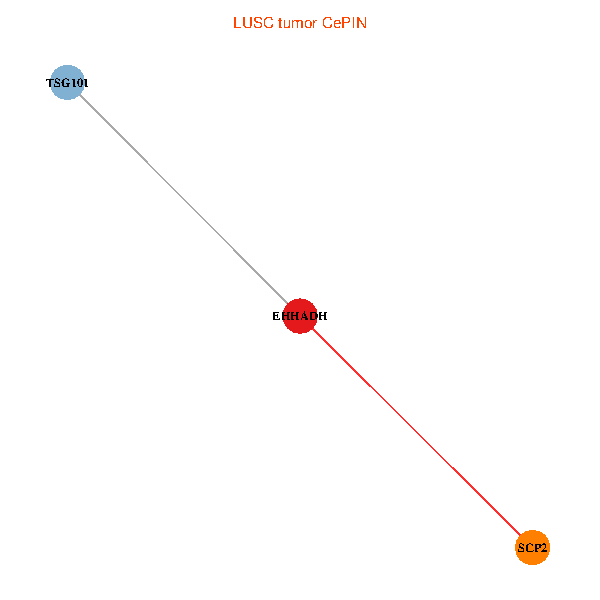
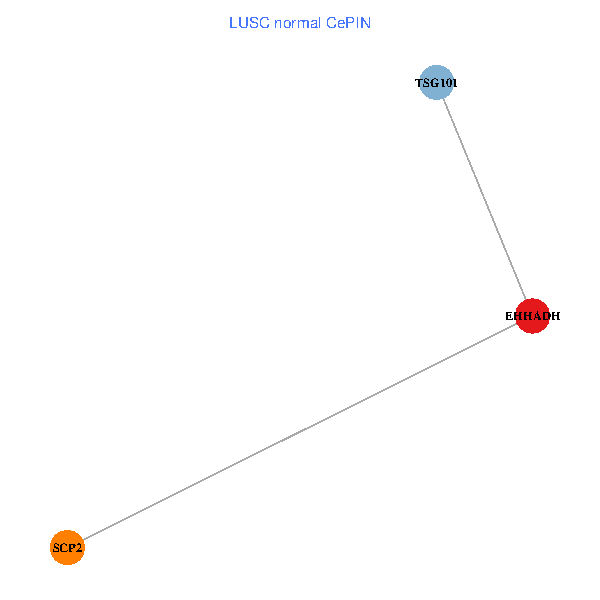
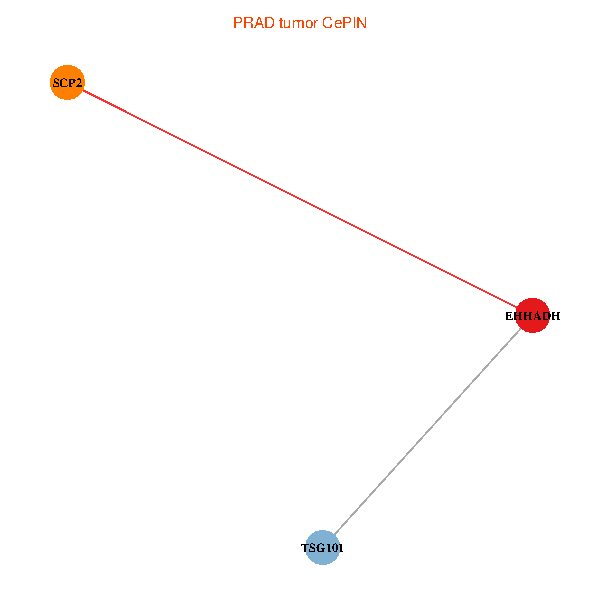
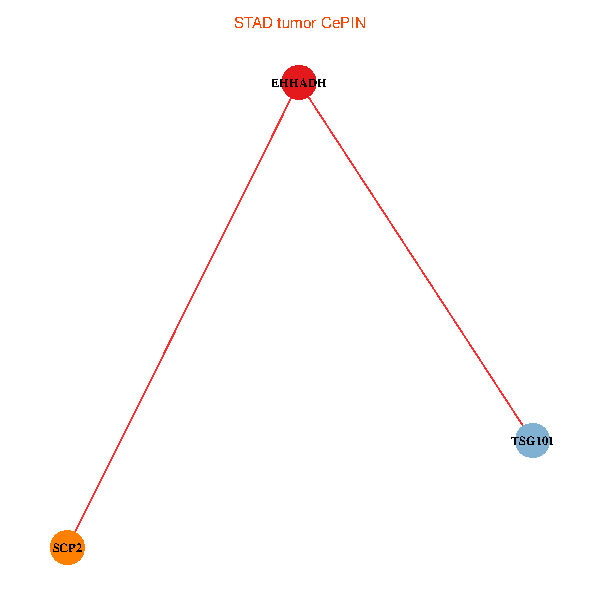
| Co-expressed gene networks based on protein-protein interaction data (CePIN) (TCGA IlluminaHiSeq_RNASeqV2, pan-cancer normalized log2(norm_counts+1) data, version 2016-08-16) (PINA2 ppi data) |
| BRCA (tumor) | BRCA (normal) |
| EHHADH, TSG101, SCP2 (tumor) | EHHADH, TSG101, SCP2 (normal) |
 |  |
| COAD (tumor) | COAD (normal) |
| EHHADH, TSG101, SCP2 (tumor) | EHHADH, TSG101, SCP2 (normal) |
 |  |
| HNSC (tumor) | HNSC (normal) |
| EHHADH, TSG101, SCP2 (tumor) | EHHADH, TSG101, SCP2 (normal) |
 |  |
| KICH (tumor) | KICH (normal) |
| EHHADH, TSG101, SCP2 (tumor) | EHHADH, TSG101, SCP2 (normal) |
 |  |
| KIRC (tumor) | KIRC (normal) |
| EHHADH, TSG101, SCP2 (tumor) | EHHADH, TSG101, SCP2 (normal) |
 |  |
| KIRP (tumor) | KIRP (normal) |
| EHHADH, TSG101, SCP2 (tumor) | EHHADH, TSG101, SCP2 (normal) |
 |  |
| LIHC (tumor) | LIHC (normal) |
| EHHADH, TSG101, SCP2 (tumor) | EHHADH, TSG101, SCP2 (normal) |
 |  |
| LUAD (tumor) | LUAD (normal) |
| EHHADH, TSG101, SCP2 (tumor) | EHHADH, TSG101, SCP2 (normal) |
 |  |
| LUSC (tumor) | LUSC (normal) |
| EHHADH, TSG101, SCP2 (tumor) | EHHADH, TSG101, SCP2 (normal) |
 |  |
| PRAD (tumor) | PRAD (normal) |
| EHHADH, TSG101, SCP2 (tumor) | EHHADH, TSG101, SCP2 (normal) |
 |  |
| STAD (tumor) | STAD (normal) |
| EHHADH, TSG101, SCP2 (tumor) | EHHADH, TSG101, SCP2 (normal) |
 |  |
| THCA (tumor) | THCA (normal) |
| EHHADH, TSG101, SCP2 (tumor) | EHHADH, TSG101, SCP2 (normal) |
 |  |
| Top |
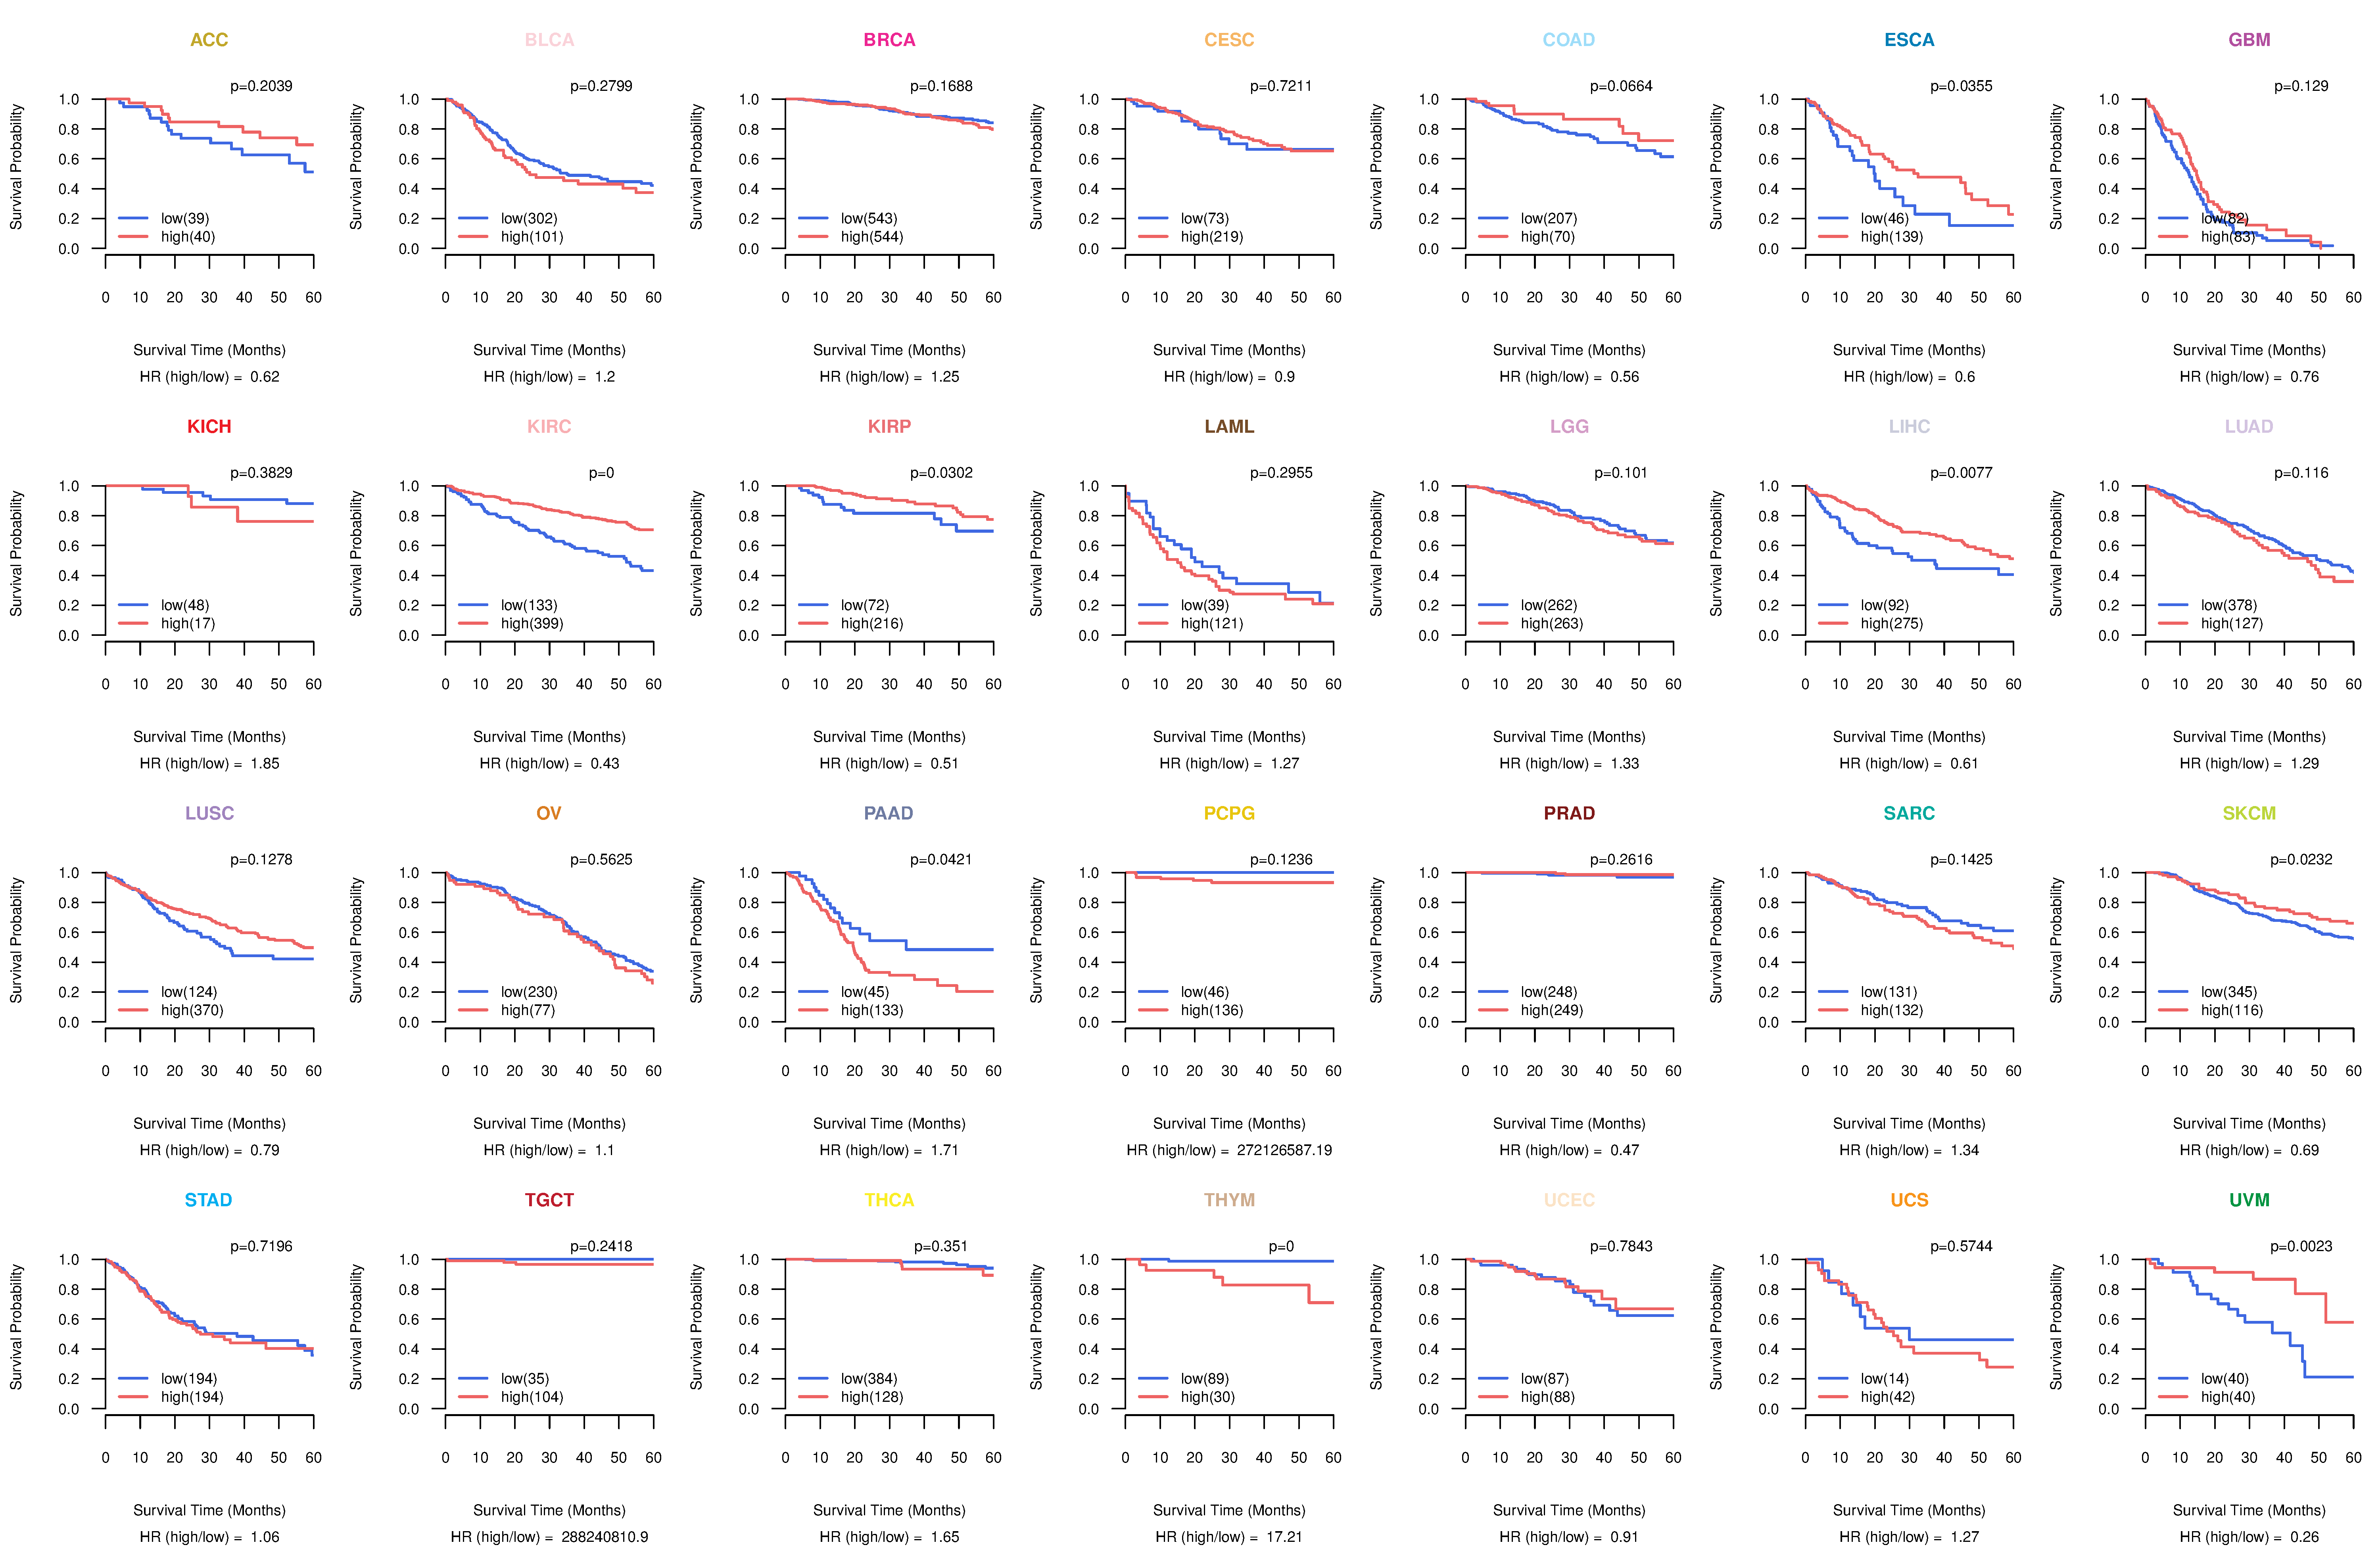
| TissGeneProg for EHHADH |
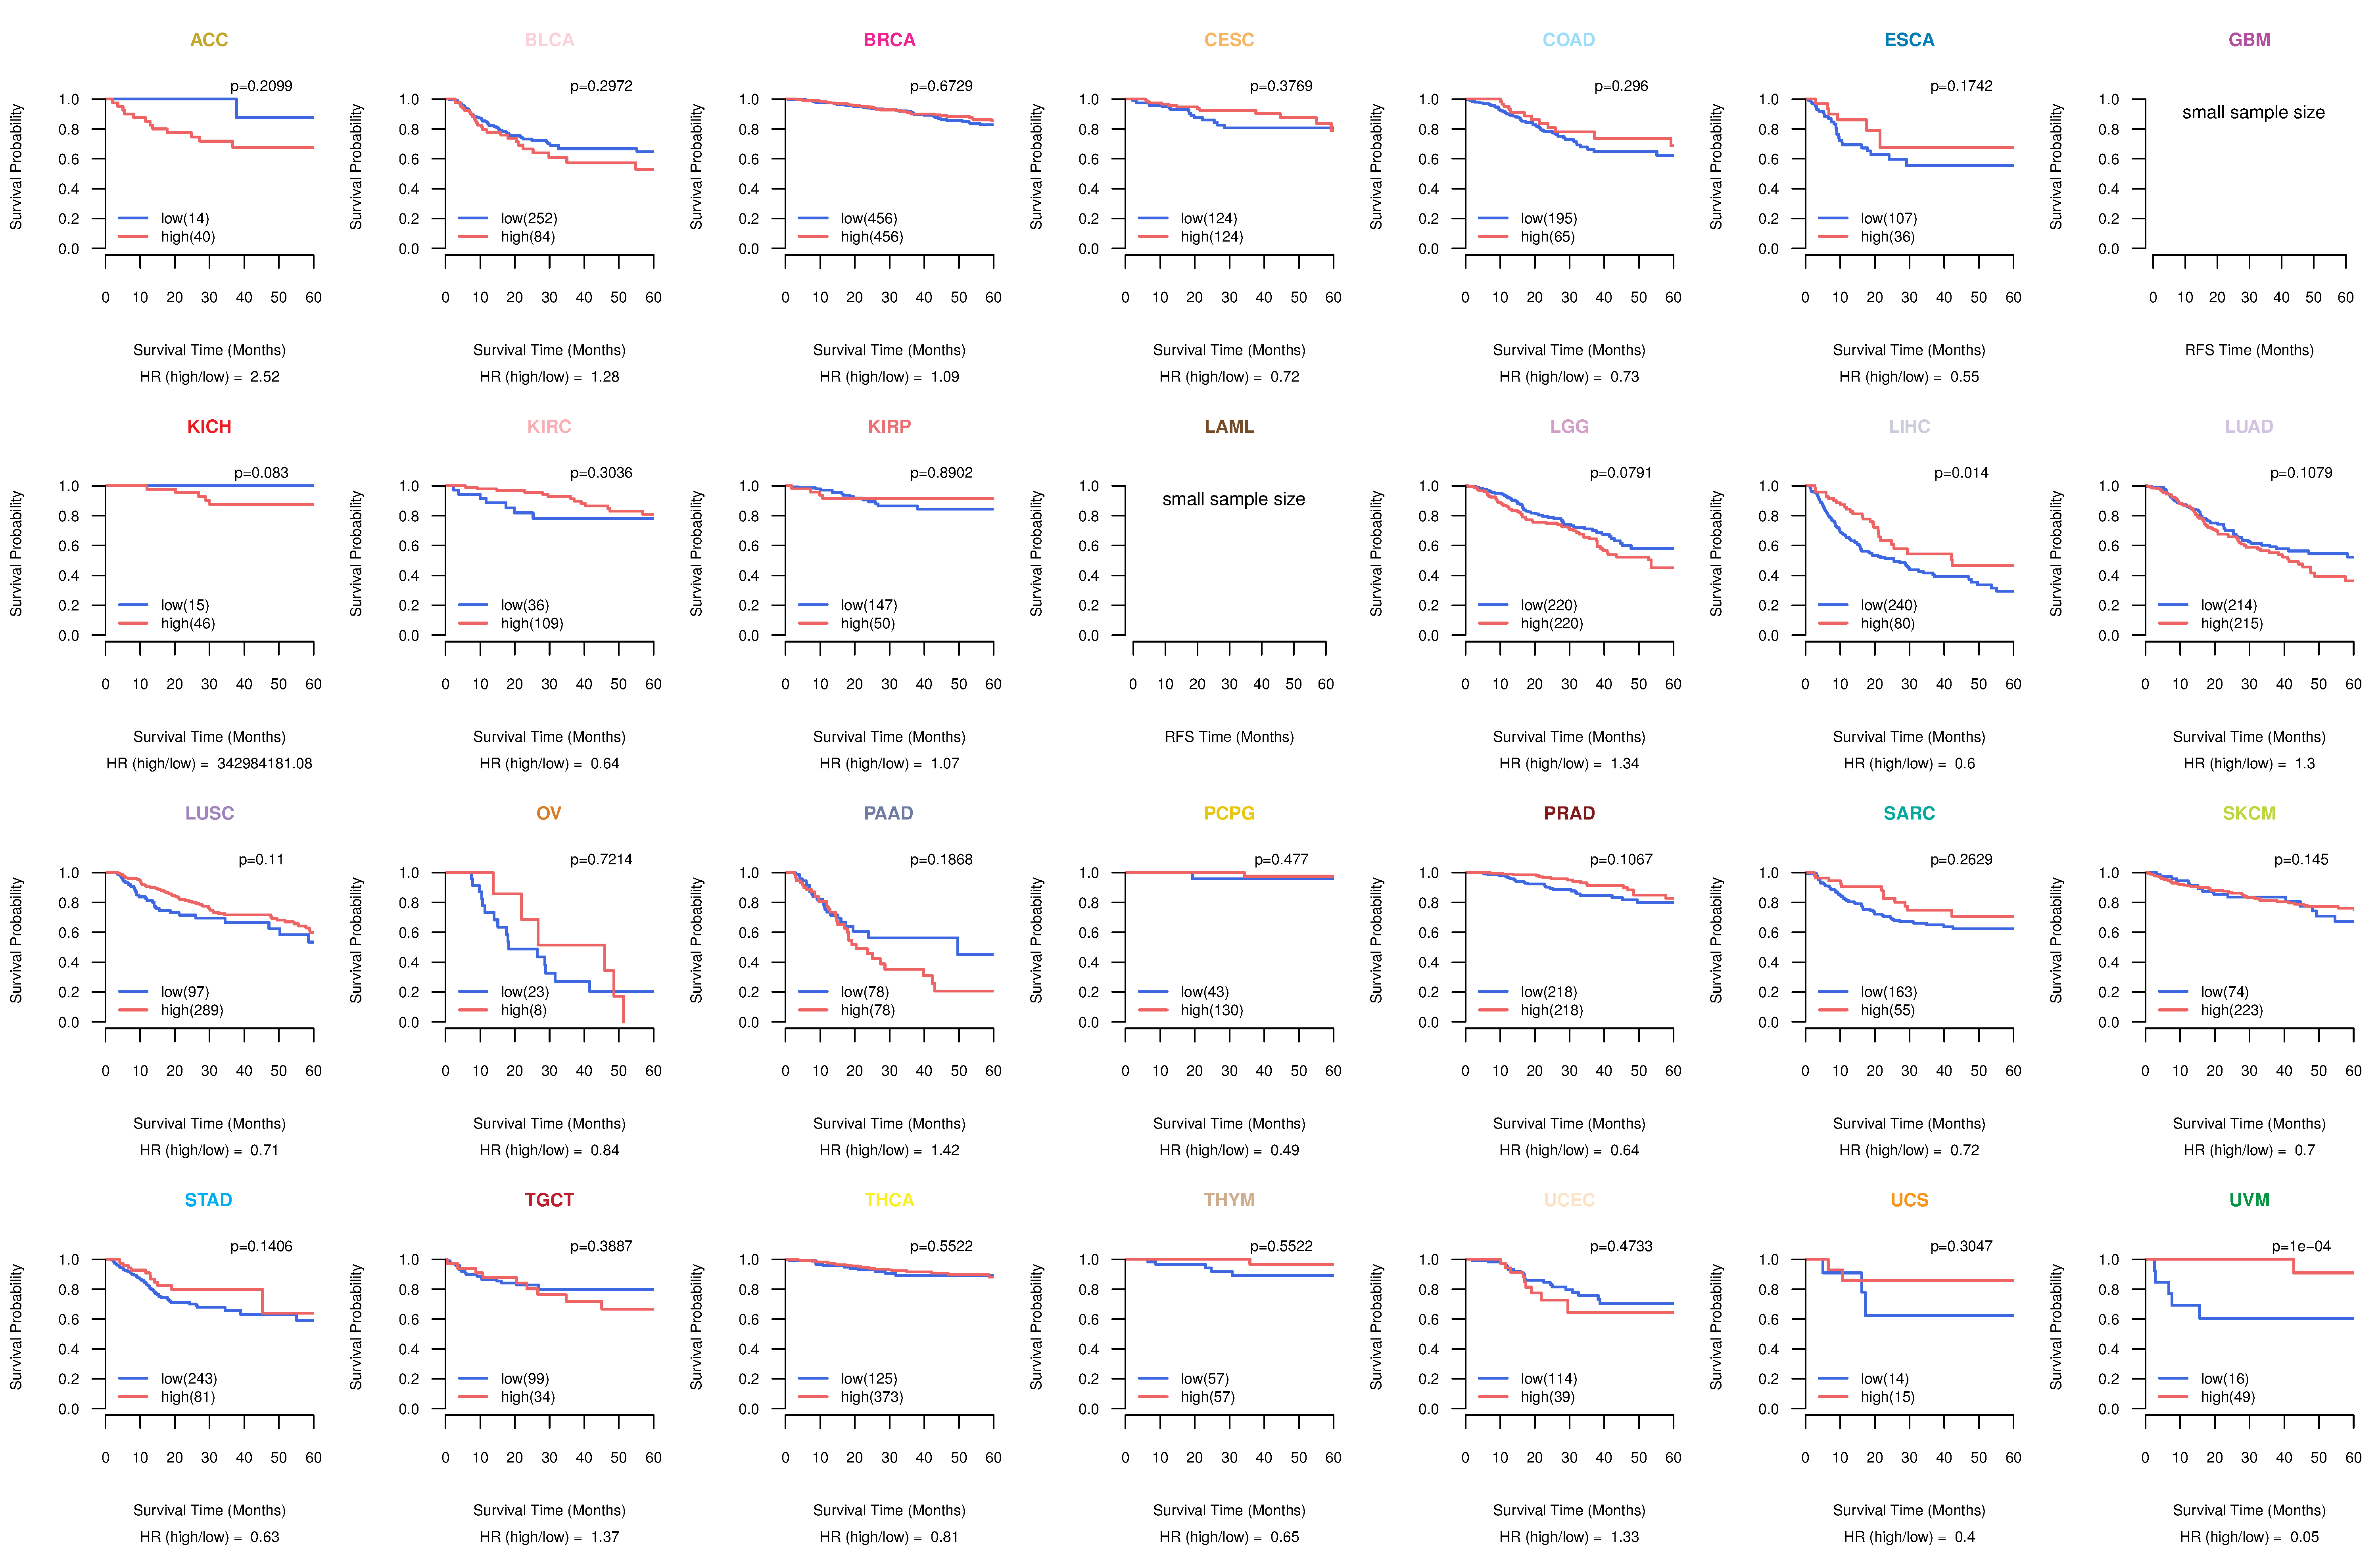
| Kaplan-Meier plots with logrank tests of overall survival (OS) using 28 cancer types (TCGA IlluminaHiSeq_RNASeqV2, pan-cancer normalized log2(norm_counts+1) data, version 2016-08-16) (TCGA clinicalMatrix, phenotype data, version 2016-04-27) * Click on the image to enlarge it in a new window. |
 |
| Kaplan-Meier plots with logrank test of relapse free survival (RFS) using 28 cancer types (TCGA IlluminaHiSeq_RNASeqV2, pan-cancer normalized log2(norm_counts+1) data, version 2016-08-16) (TCGA clinicalMatrix, phenotype data, version 2016-04-27) * Click on the image enlarge it in a new window. |
 |
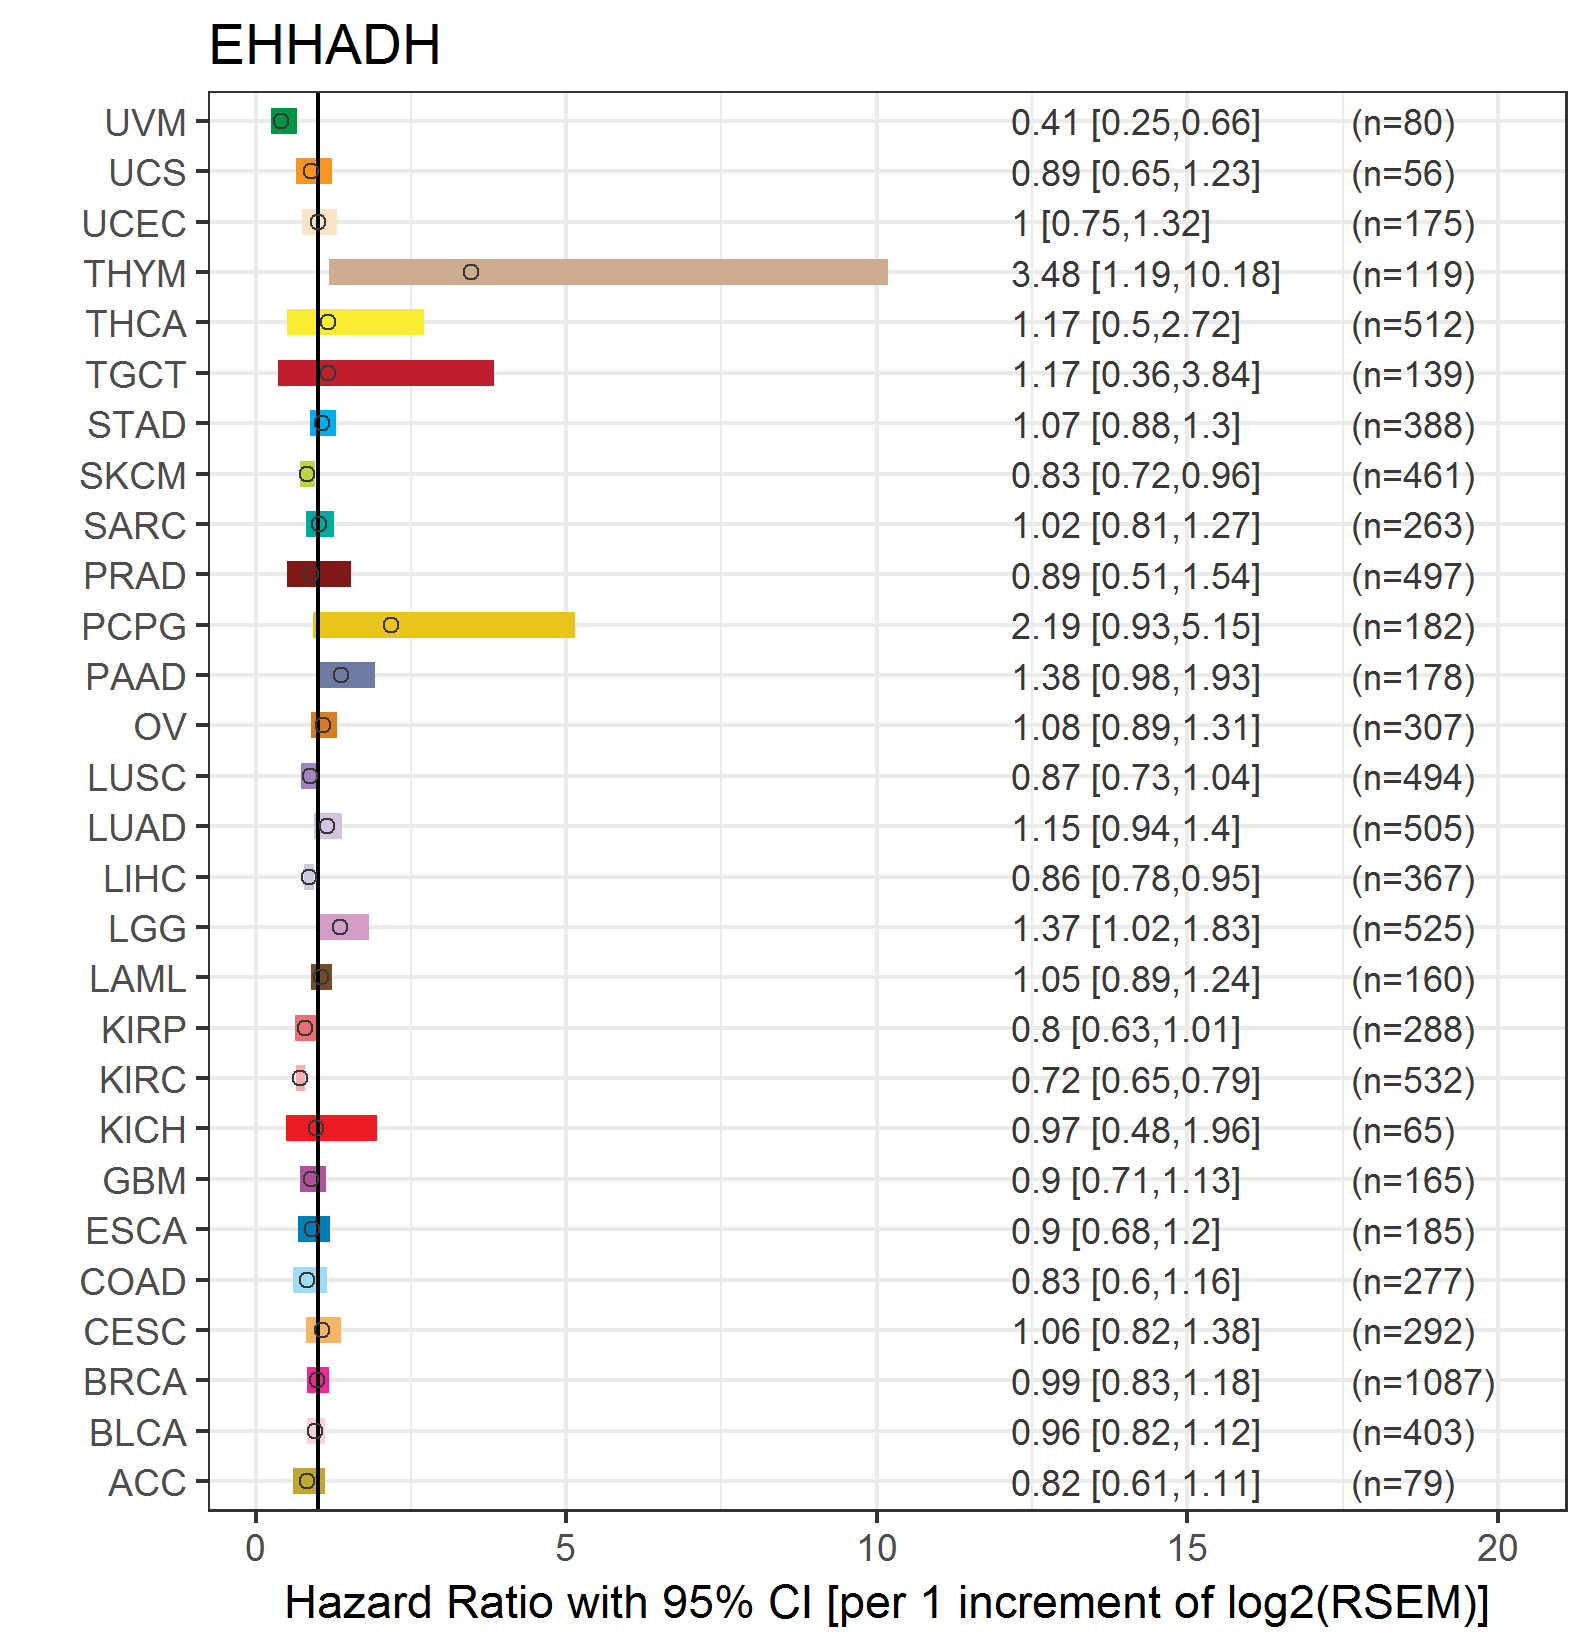
| Forest plot of Cox proportional hazard ratio (HR) and 95% CI of overall survival (OS) using 28 cancer types (TCGA IlluminaHiSeq_RNASeqV2, pan-cancer normalized log2(norm_counts+1) data, version 2016-08-16) (TCGA clinicalMatrix, phenotype data, version 2016-04-27) * Click on the image enlarge it in a new window. |
 |
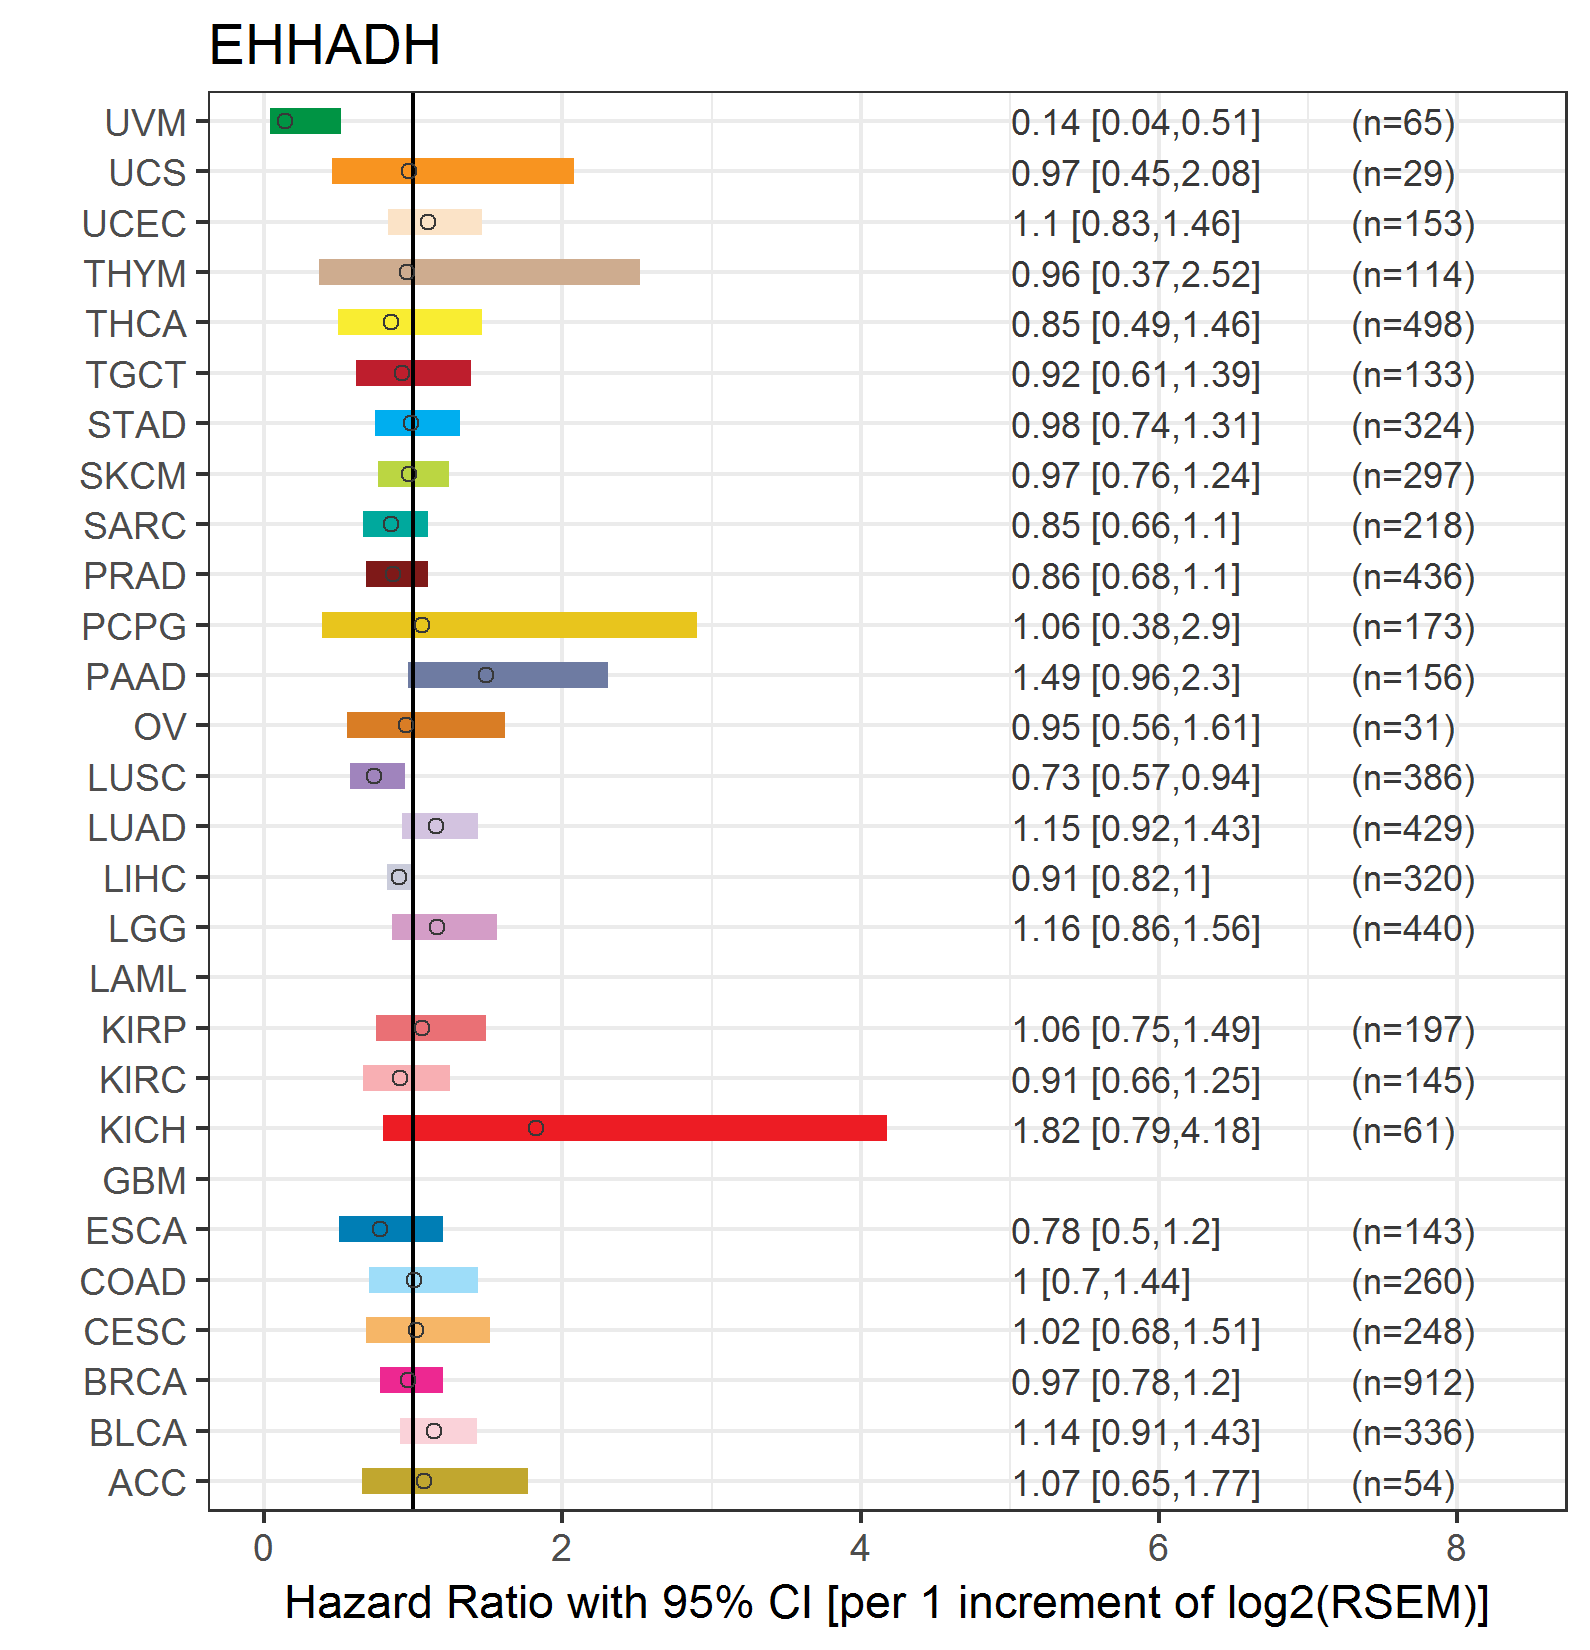
| Forest plot of Cox proportional hazard ratio (HR) and 95% CI of relapse free survival (RFS) using 28 cancer types (TCGA IlluminaHiSeq_RNASeqV2, pan-cancer normalized log2(norm_counts+1) data, version 2016-08-16) (TCGA clinicalMatrix, phenotype data, version 2016-04-27) * Click on the image enlarge it in a new window. |
 |
| Top |
| TissGeneClin for EHHADH |
| TissGeneDrug for EHHADH |
| Drug information targeting TissGene (DrugBank Version 5.0.6, 2017-04-01) |
| DrugBank ID | Drug name | Drug activity | Drug type | Drug status |
| Top |
| TissGeneDisease for EHHADH |
| Disease information associated with TissGene (DisGeNet, 2016-06-01) |
| Disease ID | Disease name | # pubmeds | Source |
| umls:C0020459 | Hyperinsulinism | 2 | BeFree |
| umls:C0699790 | Colon Carcinoma | 2 | BeFree |
| umls:C1969443 | Trifunctional Protein Deficiency With Myopathy And Neuropathy | 2 | BeFree |
| umls:C2239176 | Liver carcinoma | 2 | BeFree |
| umls:C0002395 | Alzheimer's Disease | 1 | BeFree |
| umls:C0005586 | Bipolar Disorder | 1 | BeFree |
| umls:C0009375 | Colonic Neoplasms | 1 | BeFree |
| umls:C0019209 | Hepatomegaly | 1 | LHGDN |
| umls:C0023895 | Liver diseases | 1 | BeFree |
| umls:C0025289 | Meningitis | 1 | BeFree |
| umls:C0033626 | Protein Deficiency | 1 | BeFree |
| umls:C0036690 | Septicemia | 1 | BeFree |
| umls:C0162309 | Adrenoleukodystrophy | 1 | BeFree |
| umls:C0236969 | Substance-Related Disorders | 1 | CTD_human |
| umls:C0243026 | Sepsis | 1 | BeFree |
| umls:C0342953 | Organ dysfunction syndrome | 1 | BeFree |
| umls:C0853193 | Bipolar I disorder | 1 | BeFree |
| umls:C1719672 | Severe Sepsis | 1 | BeFree |
| umls:C2750798 | Polymicrogyria With Optic Nerve Hypoplasia | 1 | BeFree |
| umls:C3810100 | FANCONI RENOTUBULAR SYNDROME 3 | 1 | CLINVAR,UNIPROT |
| umls:C0342870 | Bifunctional peroxisomal enzyme deficiency | 0 | ORPHANET |
|
Copyright 2016-Present - The University of Texas Health Science Center at Houston (UTHealth) Web File Viewing | How to Report, Fraud, Waste and Abuse | State of Texas | Statewide Search | Texas Homeland Security | Site Policies |