 |
| |
| |
| |
| |
| |
| |
|

| TissGeneSummary for EMX1 |
 Gene summary Gene summary |
| Basic gene information | Gene symbol | EMX1 |
| Gene name | empty spiracles homeobox 1 | |
| Synonyms | - | |
| Cytomap | UCSC genome browser: 2p13.2 | |
| Type of gene | protein-coding | |
| RefGenes | NM_001040404.1, NM_004097.2, | |
| Description | empty spiracles homolog 1empty spiracles-like protein 1homeobox protein EMX1 | |
| Modification date | 20141207 | |
| dbXrefs | MIM : 600034 | |
| HGNC : HGNC | ||
| Ensembl : ENSG00000135638 | ||
| HPRD : 08963 | ||
| Vega : OTTHUMG00000129778 | ||
| Protein | UniProt: go to UniProt's Cross Reference DB Table | |
| Expression | CleanEX: HS_EMX1 | |
| BioGPS: 2016 | ||
| Pathway | NCI Pathway Interaction Database: EMX1 | |
| KEGG: EMX1 | ||
| REACTOME: EMX1 | ||
| Pathway Commons: EMX1 | ||
| Context | iHOP: EMX1 | |
| ligand binding site mutation search in PubMed: EMX1 | ||
| UCL Cancer Institute: EMX1 | ||
| Assigned class in TissGDB* | C | |
| Included tissue-specific gene expression resources | TiGER,GTEx | |
| Specific-tissues in normal samples (assigned by TissGDB using HPA, TiGER, and GTEx) | Kidney | |
| Cancer types related to the specific-tissues in cancer samples (assigned by TissGDB using TCGA) | KIRC,KIRP,KICH | |
| Reference showing the relevant tissue of EMX1 | ||
| Description by TissGene annotations | Protective TissGene in OS | |
| * Class A consists of genes with literature evidence and is part of the cTissGenes. Class B consists of only cTissGenes without additional evidence. The remaining genes belong to Class C. |
| Gene ontology having evidence of Inferred from Direct Assay (IDA) from Entrez |
| GO ID | GO term | PubMed ID |
| Top |
| TissGeneExp for EMX1 |
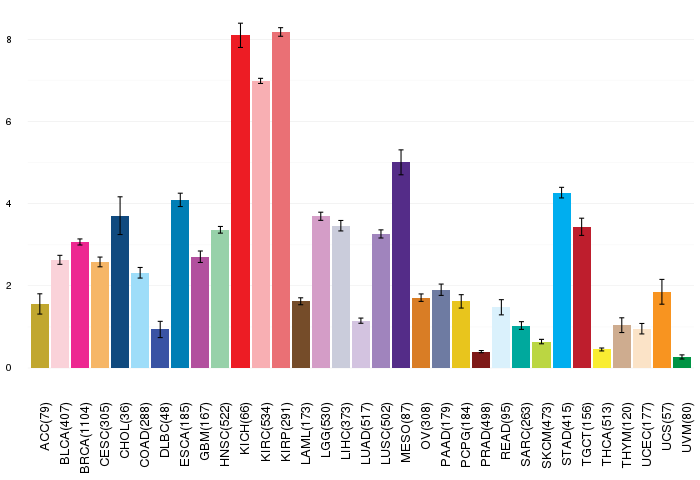
| Gene expressions across 28 cancer types (X-axis: cancer type and Y-axis: log2(norm_counts+1)) (TCGA IlluminaHiSeq_RNASeqV2, pan-cancer normalized log2(norm_counts+1) data, version 2016-08-16) |
 |
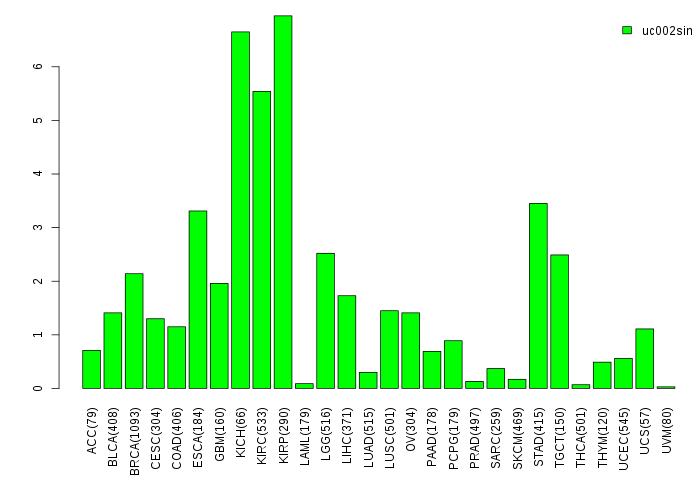
| Gene isoform expressions across 28 cancer types (X-axis: cancer type and Y-axis: log2(norm_counts+1)) (TCGA pan-cancer tcga_rsem_isoform_tpm, version 2016-09-01) |
 |
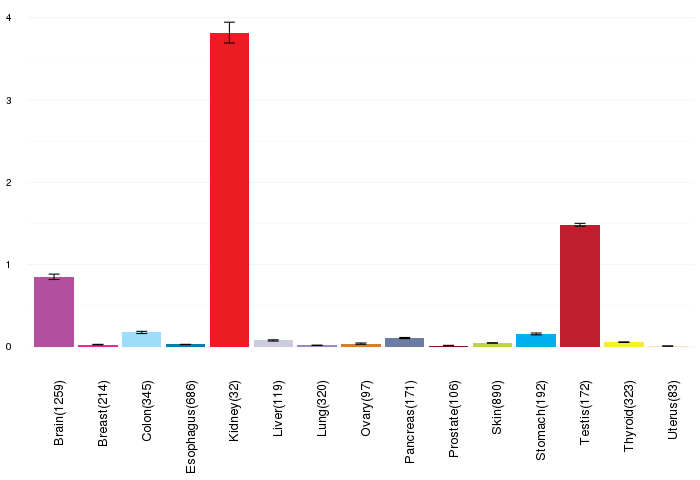
| Gene expressions across normal tissues of GTEx data (GTEx GTEx_Analysis_v6_RNA-seq_RNA-SeQCv1.1.8_gene_rpkm.gct) - Here, we shows the matched tissue types only among our 28 cancer types. |
 |
| Different expressions across 14 cancer types with more than 10 samples between matched tumors and normals (X-axis: cancer type and Y-axis: log2(norm_counts+1)) (TCGA IlluminaHiSeq_RNASeqV2, pan-cancer normalized log2(norm_counts+1) data, version 2016-08-16) |
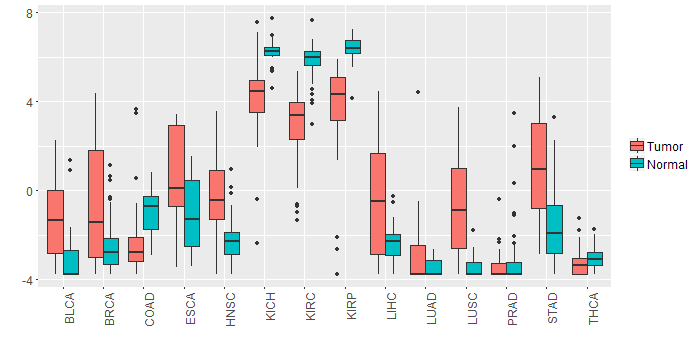 |
| - Significantly differentially expressed cancer types and information. (|Fold change|>1 and FDR<0.05) |
| Cancer type | Mean(exp) in tumor | Mean(exp) in matched normal | Log2FC | P-val. | FDR |
| HNSC | -0.353539617 | -2.248018687 | 1.89447907 | 9.60E-08 | 9.47E-07 |
| KIRC | 3.076796946 | 5.856262224 | -2.779465278 | 5.14E-27 | 7.43E-26 |
| LUSC | -0.617251747 | -3.447096845 | 2.829845098 | 8.31E-12 | 3.50E-11 |
| BRCA | -0.630232294 | -2.576777908 | 1.946545614 | 6.45E-12 | 2.75E-11 |
| STAD | 1.311439307 | -1.475270068 | 2.786709375 | 1.65E-06 | 2.51E-05 |
| LIHC | -0.497337943 | -2.435125943 | 1.937788 | 4.58E-06 | 2.11E-05 |
| KIRP | 3.599423682 | 6.427829932 | -2.82840625 | 1.95E-07 | 1.14E-06 |
| BLCA | -1.311531417 | -2.834084048 | 1.522552632 | 0.00694 | 0.034019868 |
| COAD | -2.12066502 | -0.996391943 | -1.124273077 | 0.0143 | 0.030155245 |
| KICH | 4.175630057 | 6.246766057 | -2.071136 | 0.000141 | 0.0003572 |
| Top |
| TissGene-miRNA for EMX1 |
| Significantly anti-correlated miRNAs of TissGene across 28 cancer types (Gene-miRNA relations from TargetScanHuman Relsease 7.1, Conserved_Site_Context_Scores.txt.zip, 06.01.2016) (TCGA IlluminaHiSeq_miRNASeq, log2(RPM+1) data, version 2016-11-21) (TCGA IlluminaHiSeq_RNASeqV2, log2(normalized_count+1) data, version 2016-08-16) (Spearman’s Rank Correlation (p-value<0.05 and coefficient<-0.25)) |
| Cancer type | miRNA id | miRNA accession | P-val. | Coeff. | # samples |
| Top |
| TissGeneMut for EMX1 |
| TissGeneSNV for EMX1 |
| nsSNV counts per each loci. Different colors of circles represent different cancer types. Circle size denotes number of samples. (TCGA somatic mutation (SNPs and small INDELs) data, version 2016-04-25) * Click on the image to enlarge it in a new window. |
 |
 |
| Somatic nucleotide variants of TissGene across 28 cancer types (X-axis: cancer type and Y-axis: % of mutated samples) The numbers in parentheses are numbers of samples with mutation (nsSNVs). (TCGA somatic mutation (SNPs and small INDELs) data, version 2016-04-25) |
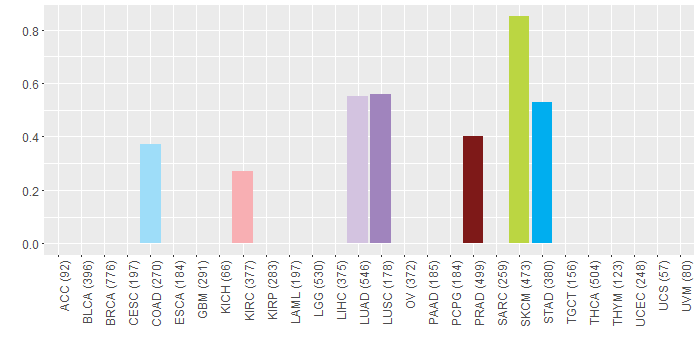 |
| - nsSNVs sorted by frequency. |
| AAchange | Cancer type | # samples |
| p.H134Y | LUAD | 1 |
| p.S259Y | LUAD | 1 |
| p.R271L | HNSC | 1 |
| p.R273H | KIRC | 1 |
| p.G265D | COAD | 1 |
| p.G149S | PRAD | 1 |
| p.L117V | SKCM | 1 |
| p.G256R | SKCM | 1 |
| p.P155T | STAD | 1 |
| p.P140L | LUSC | 1 |
| p.R271W | PRAD | 1 |
| p.P178T | LUAD | 1 |
| p.R196H | STAD | 1 |
| p.P257S | STAD | 1 |
| p.E254K | SKCM | 1 |
| p.G265S | SKCM | 1 |
| Top |
| TissGeneCNV for EMX1 |
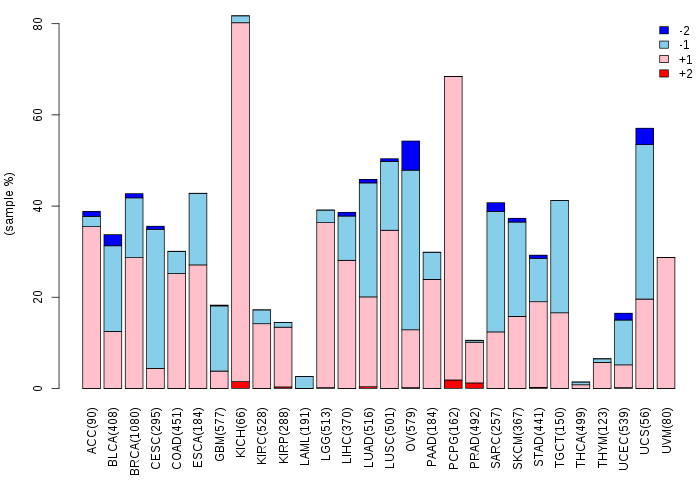
| Copy number variations of TissGene across 28 cancer types (X-axis: cancer type and Y-axis: % of CNV samples) (TCGA Gistic2_CopyNumber_Gistic2_all_data_by_genes, Gistic2 copy number data, version 2016-08-16) |
 |
| Top |
| TissGeneFusions for EMX1 |
| Fusion genes including TissGene (ChimerDB 3.0, 2016-12-01 and TCGA fusion Portal 2015-12-01) |
| Database | Src | Cancer type | Sample | Fusion gene | ORF | 5'-gene BP | 3'-gene BP |
| Chimerdb3.0 | ChiTaRs | NA | AK092368 | EMX1-TARS2 | chr2:73163200 | chr1:150478152 |
| Top |
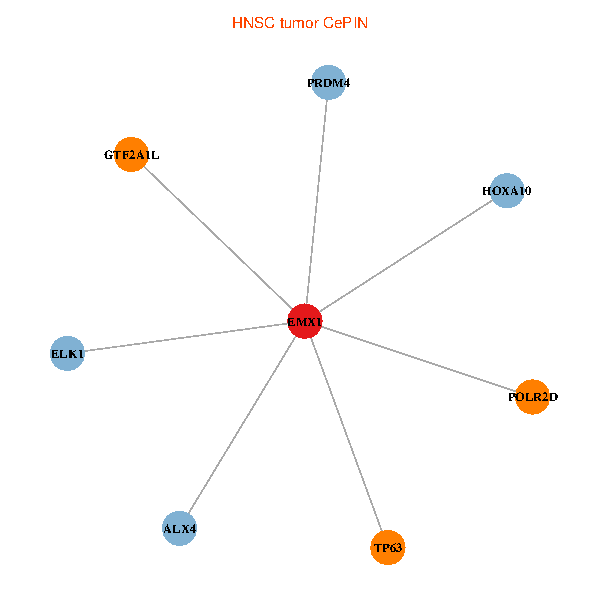
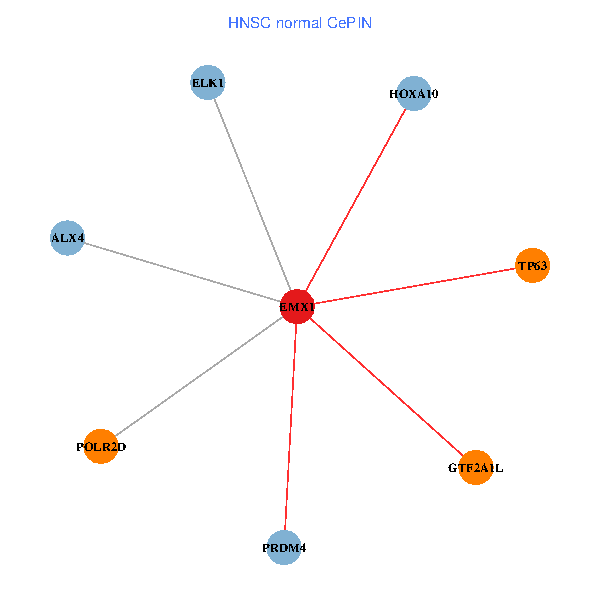
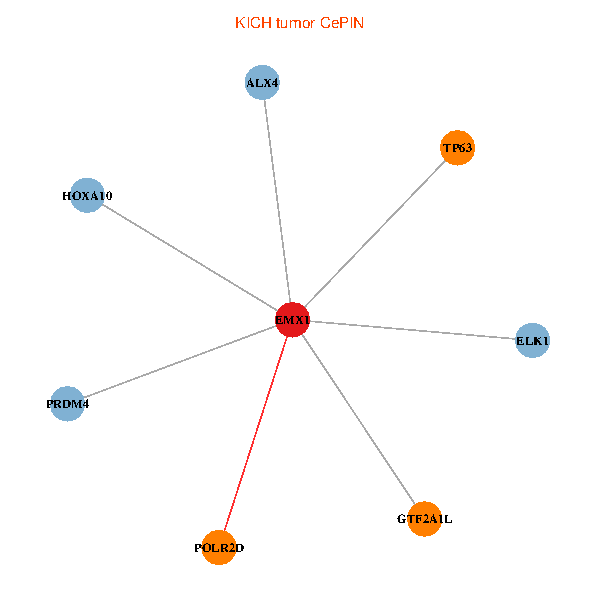
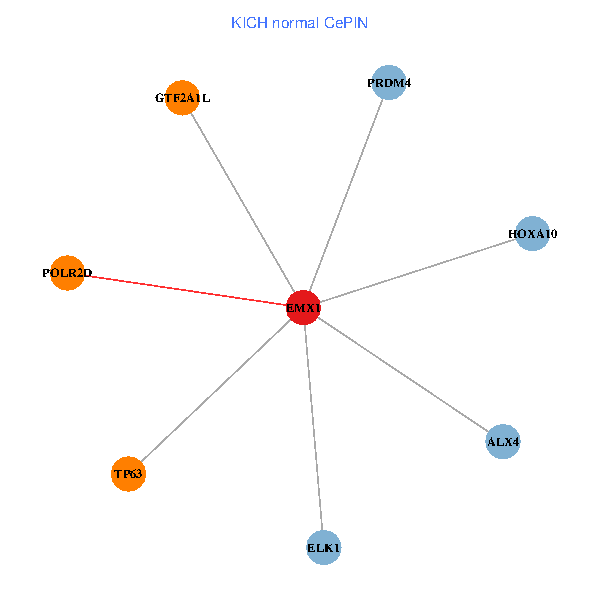
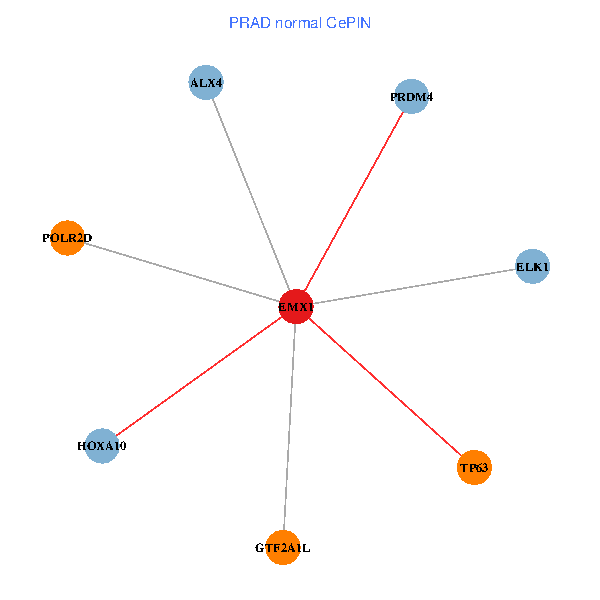
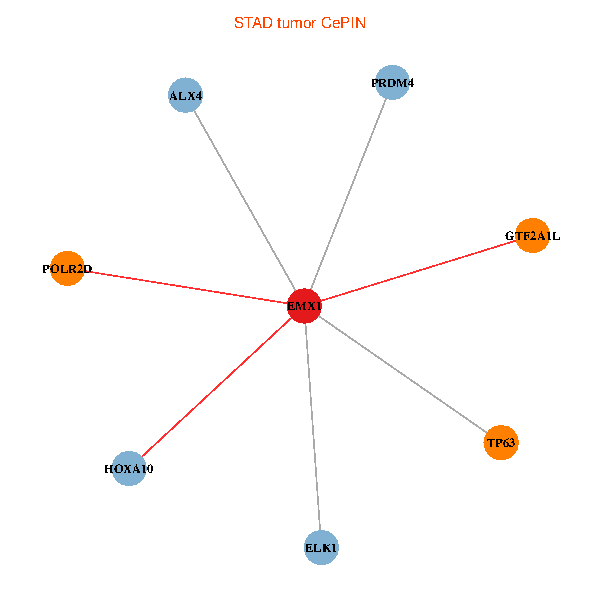
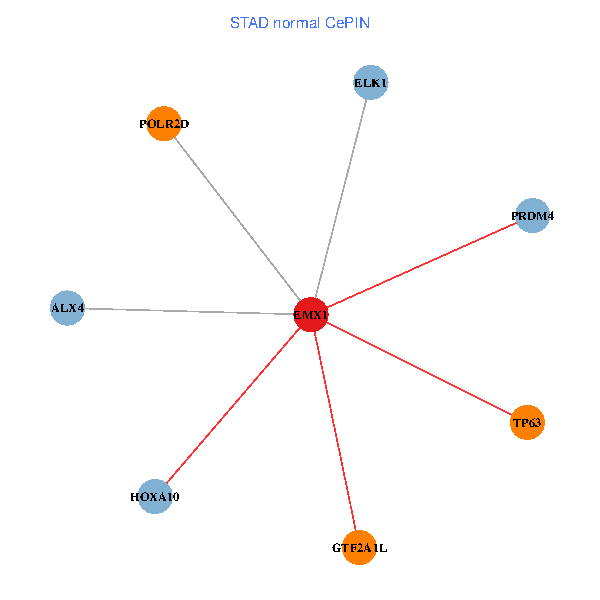
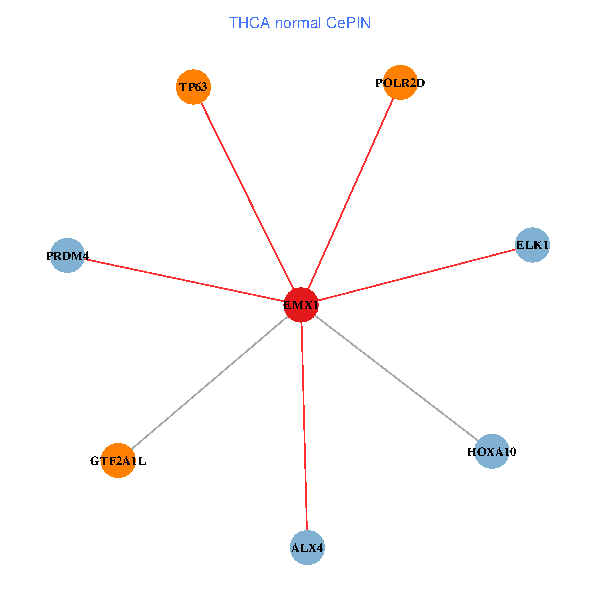
| TissGeneNet for EMX1 |
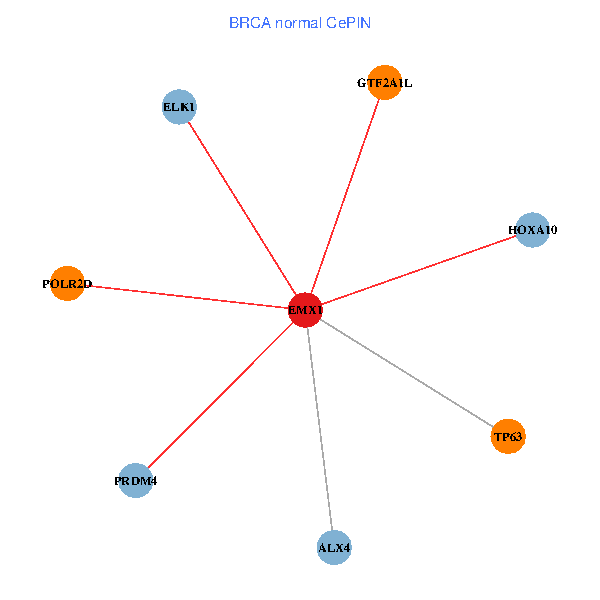
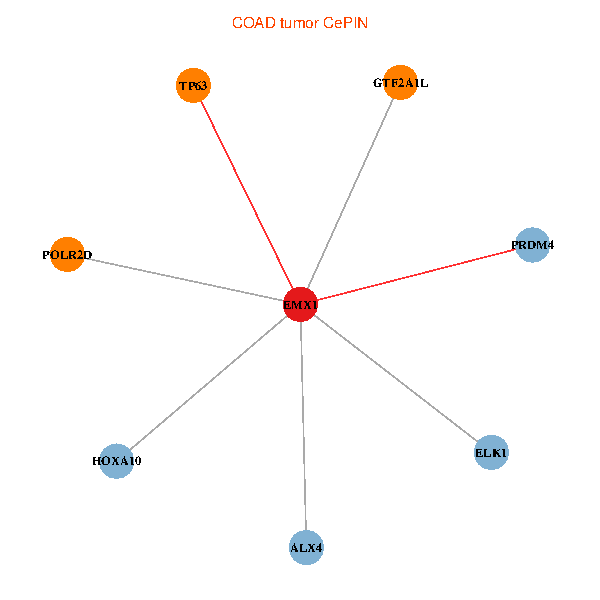
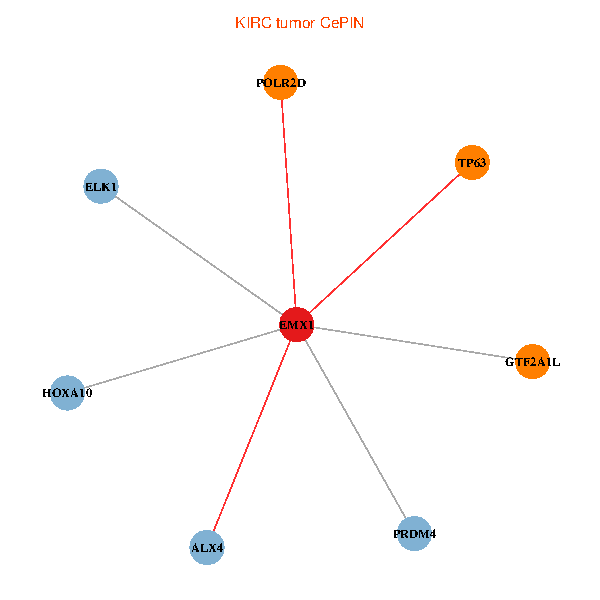
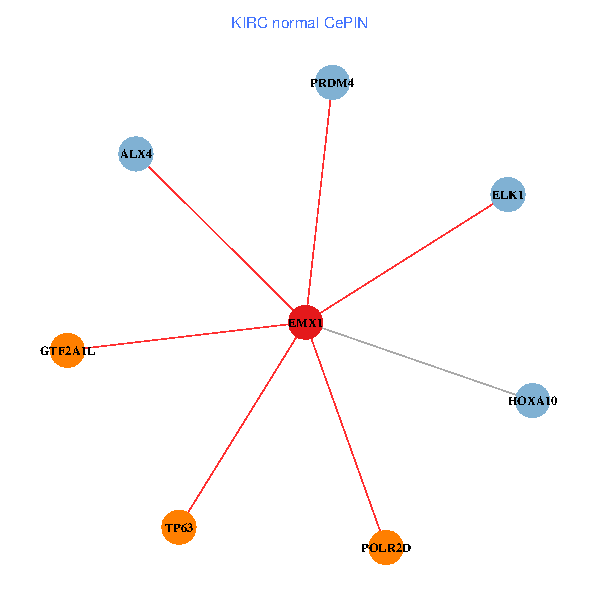
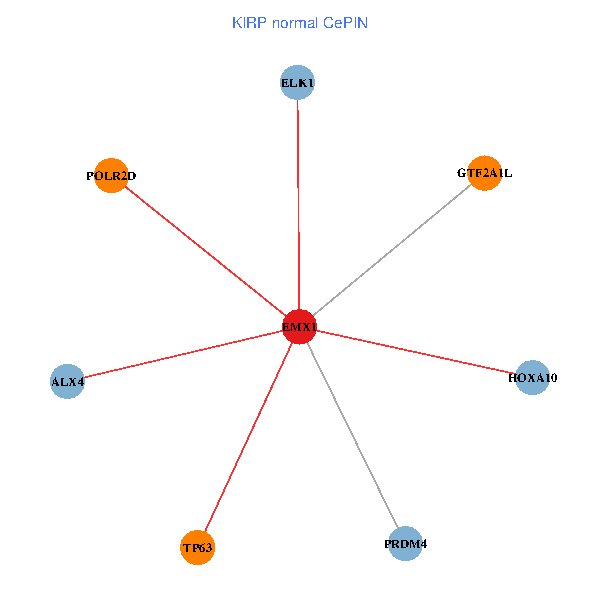
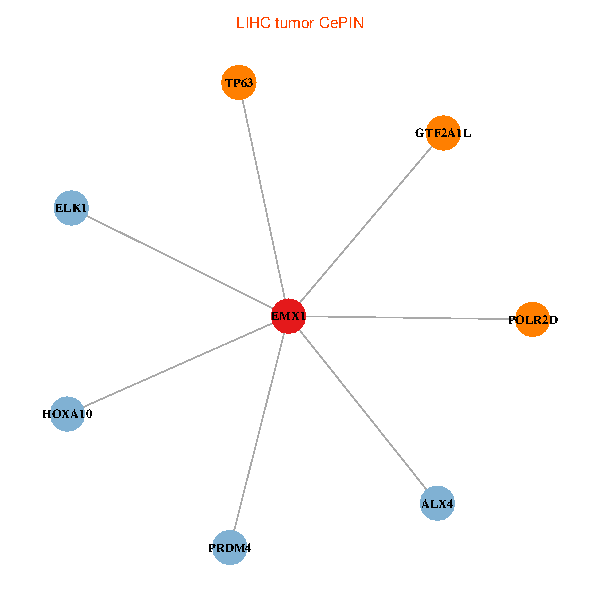
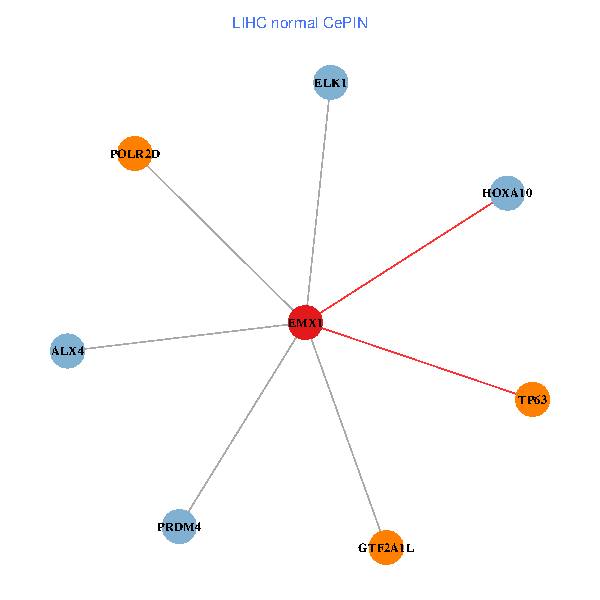
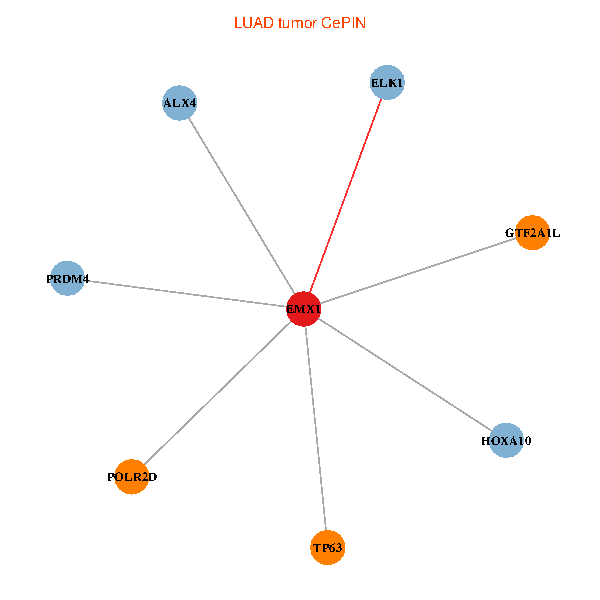
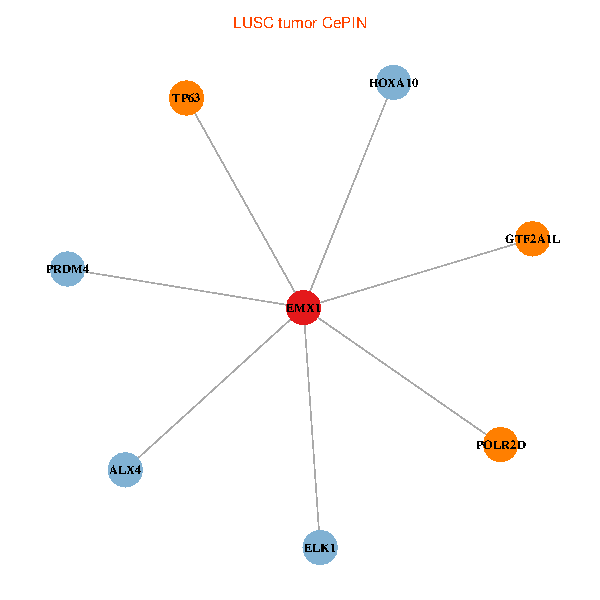
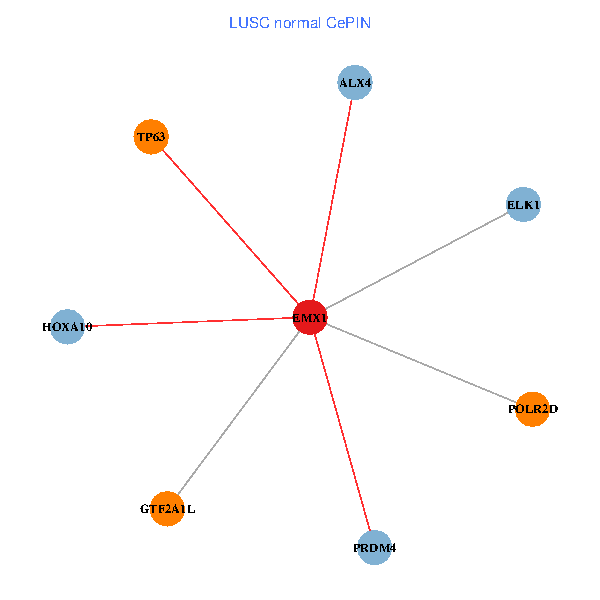
| Co-expressed gene networks based on protein-protein interaction data (CePIN) (TCGA IlluminaHiSeq_RNASeqV2, pan-cancer normalized log2(norm_counts+1) data, version 2016-08-16) (PINA2 ppi data) |
| BRCA (tumor) | BRCA (normal) |
| EMX1, TP63, PRDM4, POLR2D, GTF2A1L, ELK1, HOXA10, ALX4 (tumor) | EMX1, TP63, PRDM4, POLR2D, GTF2A1L, ELK1, HOXA10, ALX4 (normal) |
 |  |
| COAD (tumor) | COAD (normal) |
| EMX1, TP63, PRDM4, POLR2D, GTF2A1L, ELK1, HOXA10, ALX4 (tumor) | EMX1, TP63, PRDM4, POLR2D, GTF2A1L, ELK1, HOXA10, ALX4 (normal) |
 |  |
| HNSC (tumor) | HNSC (normal) |
| EMX1, TP63, PRDM4, POLR2D, GTF2A1L, ELK1, HOXA10, ALX4 (tumor) | EMX1, TP63, PRDM4, POLR2D, GTF2A1L, ELK1, HOXA10, ALX4 (normal) |
 |  |
| KICH (tumor) | KICH (normal) |
| EMX1, TP63, PRDM4, POLR2D, GTF2A1L, ELK1, HOXA10, ALX4 (tumor) | EMX1, TP63, PRDM4, POLR2D, GTF2A1L, ELK1, HOXA10, ALX4 (normal) |
 |  |
| KIRC (tumor) | KIRC (normal) |
| EMX1, TP63, PRDM4, POLR2D, GTF2A1L, ELK1, HOXA10, ALX4 (tumor) | EMX1, TP63, PRDM4, POLR2D, GTF2A1L, ELK1, HOXA10, ALX4 (normal) |
 |  |
| KIRP (tumor) | KIRP (normal) |
| EMX1, TP63, PRDM4, POLR2D, GTF2A1L, ELK1, HOXA10, ALX4 (tumor) | EMX1, TP63, PRDM4, POLR2D, GTF2A1L, ELK1, HOXA10, ALX4 (normal) |
 |  |
| LIHC (tumor) | LIHC (normal) |
| EMX1, TP63, PRDM4, POLR2D, GTF2A1L, ELK1, HOXA10, ALX4 (tumor) | EMX1, TP63, PRDM4, POLR2D, GTF2A1L, ELK1, HOXA10, ALX4 (normal) |
 |  |
| LUAD (tumor) | LUAD (normal) |
| EMX1, TP63, PRDM4, POLR2D, GTF2A1L, ELK1, HOXA10, ALX4 (tumor) | EMX1, TP63, PRDM4, POLR2D, GTF2A1L, ELK1, HOXA10, ALX4 (normal) |
 |  |
| LUSC (tumor) | LUSC (normal) |
| EMX1, TP63, PRDM4, POLR2D, GTF2A1L, ELK1, HOXA10, ALX4 (tumor) | EMX1, TP63, PRDM4, POLR2D, GTF2A1L, ELK1, HOXA10, ALX4 (normal) |
 |  |
| PRAD (tumor) | PRAD (normal) |
| EMX1, TP63, PRDM4, POLR2D, GTF2A1L, ELK1, HOXA10, ALX4 (tumor) | EMX1, TP63, PRDM4, POLR2D, GTF2A1L, ELK1, HOXA10, ALX4 (normal) |
 |  |
| STAD (tumor) | STAD (normal) |
| EMX1, TP63, PRDM4, POLR2D, GTF2A1L, ELK1, HOXA10, ALX4 (tumor) | EMX1, TP63, PRDM4, POLR2D, GTF2A1L, ELK1, HOXA10, ALX4 (normal) |
 |  |
| THCA (tumor) | THCA (normal) |
| EMX1, TP63, PRDM4, POLR2D, GTF2A1L, ELK1, HOXA10, ALX4 (tumor) | EMX1, TP63, PRDM4, POLR2D, GTF2A1L, ELK1, HOXA10, ALX4 (normal) |
 |  |
| Top |
| TissGeneProg for EMX1 |
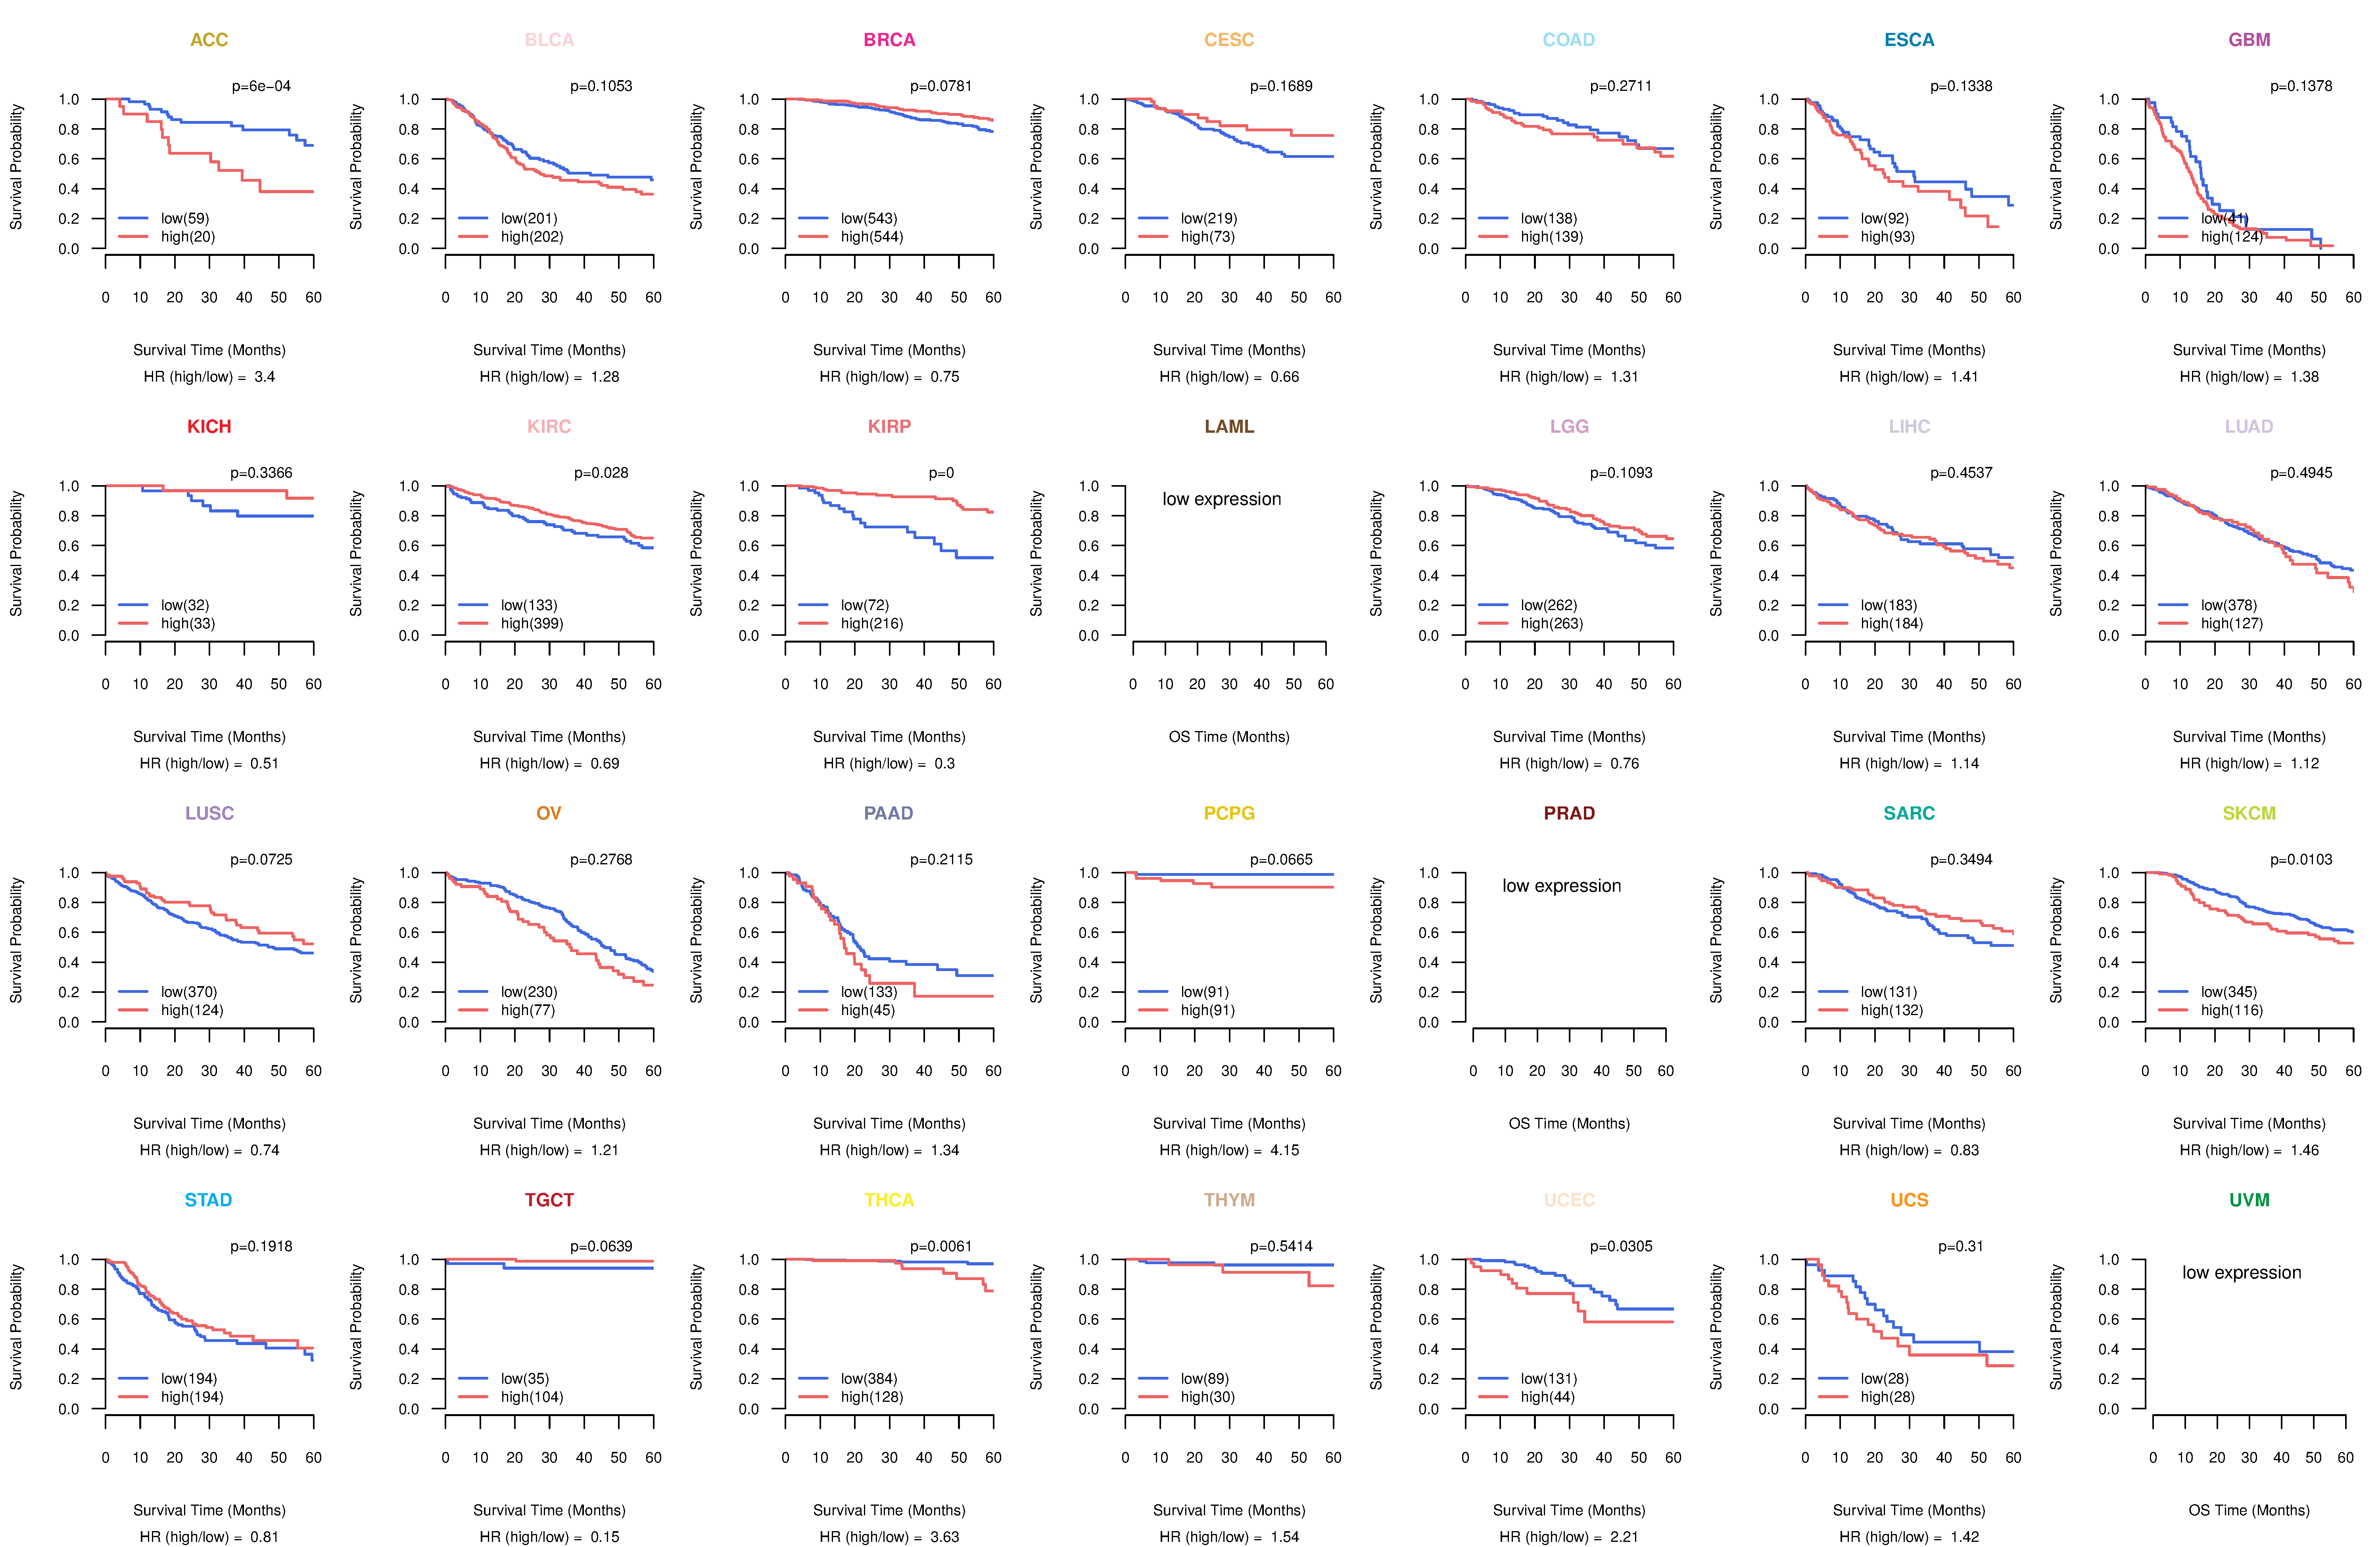
| Kaplan-Meier plots with logrank tests of overall survival (OS) using 28 cancer types (TCGA IlluminaHiSeq_RNASeqV2, pan-cancer normalized log2(norm_counts+1) data, version 2016-08-16) (TCGA clinicalMatrix, phenotype data, version 2016-04-27) * Click on the image to enlarge it in a new window. |
 |
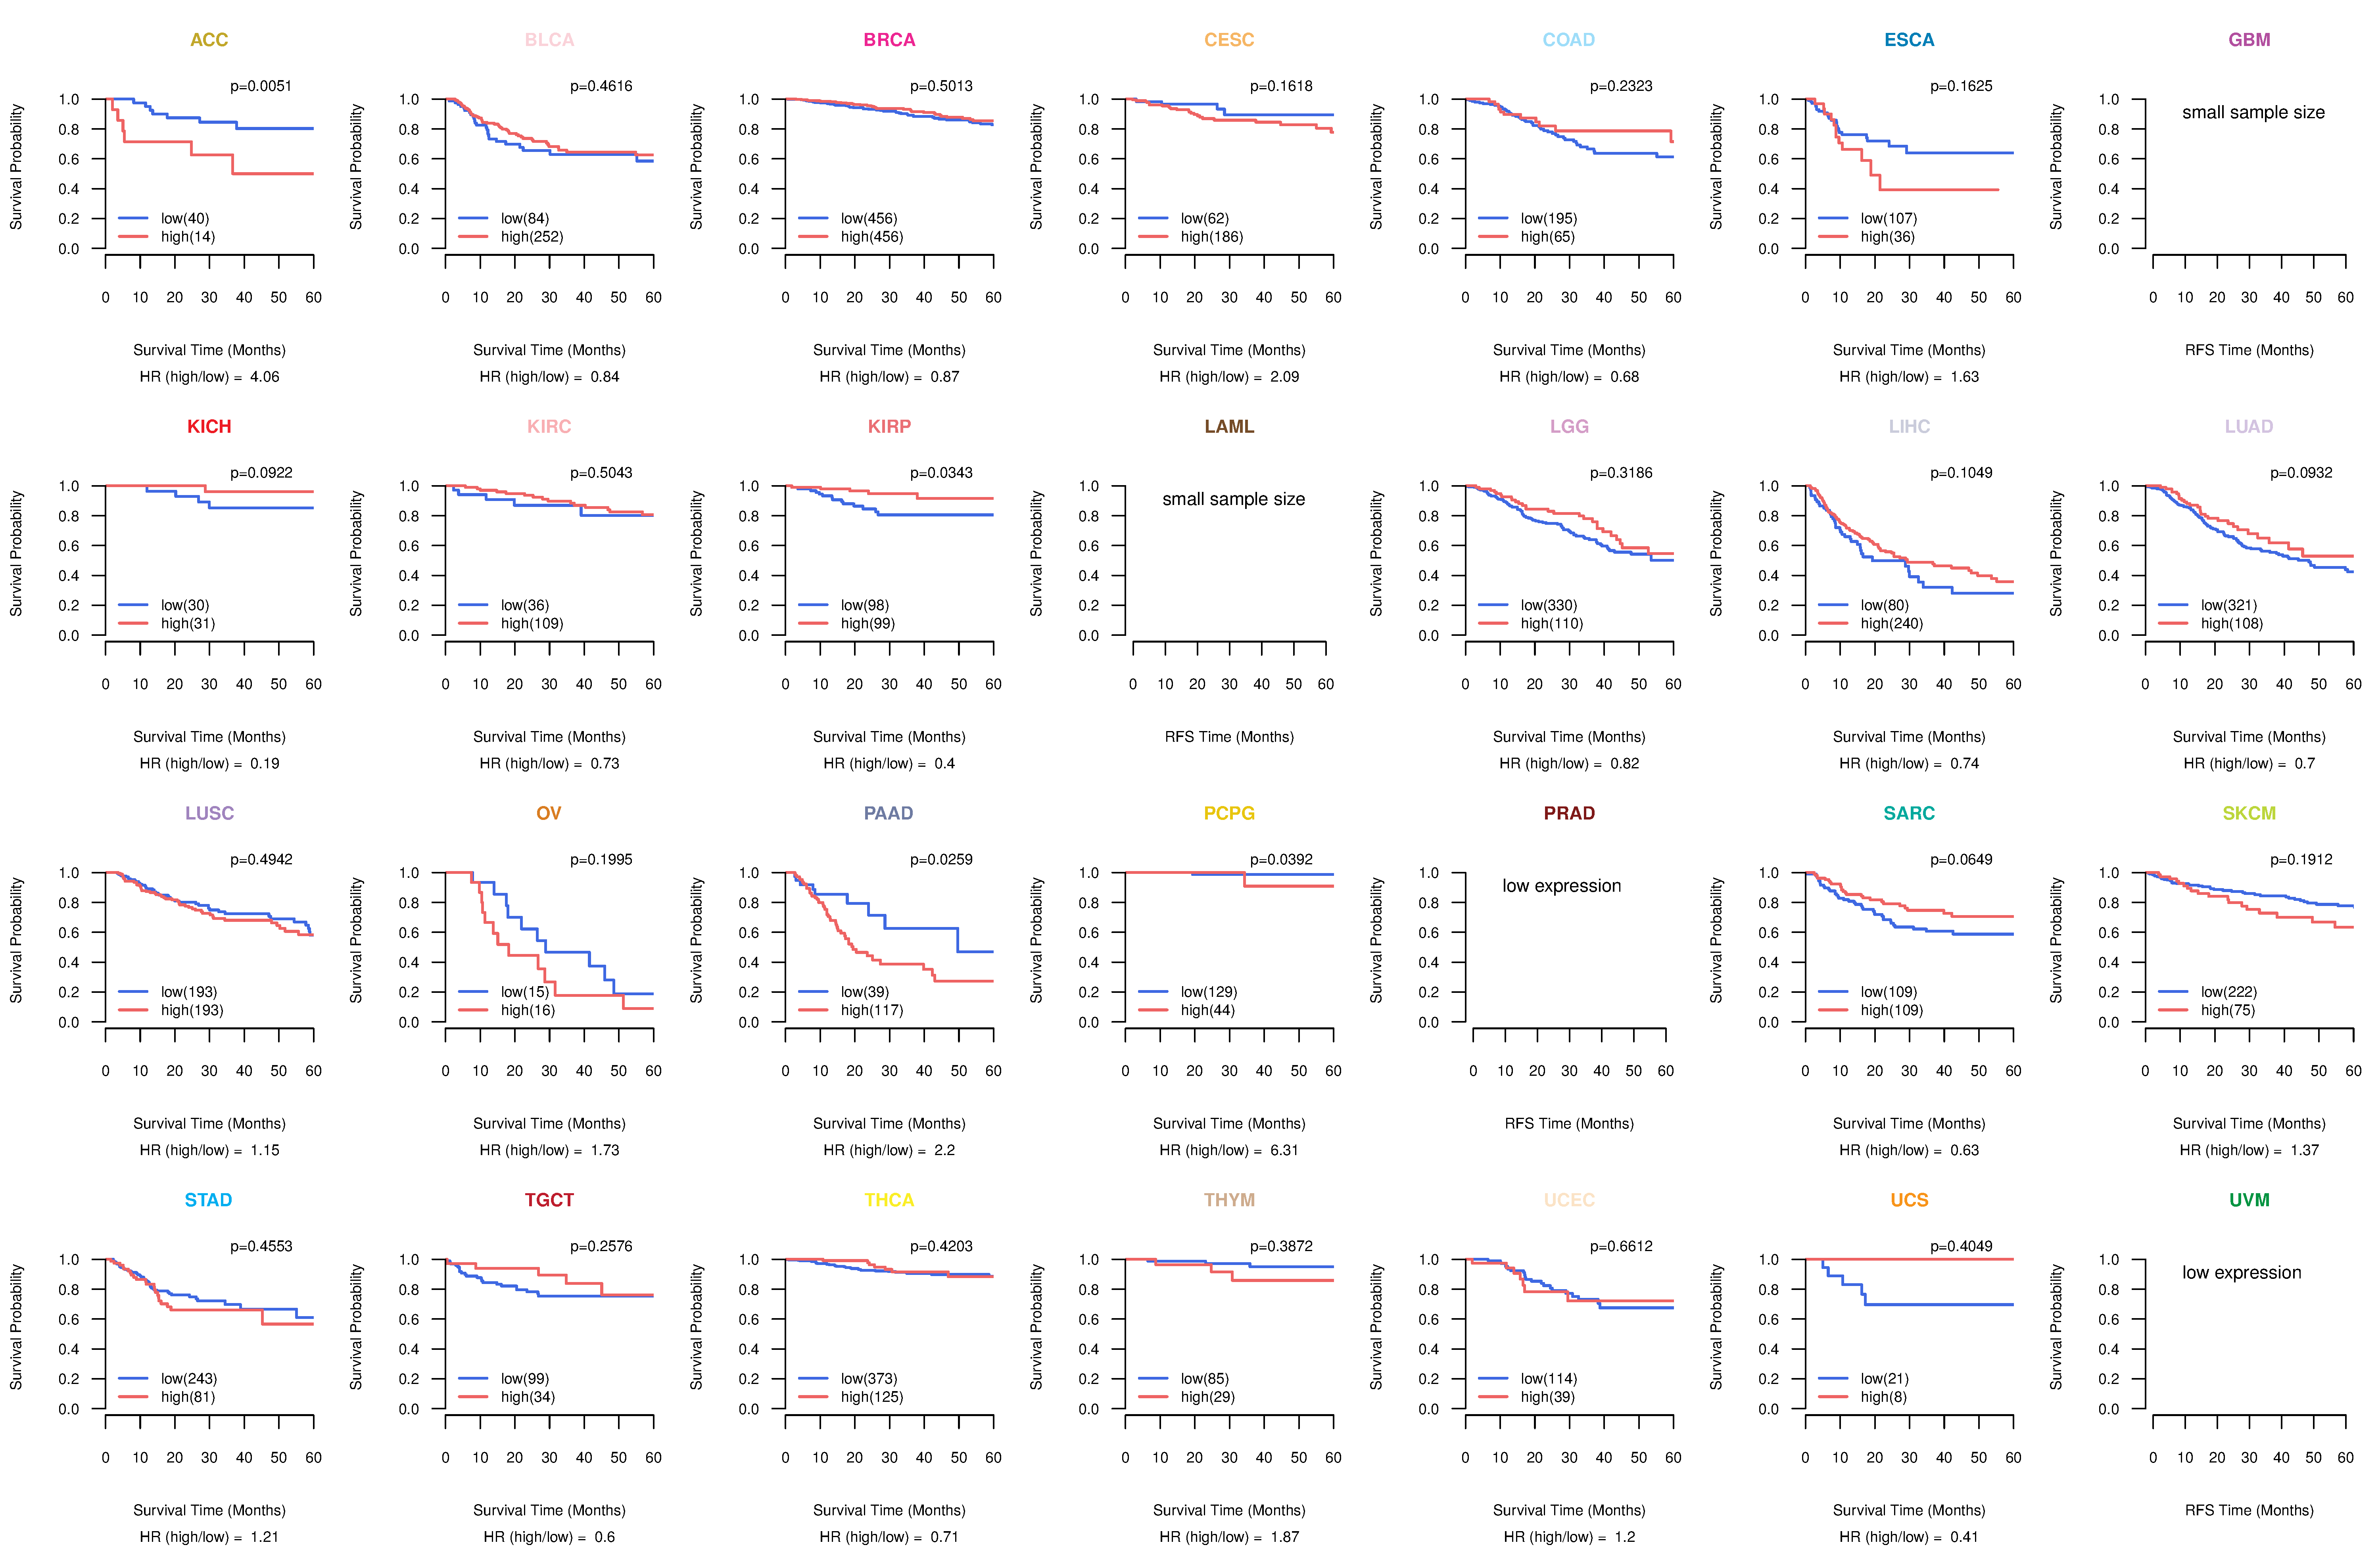
| Kaplan-Meier plots with logrank test of relapse free survival (RFS) using 28 cancer types (TCGA IlluminaHiSeq_RNASeqV2, pan-cancer normalized log2(norm_counts+1) data, version 2016-08-16) (TCGA clinicalMatrix, phenotype data, version 2016-04-27) * Click on the image enlarge it in a new window. |
 |
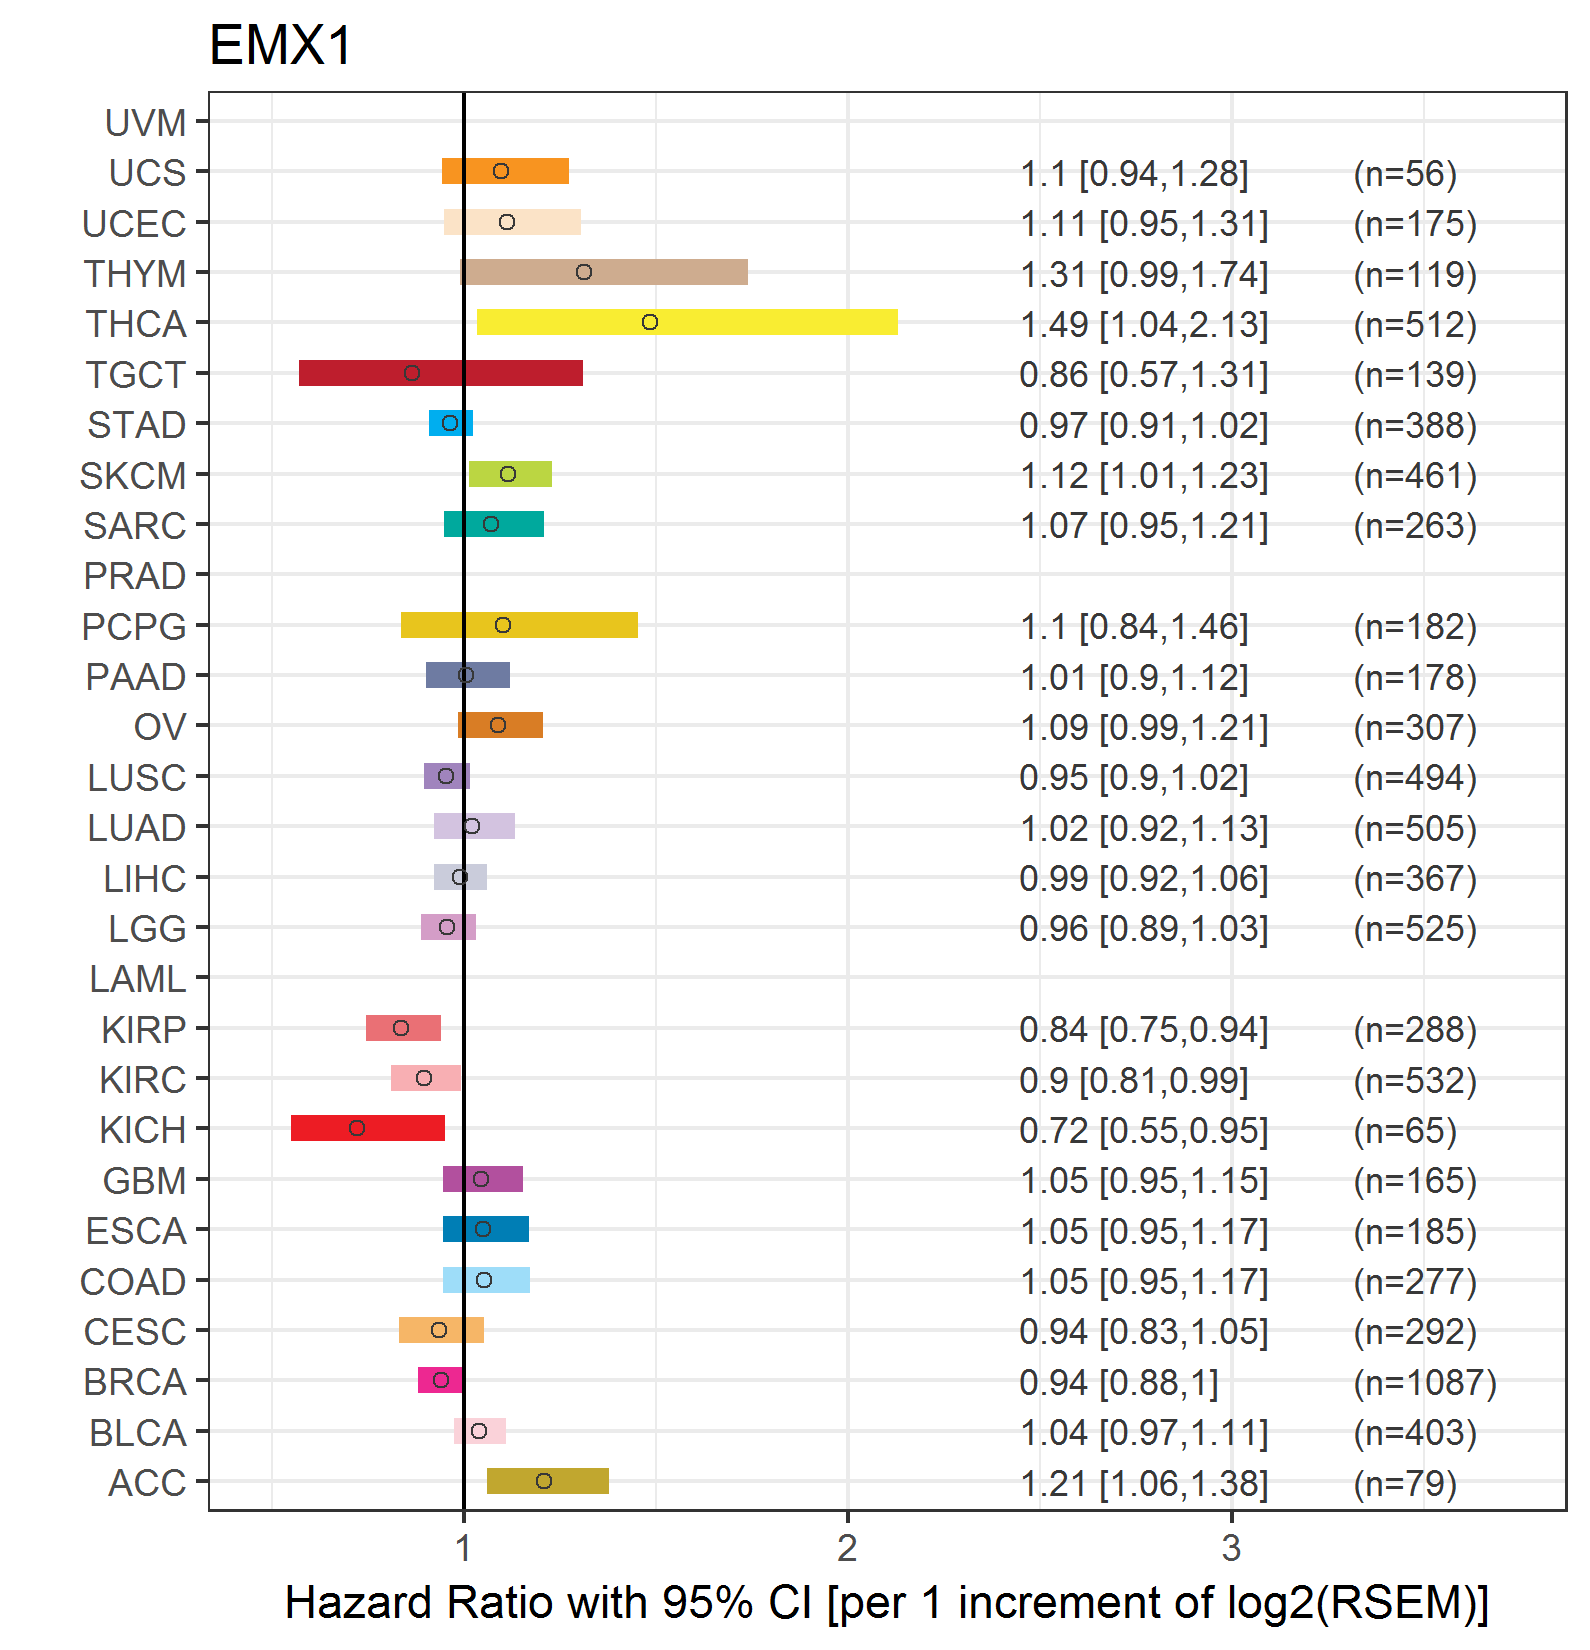
| Forest plot of Cox proportional hazard ratio (HR) and 95% CI of overall survival (OS) using 28 cancer types (TCGA IlluminaHiSeq_RNASeqV2, pan-cancer normalized log2(norm_counts+1) data, version 2016-08-16) (TCGA clinicalMatrix, phenotype data, version 2016-04-27) * Click on the image enlarge it in a new window. |
 |
| Forest plot of Cox proportional hazard ratio (HR) and 95% CI of relapse free survival (RFS) using 28 cancer types (TCGA IlluminaHiSeq_RNASeqV2, pan-cancer normalized log2(norm_counts+1) data, version 2016-08-16) (TCGA clinicalMatrix, phenotype data, version 2016-04-27) * Click on the image enlarge it in a new window. |
 |
| Top |
| TissGeneClin for EMX1 |
| TissGeneDrug for EMX1 |
| Drug information targeting TissGene (DrugBank Version 5.0.6, 2017-04-01) |
| DrugBank ID | Drug name | Drug activity | Drug type | Drug status |
| Top |
| TissGeneDisease for EMX1 |
| Disease information associated with TissGene (DisGeNet, 2016-06-01) |
| Disease ID | Disease name | # pubmeds | Source |
| umls:C0162809 | Kallmann Syndrome | 1 | BeFree |
|
Copyright 2016-Present - The University of Texas Health Science Center at Houston (UTHealth) Web File Viewing | How to Report, Fraud, Waste and Abuse | State of Texas | Statewide Search | Texas Homeland Security | Site Policies |