 |
| |
| |
| |
| |
| |
| |
|

| TissGeneSummary for PAGE2 |
 Gene summary Gene summary |
| Basic gene information | Gene symbol | PAGE2 |
| Gene name | P antigen family, member 2 (prostate associated) | |
| Synonyms | CT16.4|GAGEC2|GAGEE2|PAGE-2 | |
| Cytomap | UCSC genome browser: Xp11.21 | |
| Type of gene | protein-coding | |
| RefGenes | NM_207339.2, | |
| Description | G antigen family C 2G antigen, family C, 2G antigen, family E, 2P antigen family member 2g antigen family E member 2prostate-associated gene 2 protein | |
| Modification date | 20141207 | |
| dbXrefs | MIM : 300738 | |
| HGNC : HGNC | ||
| Ensembl : ENSG00000234068 | ||
| HPRD : 17565 | ||
| Vega : OTTHUMG00000021648 | ||
| Protein | UniProt: go to UniProt's Cross Reference DB Table | |
| Expression | CleanEX: HS_PAGE2 | |
| BioGPS: 203569 | ||
| Pathway | NCI Pathway Interaction Database: PAGE2 | |
| KEGG: PAGE2 | ||
| REACTOME: PAGE2 | ||
| Pathway Commons: PAGE2 | ||
| Context | iHOP: PAGE2 | |
| ligand binding site mutation search in PubMed: PAGE2 | ||
| UCL Cancer Institute: PAGE2 | ||
| Assigned class in TissGDB* | C | |
| Included tissue-specific gene expression resources | HPA,GTEx | |
| Specific-tissues in normal samples (assigned by TissGDB using HPA, TiGER, and GTEx) | Testis | |
| Cancer types related to the specific-tissues in cancer samples (assigned by TissGDB using TCGA) | TGCT | |
| Reference showing the relevant tissue of PAGE2 | ||
| Description by TissGene annotations | ||
| * Class A consists of genes with literature evidence and is part of the cTissGenes. Class B consists of only cTissGenes without additional evidence. The remaining genes belong to Class C. |
| Gene ontology having evidence of Inferred from Direct Assay (IDA) from Entrez |
| GO ID | GO term | PubMed ID |
| Top |
| TissGeneExp for PAGE2 |
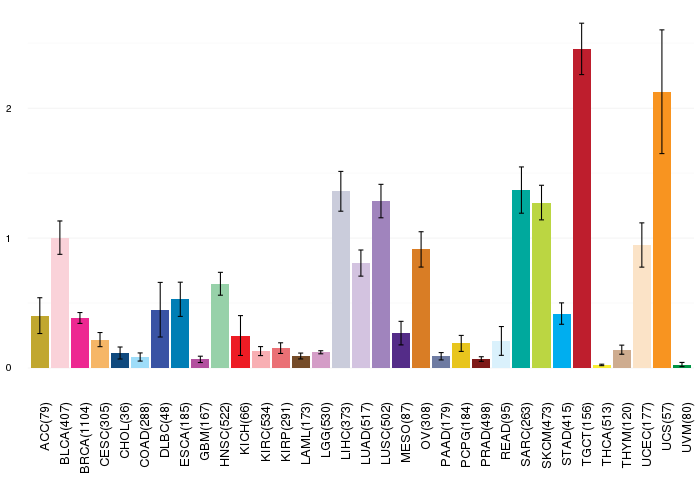
| Gene expressions across 28 cancer types (X-axis: cancer type and Y-axis: log2(norm_counts+1)) (TCGA IlluminaHiSeq_RNASeqV2, pan-cancer normalized log2(norm_counts+1) data, version 2016-08-16) |
 |
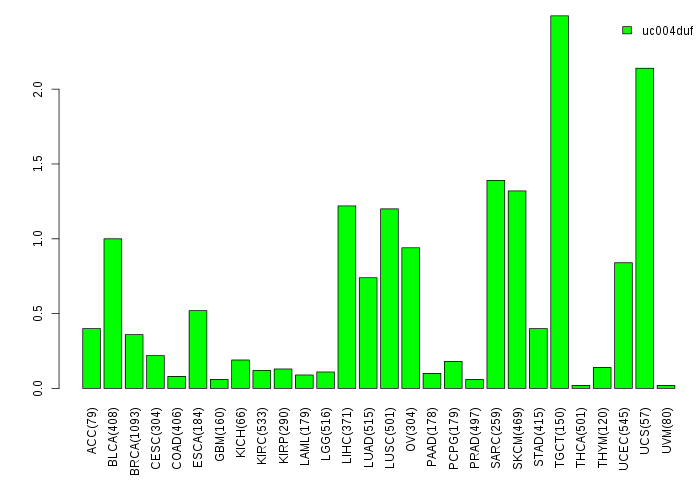
| Gene isoform expressions across 28 cancer types (X-axis: cancer type and Y-axis: log2(norm_counts+1)) (TCGA pan-cancer tcga_rsem_isoform_tpm, version 2016-09-01) |
 |
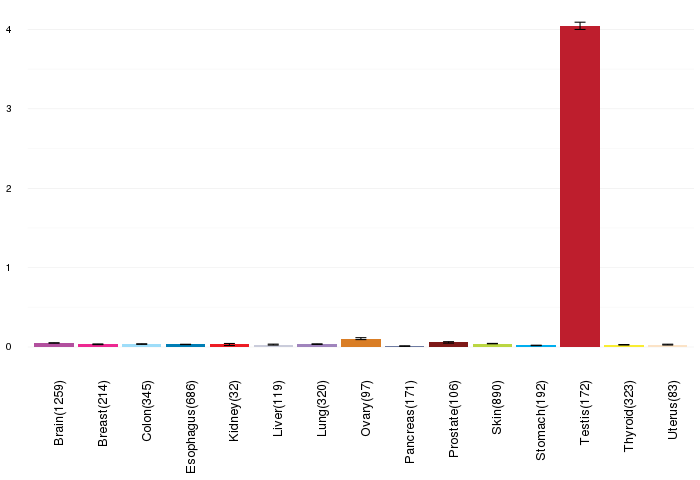
| Gene expressions across normal tissues of GTEx data (GTEx GTEx_Analysis_v6_RNA-seq_RNA-SeQCv1.1.8_gene_rpkm.gct) - Here, we shows the matched tissue types only among our 28 cancer types. |
 |
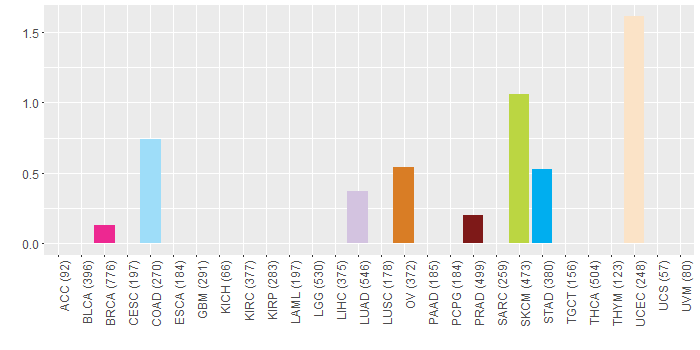
| Different expressions across 14 cancer types with more than 10 samples between matched tumors and normals (X-axis: cancer type and Y-axis: log2(norm_counts+1)) (TCGA IlluminaHiSeq_RNASeqV2, pan-cancer normalized log2(norm_counts+1) data, version 2016-08-16) |
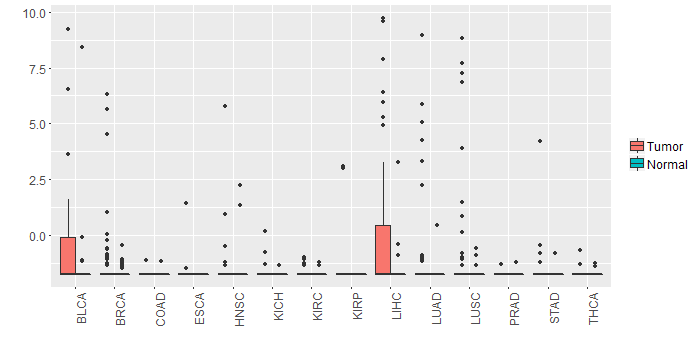 |
| - Significantly differentially expressed cancer types and information. (|Fold change|>1 and FDR<0.05) |
| Cancer type | Mean(exp) in tumor | Mean(exp) in matched normal | Log2FC | P-val. | FDR |
| LUSC | -0.676441433 | -1.679855159 | 1.003413725 | 0.00956 | 0.015268879 |
| LIHC | 0.017874332 | -1.582933668 | 1.600808 | 0.00109 | 0.00295591 |
| Top |
| TissGene-miRNA for PAGE2 |
| Significantly anti-correlated miRNAs of TissGene across 28 cancer types (Gene-miRNA relations from TargetScanHuman Relsease 7.1, Conserved_Site_Context_Scores.txt.zip, 06.01.2016) (TCGA IlluminaHiSeq_miRNASeq, log2(RPM+1) data, version 2016-11-21) (TCGA IlluminaHiSeq_RNASeqV2, log2(normalized_count+1) data, version 2016-08-16) (Spearman’s Rank Correlation (p-value<0.05 and coefficient<-0.25)) |
| Cancer type | miRNA id | miRNA accession | P-val. | Coeff. | # samples |
| Top |
| TissGeneMut for PAGE2 |
| TissGeneSNV for PAGE2 |
| nsSNV counts per each loci. Different colors of circles represent different cancer types. Circle size denotes number of samples. (TCGA somatic mutation (SNPs and small INDELs) data, version 2016-04-25) * Click on the image to enlarge it in a new window. |
 |
 |
| Somatic nucleotide variants of TissGene across 28 cancer types (X-axis: cancer type and Y-axis: % of mutated samples) The numbers in parentheses are numbers of samples with mutation (nsSNVs). (TCGA somatic mutation (SNPs and small INDELs) data, version 2016-04-25) |
 |
| - nsSNVs sorted by frequency. |
| AAchange | Cancer type | # samples |
| p.E35K | SKCM | 2 |
| p.E39D | STAD | 1 |
| p.D67G | UCEC | 1 |
| p.T101S | COAD | 1 |
| p.E56K | HNSC | 1 |
| p.Q58K | UCEC | 1 |
| p.S21F | SKCM | 1 |
| p.E54D | UCEC | 1 |
| p.S26F | SKCM | 1 |
| p.G93D | PRAD | 1 |
| p.D17Y | UCEC | 1 |
| p.M95V | STAD | 1 |
| p.E74* | OV | 1 |
| p.E81* | LUAD | 1 |
| p.E92K | BRCA | 1 |
| p.P61H | COAD | 1 |
| p.E19K | SKCM | 1 |
| p.G65W | OV | 1 |
| p.E39* | LUAD | 1 |
| Top |
| TissGeneCNV for PAGE2 |
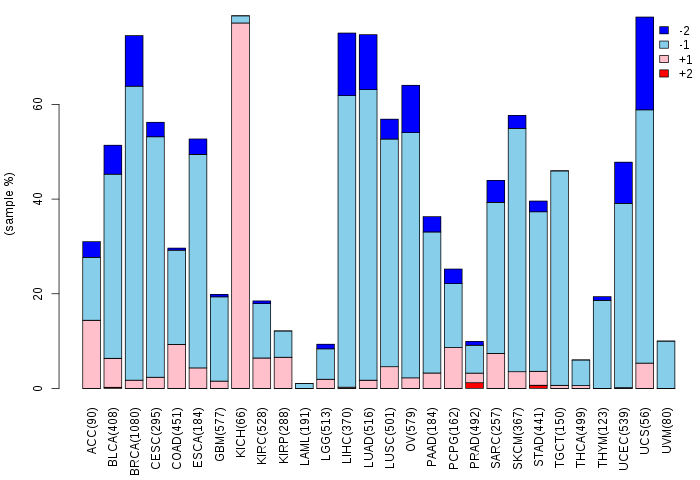
| Copy number variations of TissGene across 28 cancer types (X-axis: cancer type and Y-axis: % of CNV samples) (TCGA Gistic2_CopyNumber_Gistic2_all_data_by_genes, Gistic2 copy number data, version 2016-08-16) |
 |
| Top |
| TissGeneFusions for PAGE2 |
| Fusion genes including TissGene (ChimerDB 3.0, 2016-12-01 and TCGA fusion Portal 2015-12-01) |
| Database | Src | Cancer type | Sample | Fusion gene | ORF | 5'-gene BP | 3'-gene BP |
| Top |
| TissGeneNet for PAGE2 |
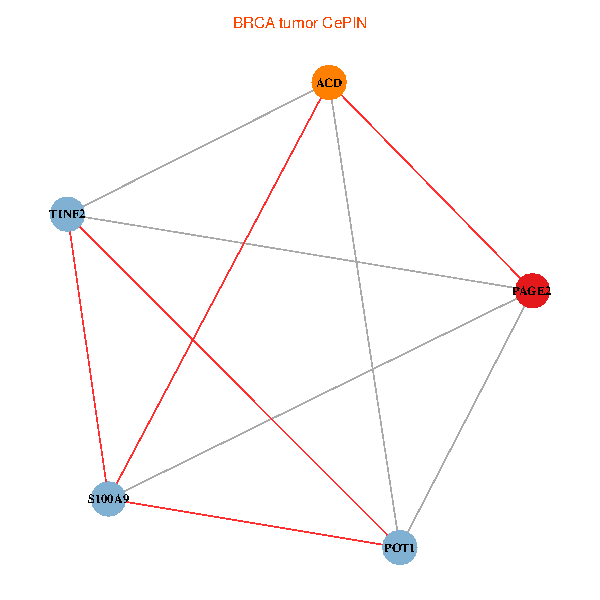
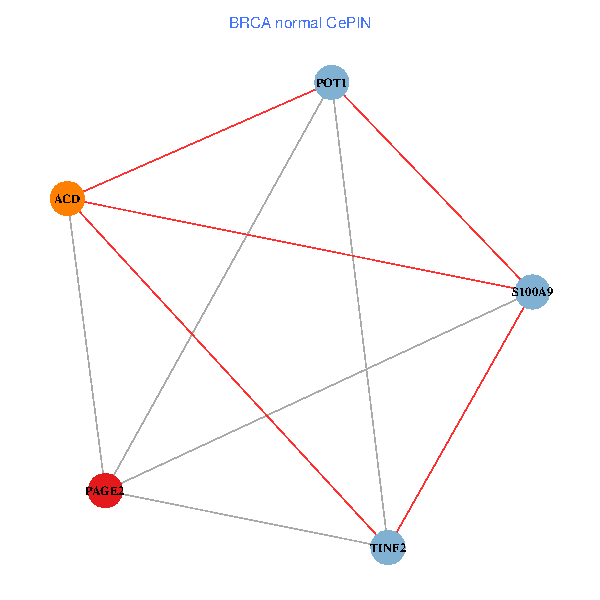
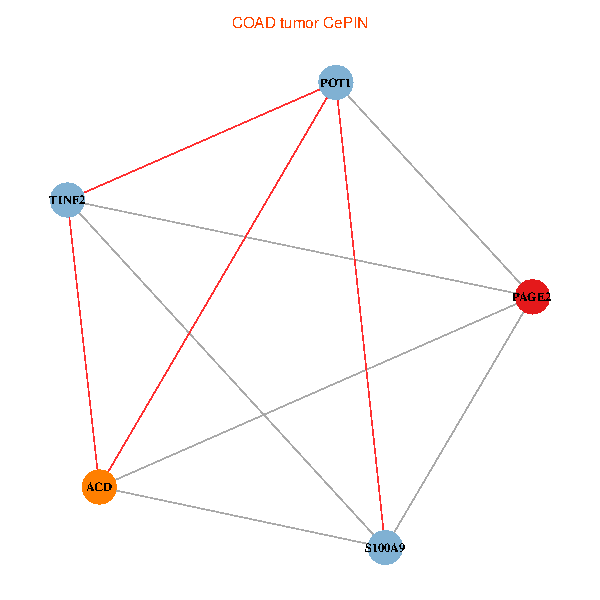
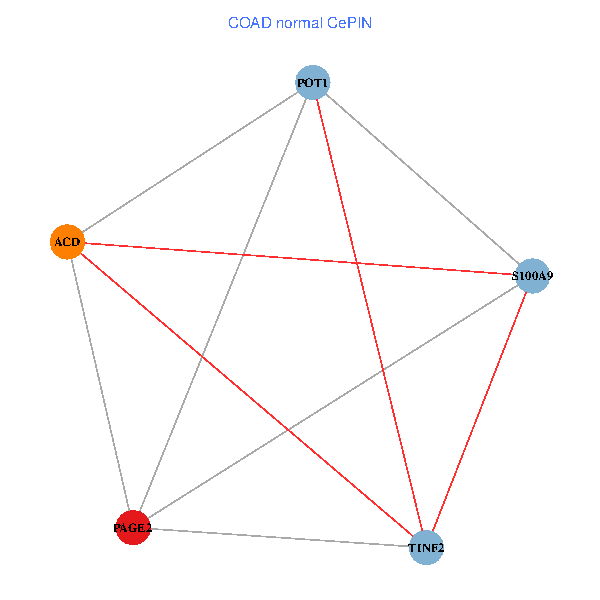
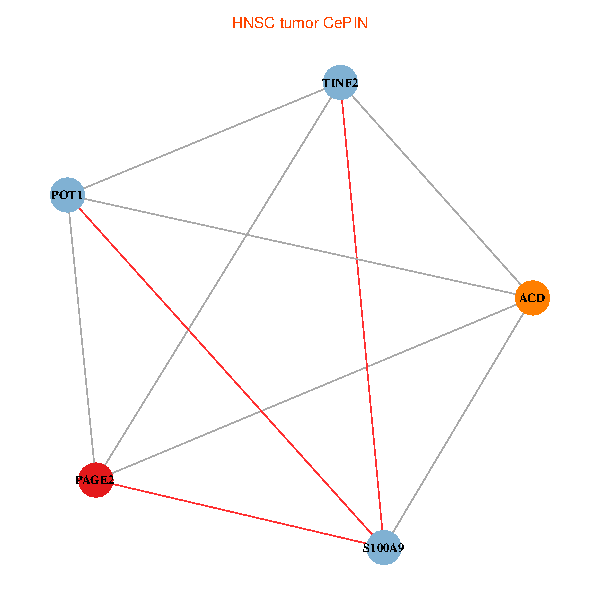
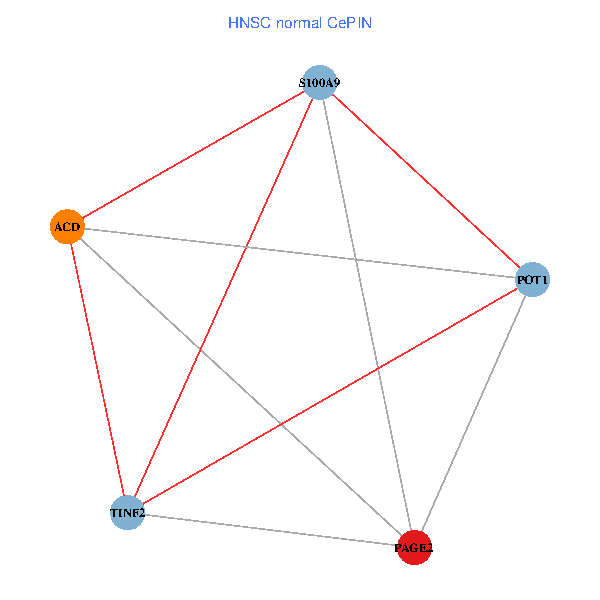
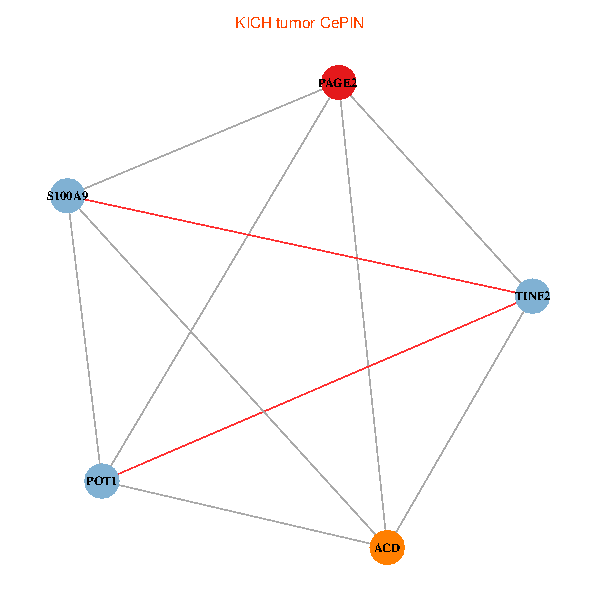
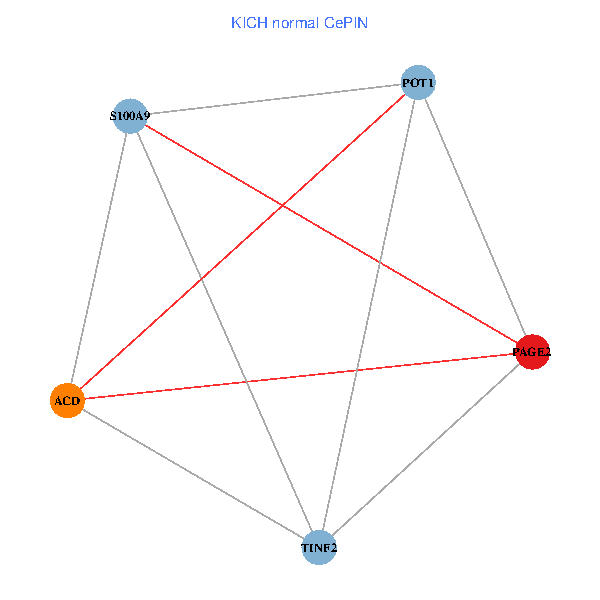
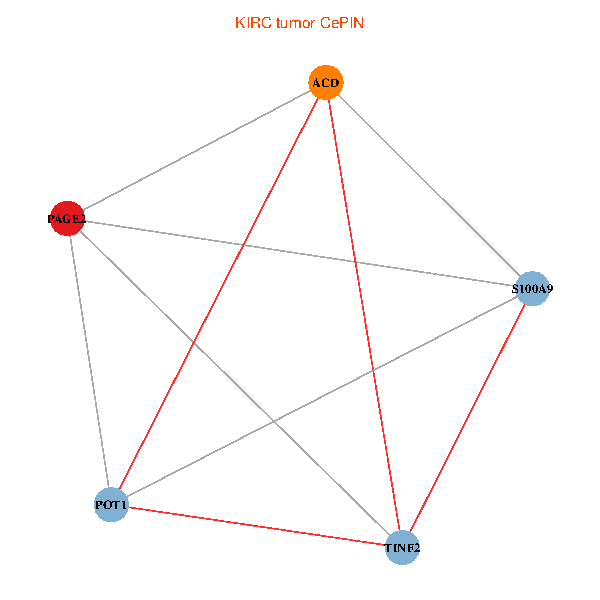
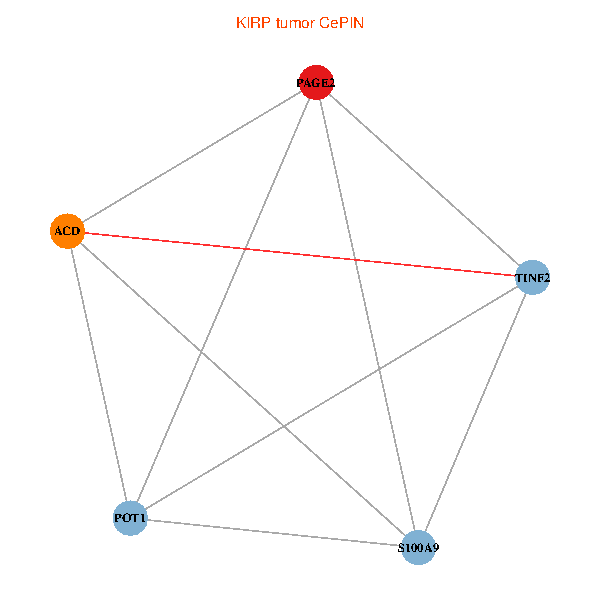
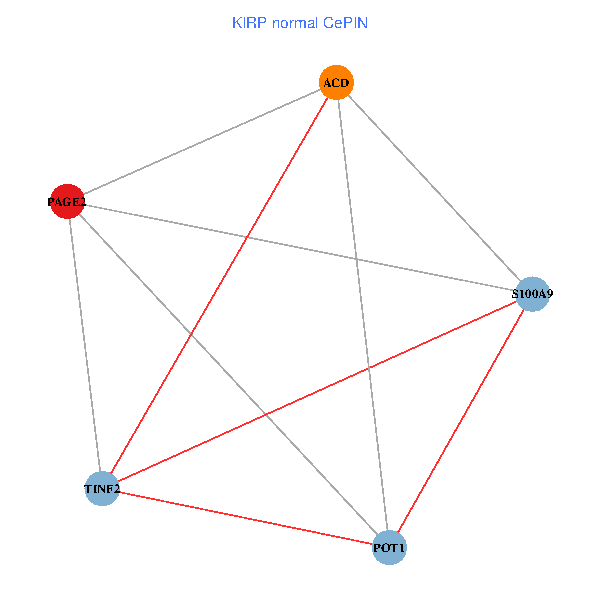
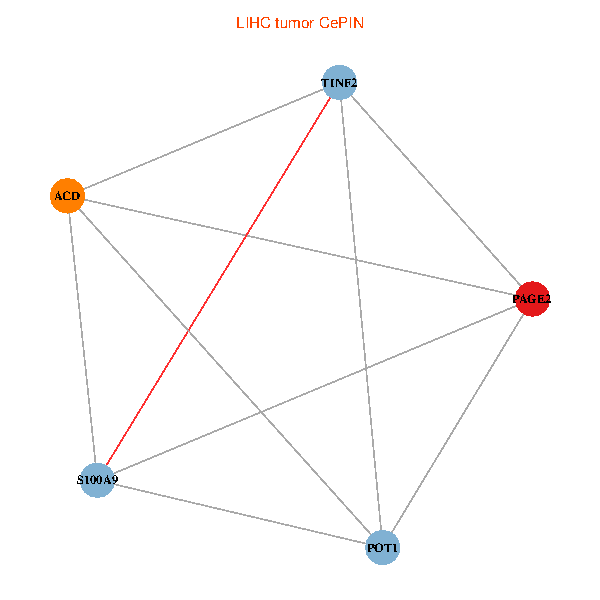
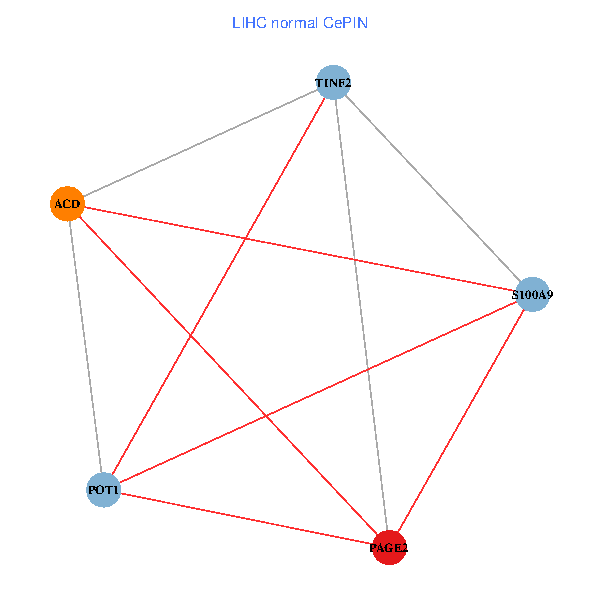
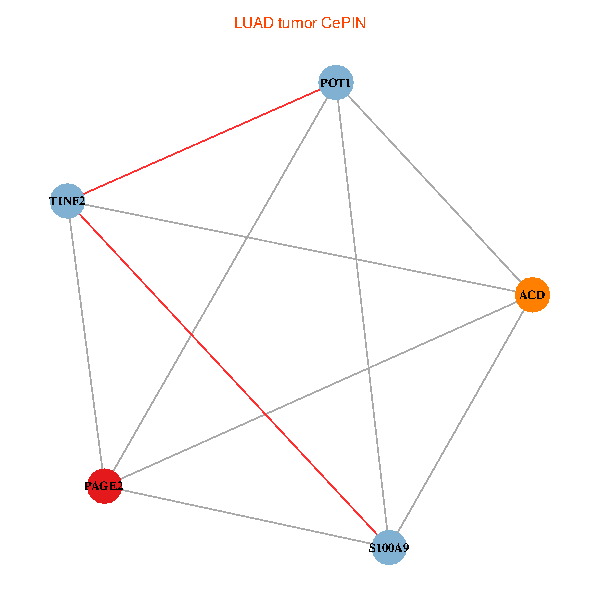
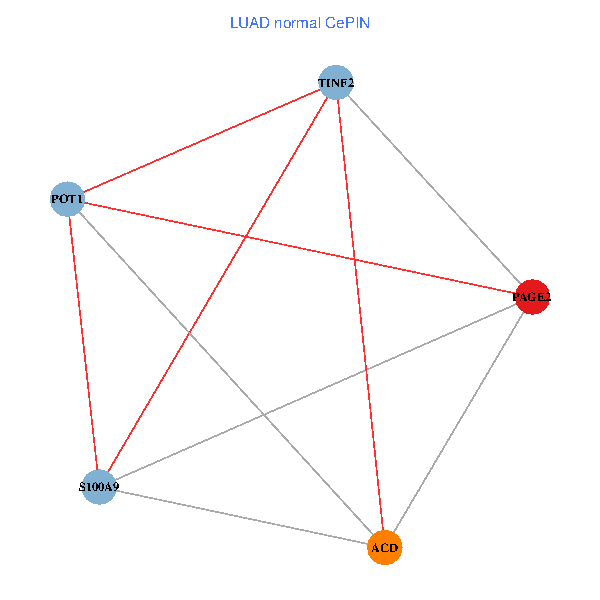
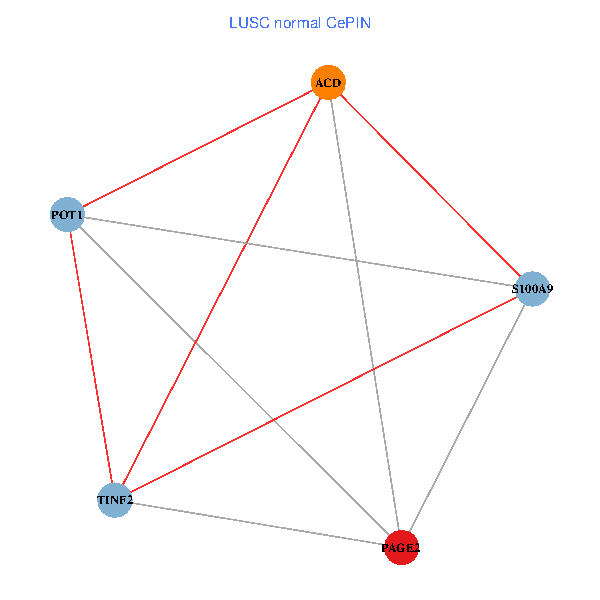
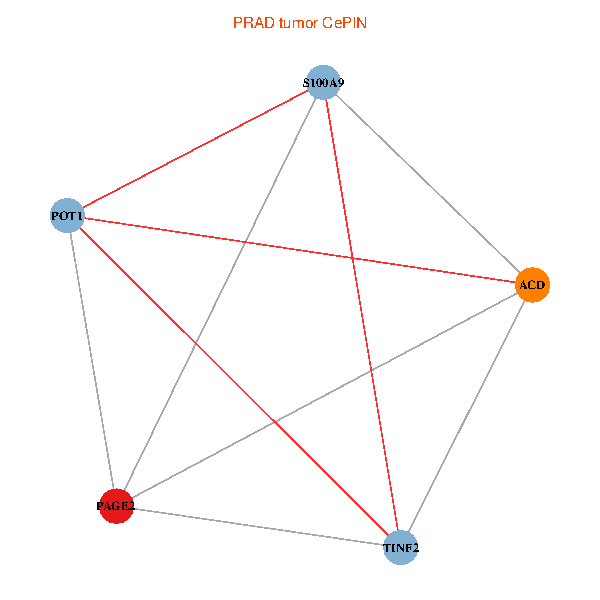
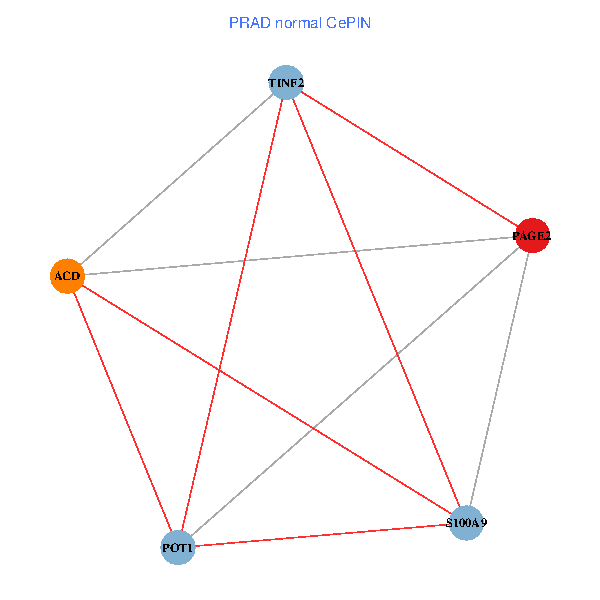
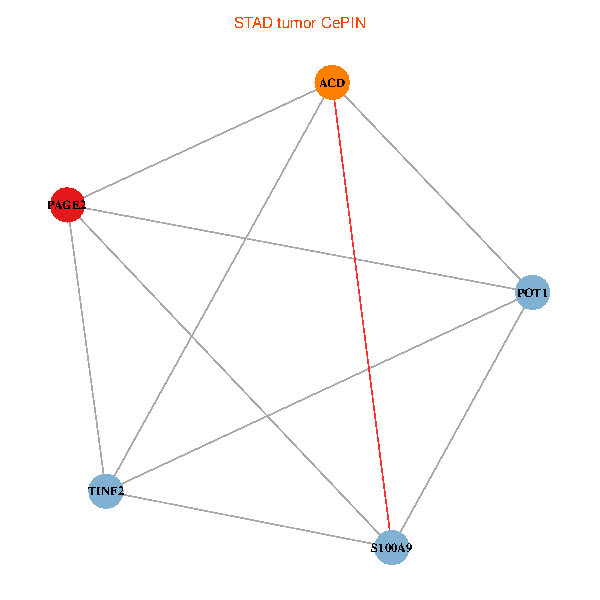
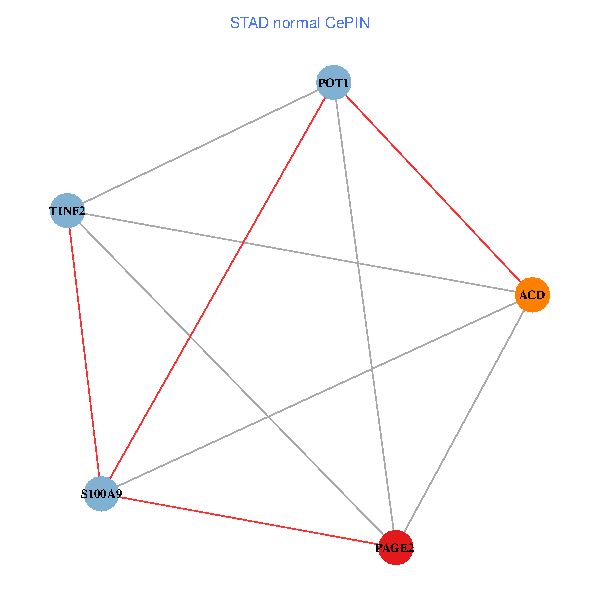
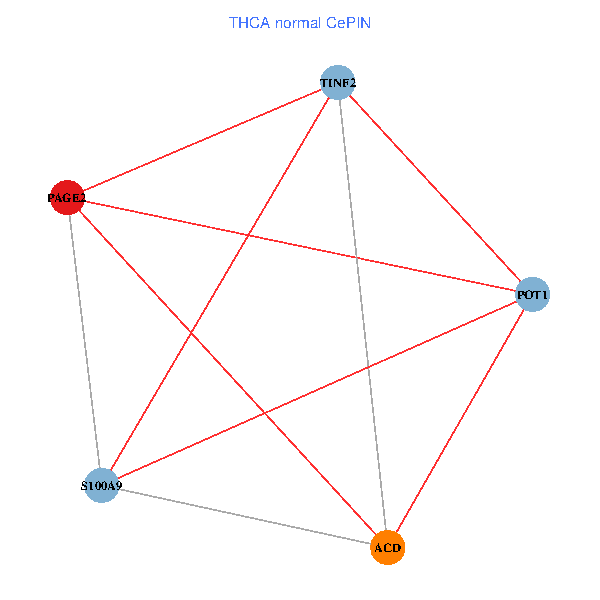
| Co-expressed gene networks based on protein-protein interaction data (CePIN) (TCGA IlluminaHiSeq_RNASeqV2, pan-cancer normalized log2(norm_counts+1) data, version 2016-08-16) (PINA2 ppi data) |
| BRCA (tumor) | BRCA (normal) |
| PAGE2, TINF2, S100A9, POT1, ACD (tumor) | PAGE2, TINF2, S100A9, POT1, ACD (normal) |
 |  |
| COAD (tumor) | COAD (normal) |
| PAGE2, TINF2, S100A9, POT1, ACD (tumor) | PAGE2, TINF2, S100A9, POT1, ACD (normal) |
 |  |
| HNSC (tumor) | HNSC (normal) |
| PAGE2, TINF2, S100A9, POT1, ACD (tumor) | PAGE2, TINF2, S100A9, POT1, ACD (normal) |
 |  |
| KICH (tumor) | KICH (normal) |
| PAGE2, TINF2, S100A9, POT1, ACD (tumor) | PAGE2, TINF2, S100A9, POT1, ACD (normal) |
 |  |
| KIRC (tumor) | KIRC (normal) |
| PAGE2, TINF2, S100A9, POT1, ACD (tumor) | PAGE2, TINF2, S100A9, POT1, ACD (normal) |
 |  |
| KIRP (tumor) | KIRP (normal) |
| PAGE2, TINF2, S100A9, POT1, ACD (tumor) | PAGE2, TINF2, S100A9, POT1, ACD (normal) |
 |  |
| LIHC (tumor) | LIHC (normal) |
| PAGE2, TINF2, S100A9, POT1, ACD (tumor) | PAGE2, TINF2, S100A9, POT1, ACD (normal) |
 |  |
| LUAD (tumor) | LUAD (normal) |
| PAGE2, TINF2, S100A9, POT1, ACD (tumor) | PAGE2, TINF2, S100A9, POT1, ACD (normal) |
 |  |
| LUSC (tumor) | LUSC (normal) |
| PAGE2, TINF2, S100A9, POT1, ACD (tumor) | PAGE2, TINF2, S100A9, POT1, ACD (normal) |
 |  |
| PRAD (tumor) | PRAD (normal) |
| PAGE2, TINF2, S100A9, POT1, ACD (tumor) | PAGE2, TINF2, S100A9, POT1, ACD (normal) |
 |  |
| STAD (tumor) | STAD (normal) |
| PAGE2, TINF2, S100A9, POT1, ACD (tumor) | PAGE2, TINF2, S100A9, POT1, ACD (normal) |
 |  |
| THCA (tumor) | THCA (normal) |
| PAGE2, TINF2, S100A9, POT1, ACD (tumor) | PAGE2, TINF2, S100A9, POT1, ACD (normal) |
 |  |
| Top |
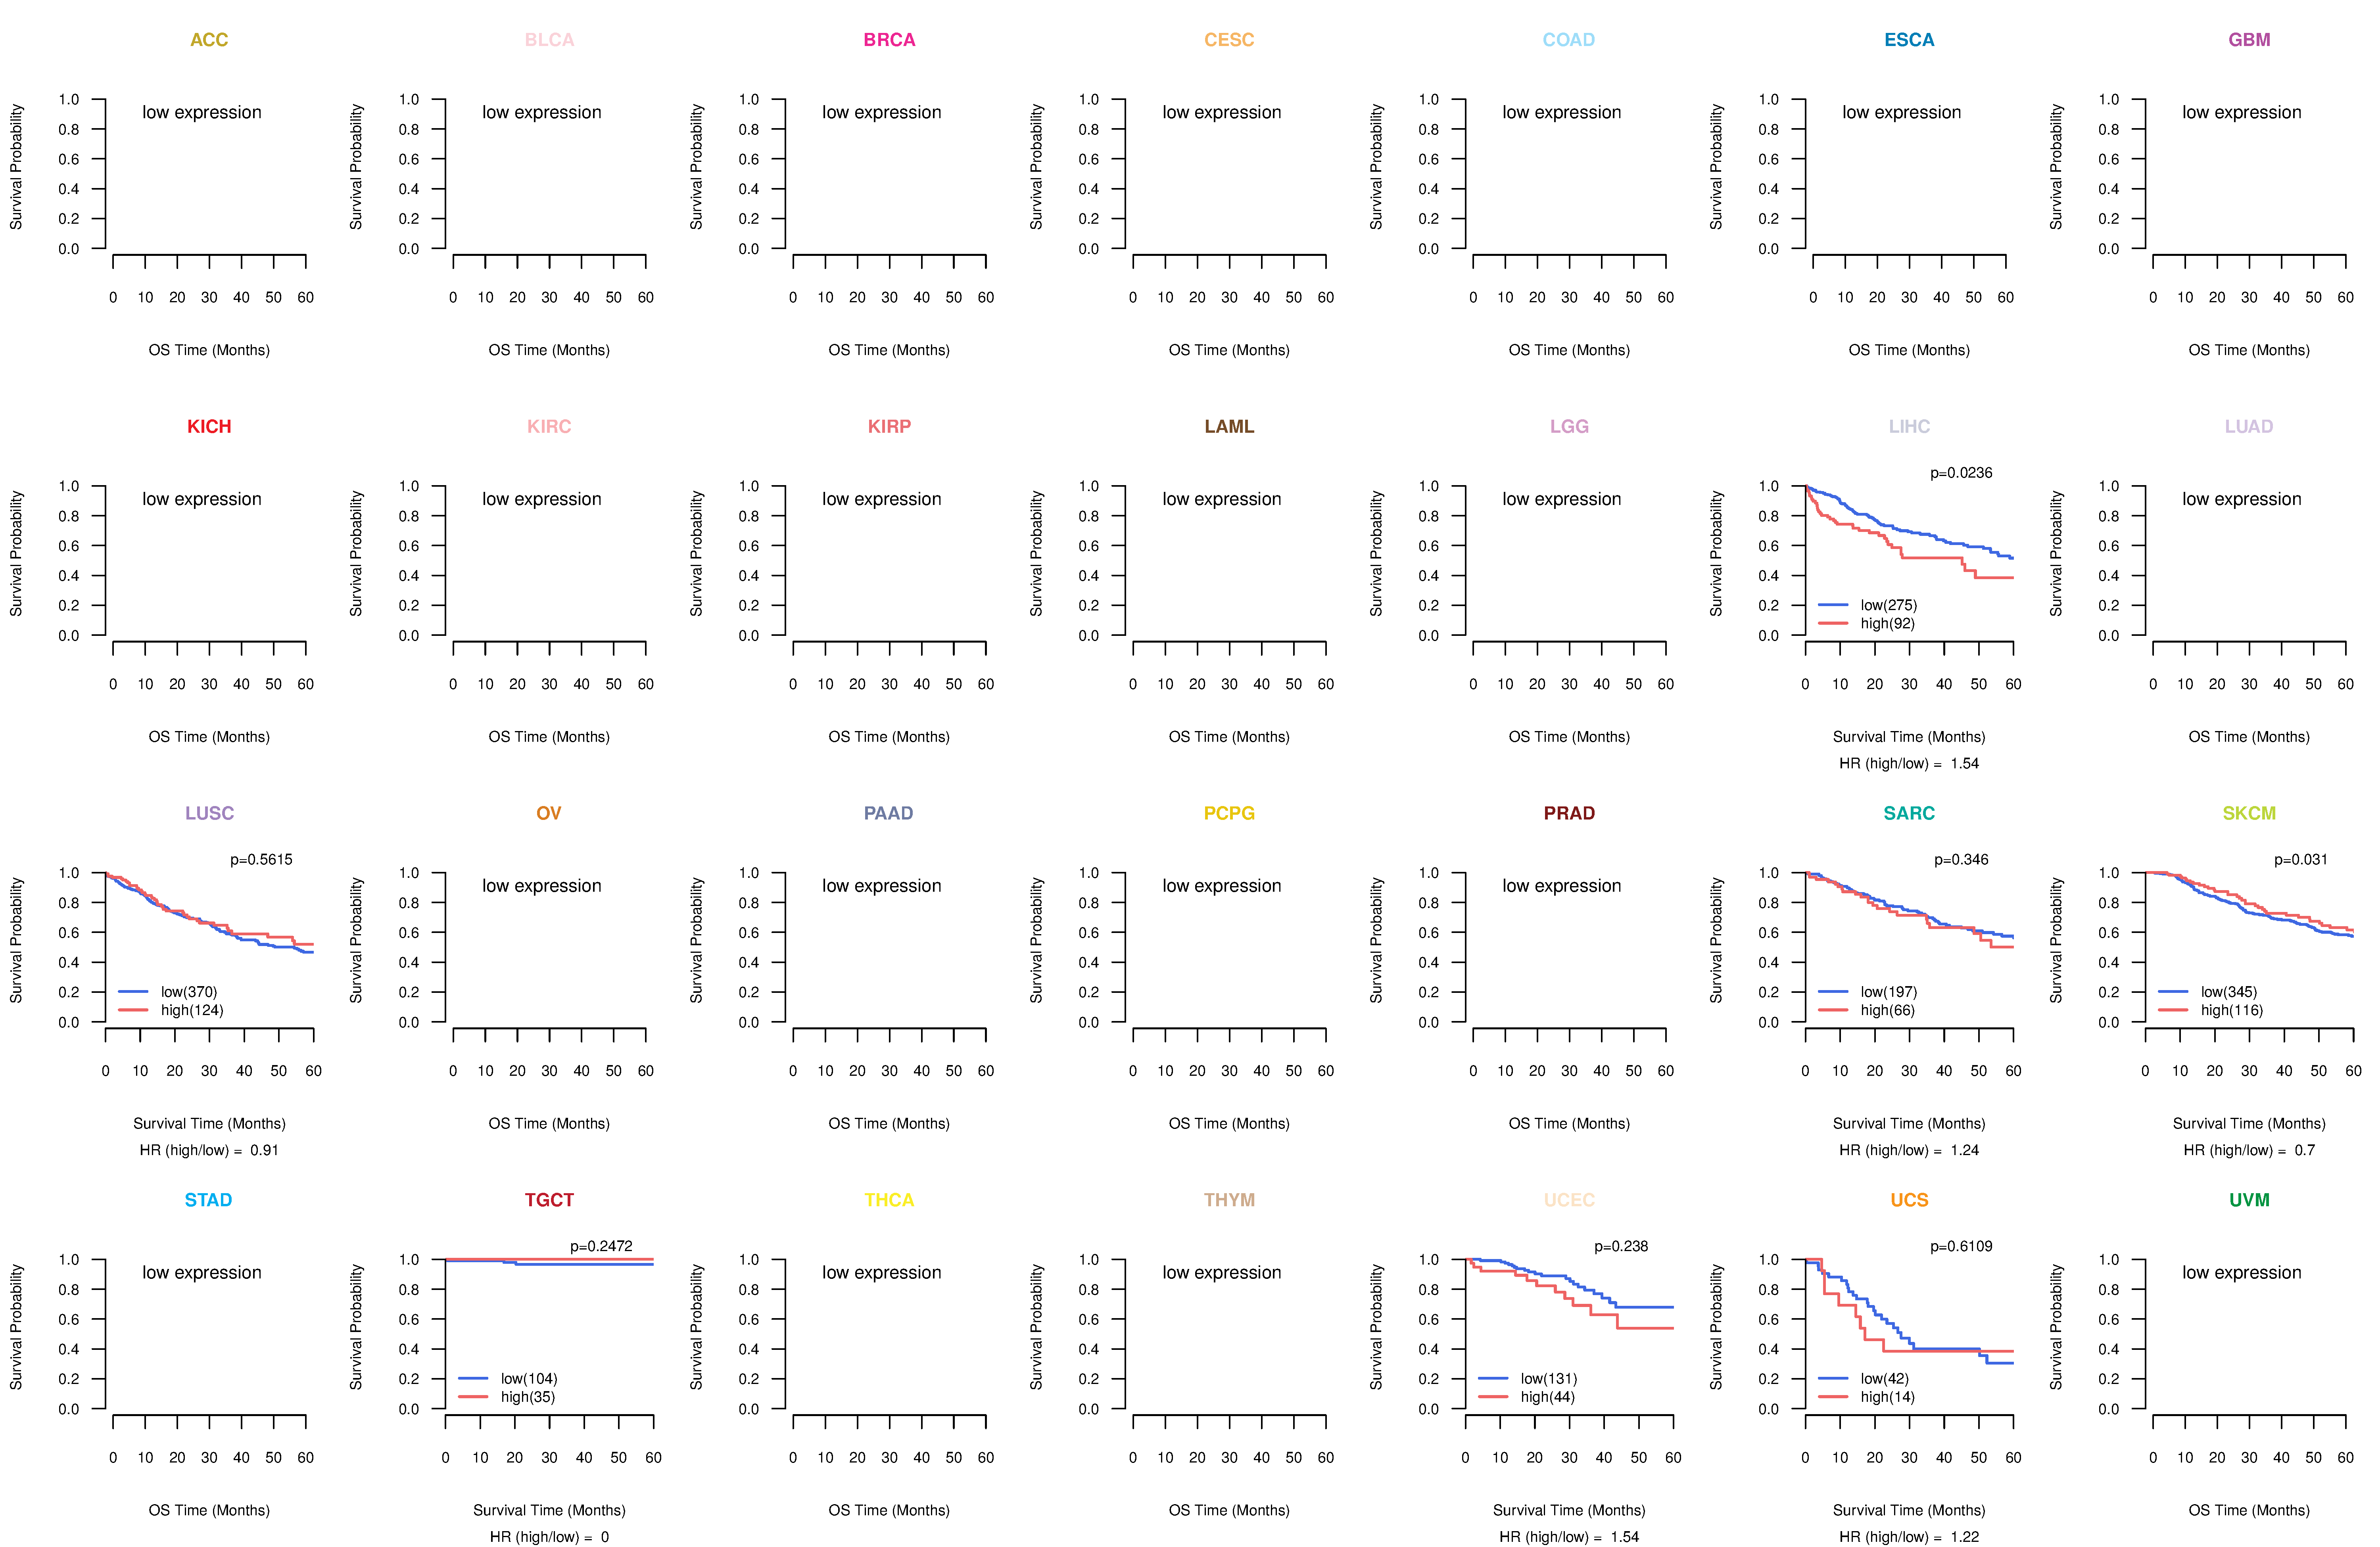
| TissGeneProg for PAGE2 |
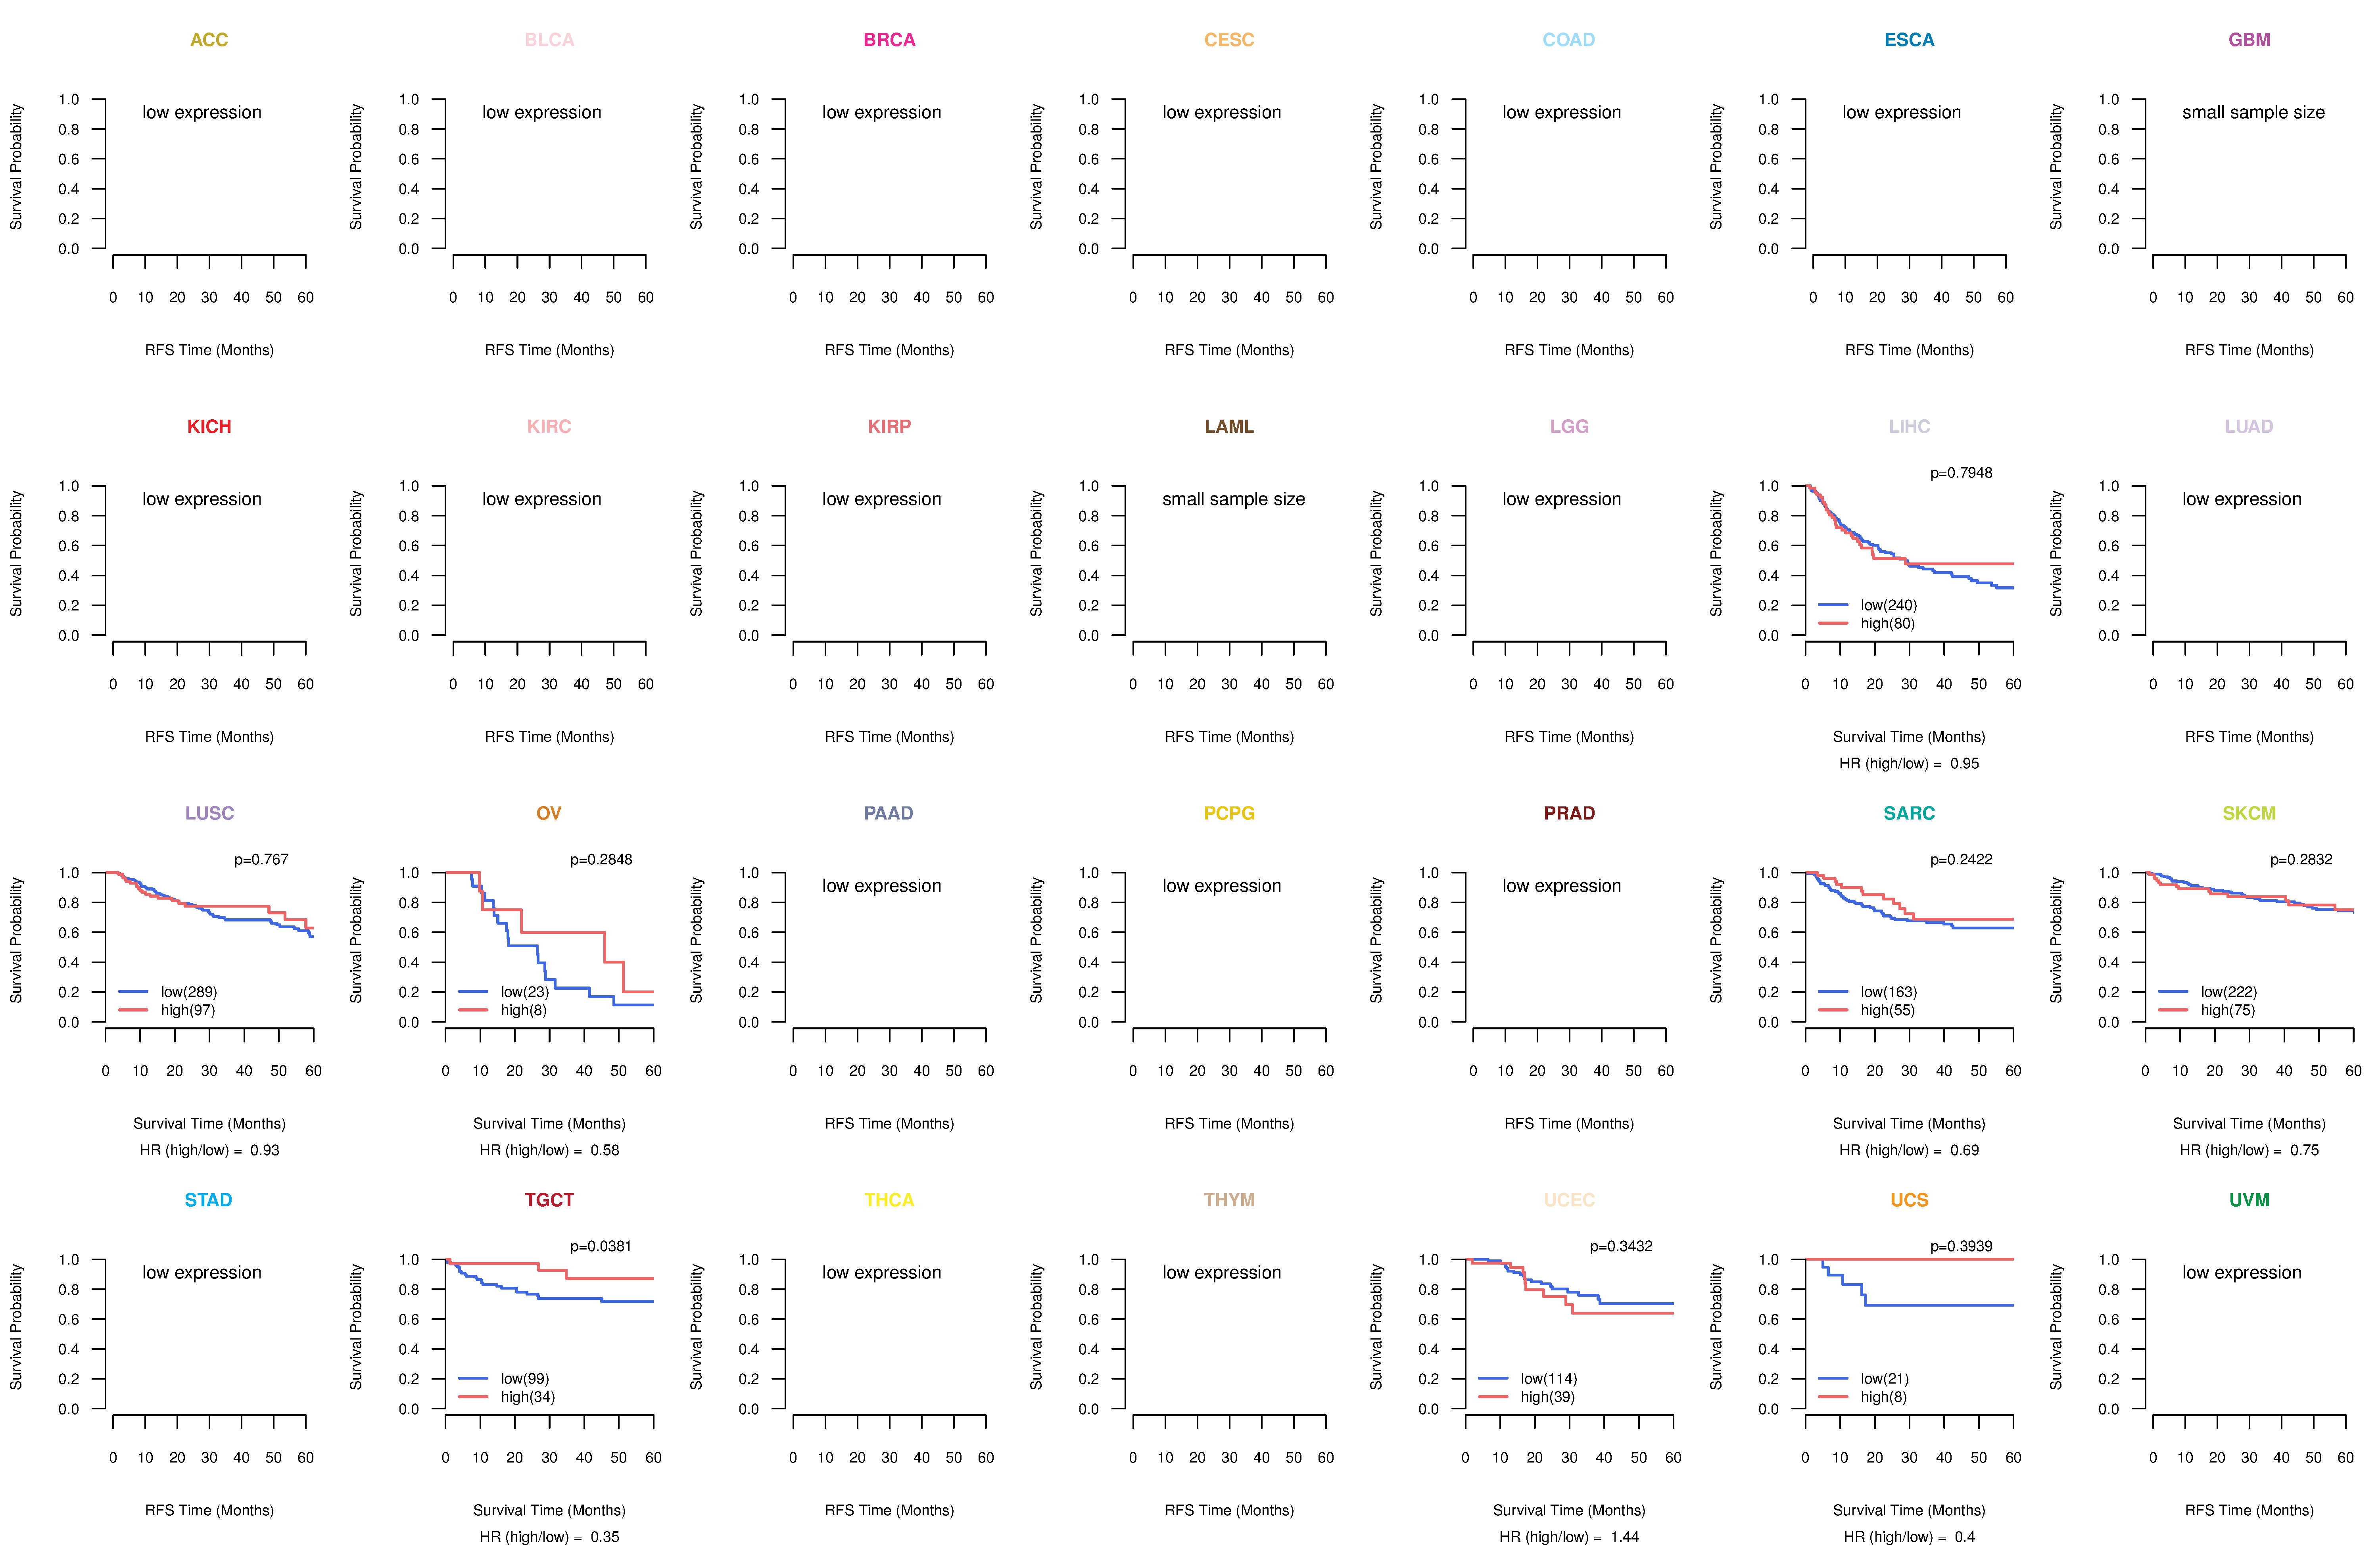
| Kaplan-Meier plots with logrank tests of overall survival (OS) using 28 cancer types (TCGA IlluminaHiSeq_RNASeqV2, pan-cancer normalized log2(norm_counts+1) data, version 2016-08-16) (TCGA clinicalMatrix, phenotype data, version 2016-04-27) * Click on the image to enlarge it in a new window. |
 |
| Kaplan-Meier plots with logrank test of relapse free survival (RFS) using 28 cancer types (TCGA IlluminaHiSeq_RNASeqV2, pan-cancer normalized log2(norm_counts+1) data, version 2016-08-16) (TCGA clinicalMatrix, phenotype data, version 2016-04-27) * Click on the image enlarge it in a new window. |
 |
| Forest plot of Cox proportional hazard ratio (HR) and 95% CI of overall survival (OS) using 28 cancer types (TCGA IlluminaHiSeq_RNASeqV2, pan-cancer normalized log2(norm_counts+1) data, version 2016-08-16) (TCGA clinicalMatrix, phenotype data, version 2016-04-27) * Click on the image enlarge it in a new window. |
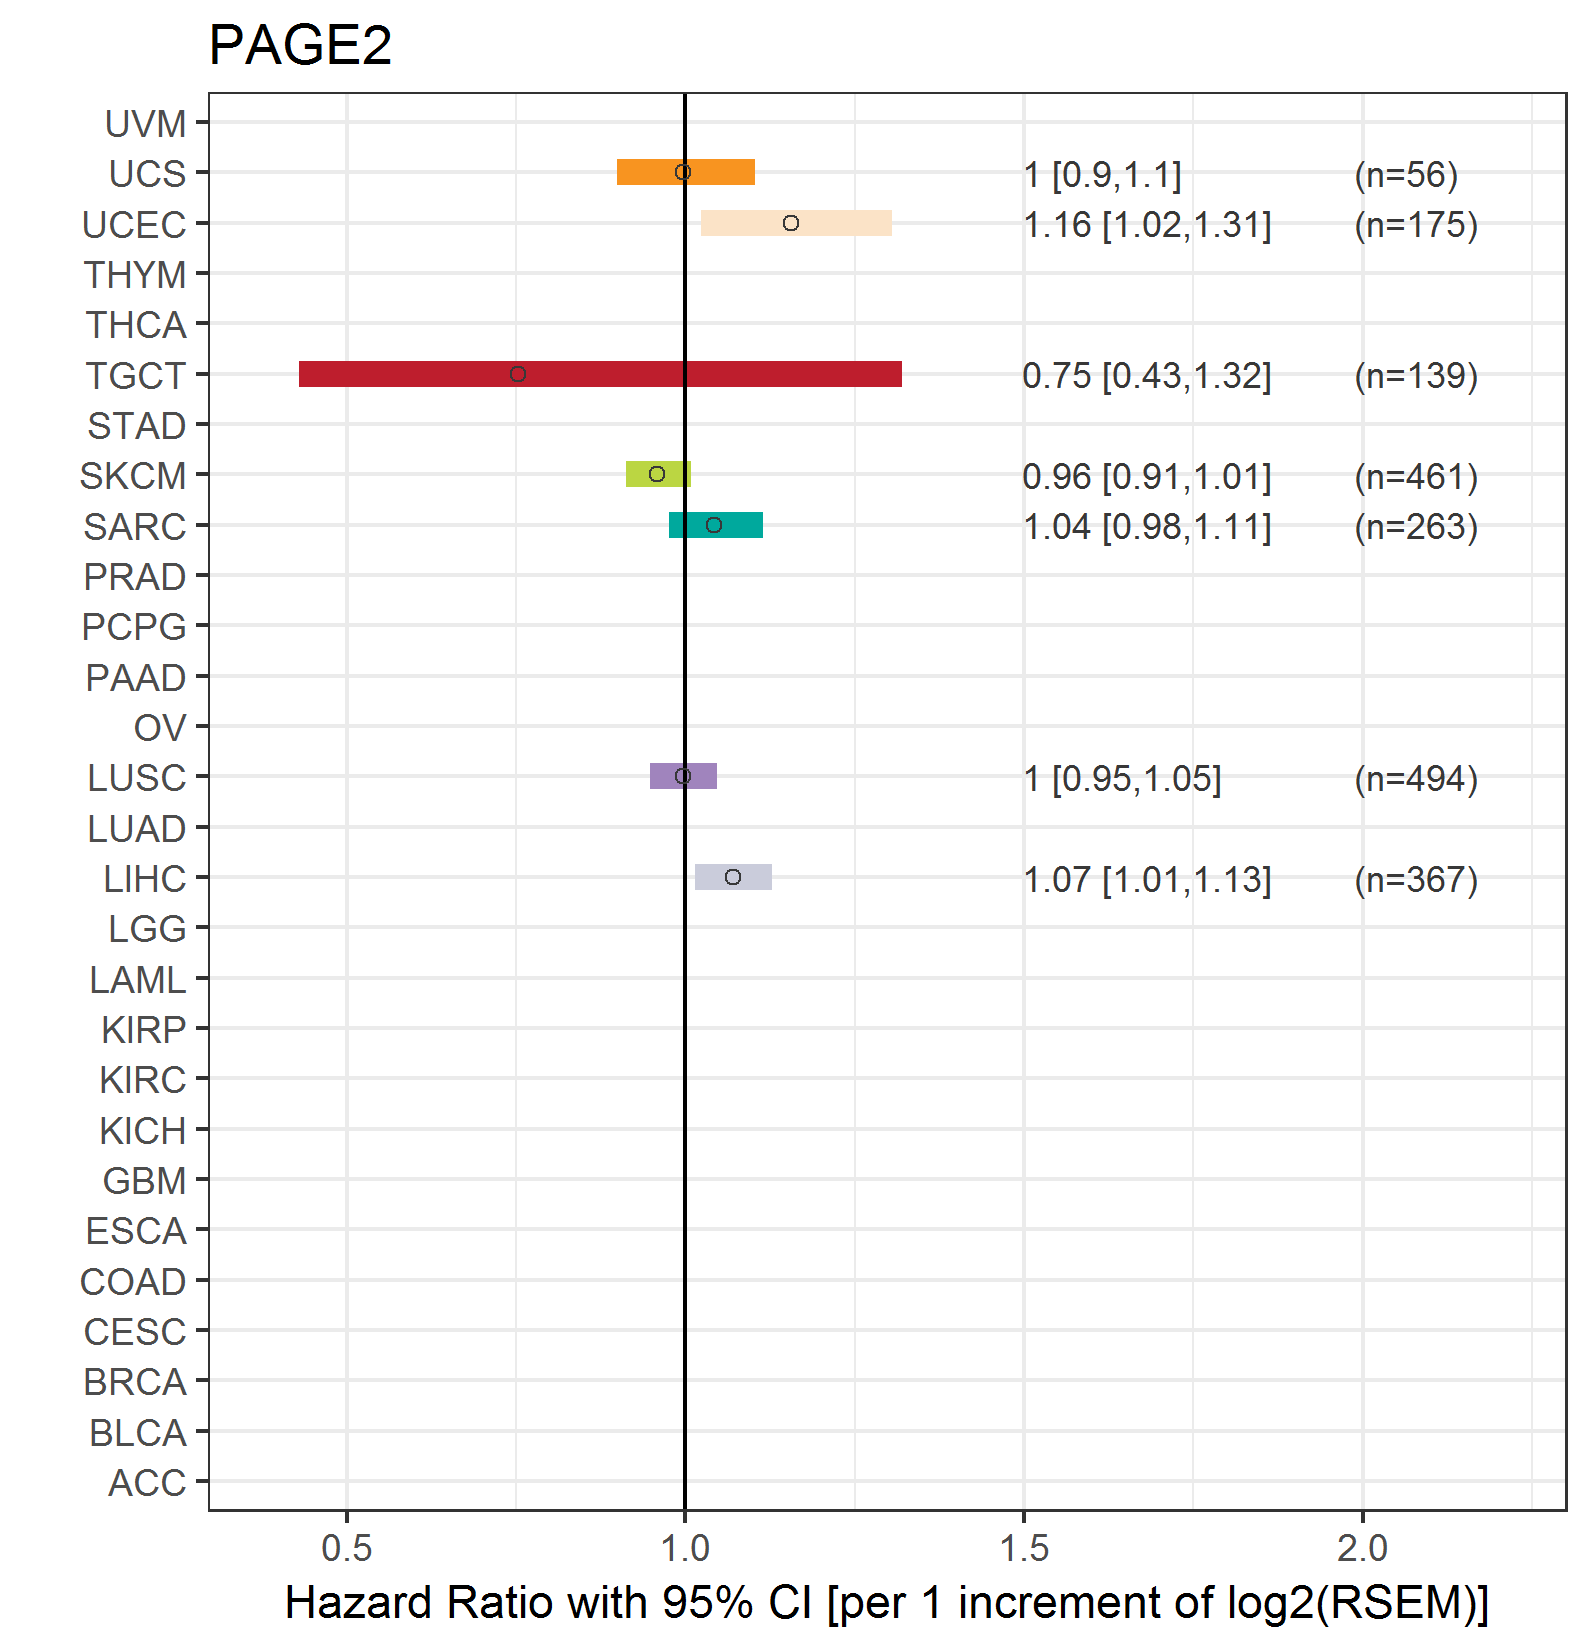 |
| Forest plot of Cox proportional hazard ratio (HR) and 95% CI of relapse free survival (RFS) using 28 cancer types (TCGA IlluminaHiSeq_RNASeqV2, pan-cancer normalized log2(norm_counts+1) data, version 2016-08-16) (TCGA clinicalMatrix, phenotype data, version 2016-04-27) * Click on the image enlarge it in a new window. |
 |
| Top |
| TissGeneClin for PAGE2 |
| TissGeneDrug for PAGE2 |
| Drug information targeting TissGene (DrugBank Version 5.0.6, 2017-04-01) |
| DrugBank ID | Drug name | Drug activity | Drug type | Drug status |
| Top |
| TissGeneDisease for PAGE2 |
| Disease information associated with TissGene (DisGeNet, 2016-06-01) |
| Disease ID | Disease name | # pubmeds | Source |
|
Copyright 2016-Present - The University of Texas Health Science Center at Houston (UTHealth) Web File Viewing | How to Report, Fraud, Waste and Abuse | State of Texas | Statewide Search | Texas Homeland Security | Site Policies |