 |
| |
| |
| |
| |
| |
| |
|

| TissGeneSummary for FABP1 |
 Gene summary Gene summary |
| Basic gene information | Gene symbol | FABP1 |
| Gene name | fatty acid binding protein 1, liver | |
| Synonyms | FABPL|L-FABP | |
| Cytomap | UCSC genome browser: 2p11 | |
| Type of gene | protein-coding | |
| RefGenes | NM_001443.2, | |
| Description | fatty acid-binding protein 1fatty acid-binding protein, liverliver-type fatty acid-binding protein | |
| Modification date | 20141207 | |
| dbXrefs | MIM : 134650 | |
| HGNC : HGNC | ||
| Ensembl : ENSG00000163586 | ||
| HPRD : 00612 | ||
| Vega : OTTHUMG00000130312 | ||
| Protein | UniProt: go to UniProt's Cross Reference DB Table | |
| Expression | CleanEX: HS_FABP1 | |
| BioGPS: 2168 | ||
| Pathway | NCI Pathway Interaction Database: FABP1 | |
| KEGG: FABP1 | ||
| REACTOME: FABP1 | ||
| Pathway Commons: FABP1 | ||
| Context | iHOP: FABP1 | |
| ligand binding site mutation search in PubMed: FABP1 | ||
| UCL Cancer Institute: FABP1 | ||
| Assigned class in TissGDB* | C | |
| Included tissue-specific gene expression resources | TiGER,GTEx | |
| Specific-tissues in normal samples (assigned by TissGDB using HPA, TiGER, and GTEx) | Liver | |
| Cancer types related to the specific-tissues in cancer samples (assigned by TissGDB using TCGA) | LIHC | |
| Reference showing the relevant tissue of FABP1 | ||
| Description by TissGene annotations | ||
| * Class A consists of genes with literature evidence and is part of the cTissGenes. Class B consists of only cTissGenes without additional evidence. The remaining genes belong to Class C. |
| Gene ontology having evidence of Inferred from Direct Assay (IDA) from Entrez |
| GO ID | GO term | PubMed ID | GO:0043066 | negative regulation of apoptotic process | 16175609 | GO:0043154 | negative regulation of cysteine-type endopeptidase activity involved in apoptotic process | 16175609 | GO:0070301 | cellular response to hydrogen peroxide | 16175609 | GO:0071456 | cellular response to hypoxia | 16175609 | GO:0043066 | negative regulation of apoptotic process | 16175609 | GO:0043154 | negative regulation of cysteine-type endopeptidase activity involved in apoptotic process | 16175609 | GO:0070301 | cellular response to hydrogen peroxide | 16175609 | GO:0071456 | cellular response to hypoxia | 16175609 |
| Top |
| TissGeneExp for FABP1 |
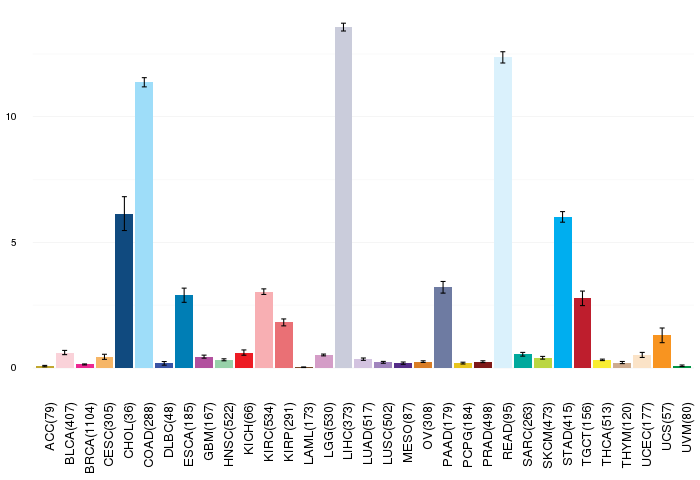
| Gene expressions across 28 cancer types (X-axis: cancer type and Y-axis: log2(norm_counts+1)) (TCGA IlluminaHiSeq_RNASeqV2, pan-cancer normalized log2(norm_counts+1) data, version 2016-08-16) |
 |
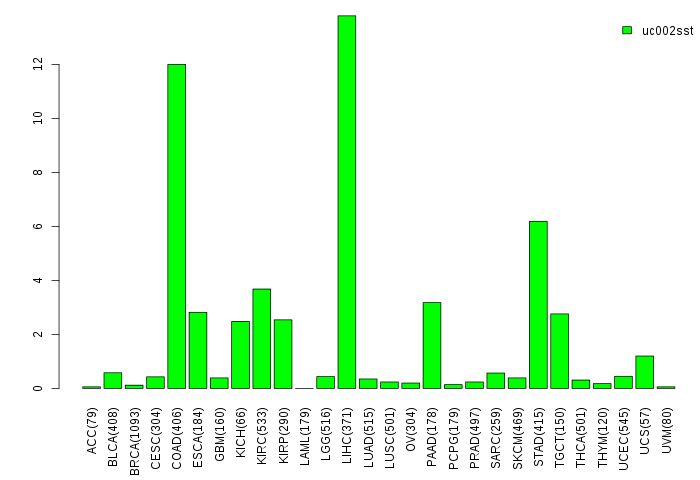
| Gene isoform expressions across 28 cancer types (X-axis: cancer type and Y-axis: log2(norm_counts+1)) (TCGA pan-cancer tcga_rsem_isoform_tpm, version 2016-09-01) |
 |
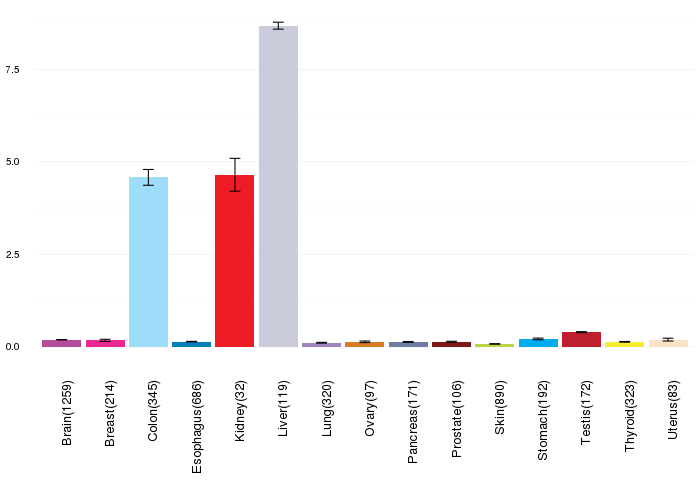
| Gene expressions across normal tissues of GTEx data (GTEx GTEx_Analysis_v6_RNA-seq_RNA-SeQCv1.1.8_gene_rpkm.gct) - Here, we shows the matched tissue types only among our 28 cancer types. |
 |
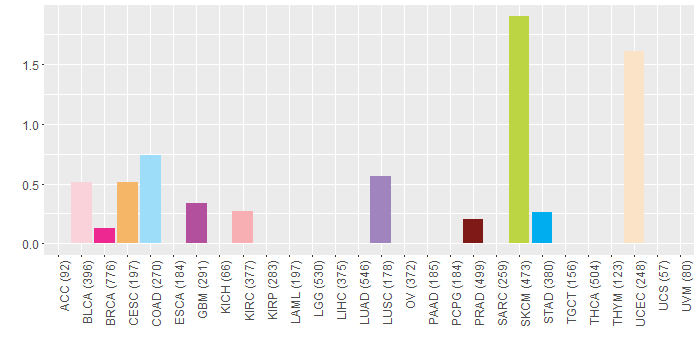
| Different expressions across 14 cancer types with more than 10 samples between matched tumors and normals (X-axis: cancer type and Y-axis: log2(norm_counts+1)) (TCGA IlluminaHiSeq_RNASeqV2, pan-cancer normalized log2(norm_counts+1) data, version 2016-08-16) |
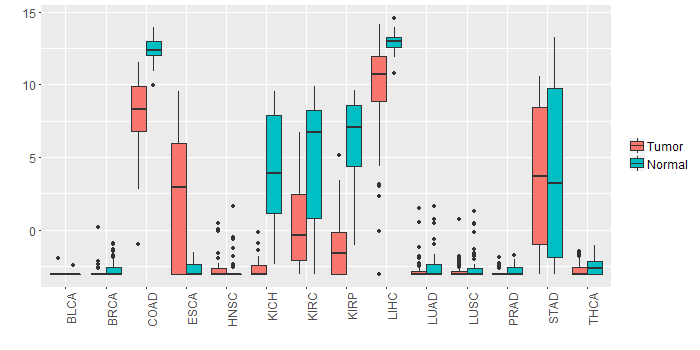 |
| - Significantly differentially expressed cancer types and information. (|Fold change|>1 and FDR<0.05) |
| Cancer type | Mean(exp) in tumor | Mean(exp) in matched normal | Log2FC | P-val. | FDR |
| KIRC | 0.308900315 | 4.804944759 | -4.496044444 | 2.17E-12 | 9.02E-12 |
| KIRP | -1.18360663 | 5.980608995 | -7.164215625 | 2.98E-14 | 6.96E-13 |
| COAD | 7.934661639 | 12.40436164 | -4.4697 | 4.44E-09 | 4.34E-08 |
| KICH | -2.56077313 | 4.12266287 | -6.683436 | 2.50E-09 | 1.45E-08 |
| LIHC | 9.63424687 | 12.92616287 | -3.291916 | 1.49E-07 | 1.01E-06 |
| Top |
| TissGene-miRNA for FABP1 |
| Significantly anti-correlated miRNAs of TissGene across 28 cancer types (Gene-miRNA relations from TargetScanHuman Relsease 7.1, Conserved_Site_Context_Scores.txt.zip, 06.01.2016) (TCGA IlluminaHiSeq_miRNASeq, log2(RPM+1) data, version 2016-11-21) (TCGA IlluminaHiSeq_RNASeqV2, log2(normalized_count+1) data, version 2016-08-16) (Spearman’s Rank Correlation (p-value<0.05 and coefficient<-0.25)) |
| Cancer type | miRNA id | miRNA accession | P-val. | Coeff. | # samples |
| Top |
| TissGeneMut for FABP1 |
| TissGeneSNV for FABP1 |
| nsSNV counts per each loci. Different colors of circles represent different cancer types. Circle size denotes number of samples. (TCGA somatic mutation (SNPs and small INDELs) data, version 2016-04-25) * Click on the image to enlarge it in a new window. |
 |
| Somatic nucleotide variants of TissGene across 28 cancer types (X-axis: cancer type and Y-axis: % of mutated samples) The numbers in parentheses are numbers of samples with mutation (nsSNVs). (TCGA somatic mutation (SNPs and small INDELs) data, version 2016-04-25) |
 |
| - nsSNVs sorted by frequency. |
| AAchange | Cancer type | # samples |
| p.E62K | SKCM | 4 |
| p.F95L | BLCA | 1 |
| p.L91M | READ | 1 |
| p.S39L | GBM | 1 |
| p.R126K | SKCM | 1 |
| p.E27* | UCEC | 1 |
| p.G23_splice | LUSC | 1 |
| p.G66W | PRAD | 1 |
| p.I98T | UCEC | 1 |
| p.E26K | SKCM | 1 |
| p.K90Q | COAD | 1 |
| p.L24M | UCEC | 1 |
| p.G76E | BRCA | 1 |
| p.T102I | SKCM | 1 |
| p.S4F | HNSC | 1 |
| p.E103K | BLCA | 1 |
| p.E68K | SKCM | 1 |
| p.M1I | CESC | 1 |
| p.E40K | HNSC | 1 |
| p.E67D | COAD | 1 |
| p.Q60E | KIRC | 1 |
| p.D107N | UCEC | 1 |
| p.F15L | STAD | 1 |
| p.G32E | SKCM | 1 |
| Top |
| TissGeneCNV for FABP1 |
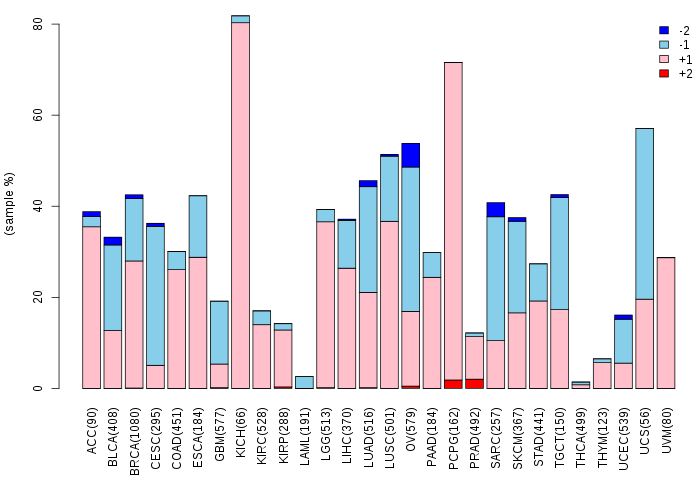
| Copy number variations of TissGene across 28 cancer types (X-axis: cancer type and Y-axis: % of CNV samples) (TCGA Gistic2_CopyNumber_Gistic2_all_data_by_genes, Gistic2 copy number data, version 2016-08-16) |
 |
| Top |
| TissGeneFusions for FABP1 |
| Fusion genes including TissGene (ChimerDB 3.0, 2016-12-01 and TCGA fusion Portal 2015-12-01) |
| Database | Src | Cancer type | Sample | Fusion gene | ORF | 5'-gene BP | 3'-gene BP |
| Chimerdb3.0 | ChiTaRs | NA | AI114691 | GOT1-FABP1 | chr10:101190377 | chr2:88424050 | |
| Chimerdb3.0 | ChiTaRs | NA | CB163566 | FABP1-FABP1 | chr2:88427473 | chr2:88422552 | |
| Chimerdb3.0 | ChiTaRs | NA | AK000234 | PRDM10-FABP1 | chr11:129812485 | chr2:88422501 |
| Top |
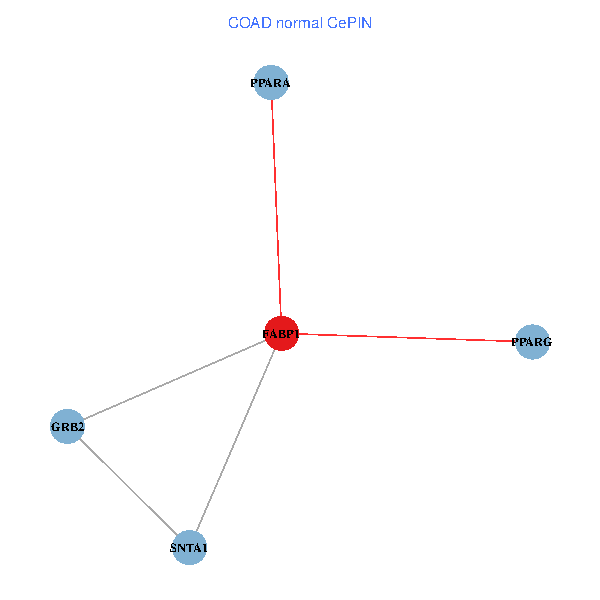
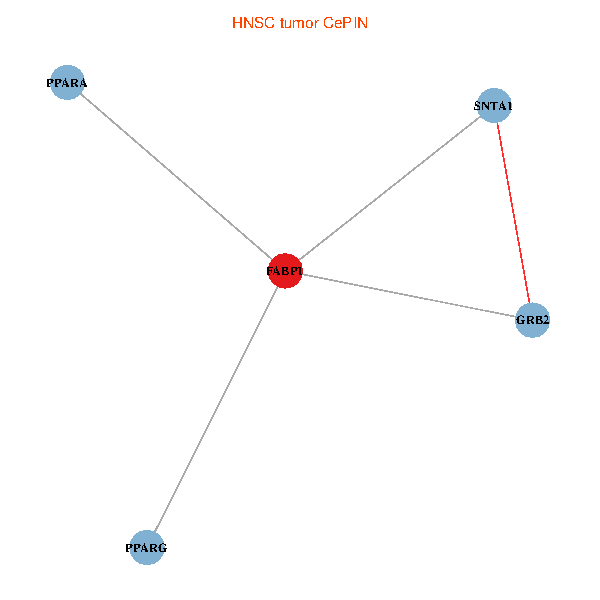
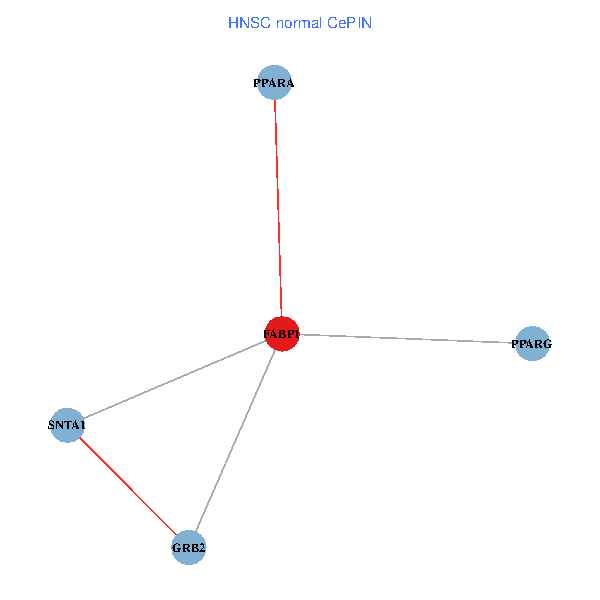
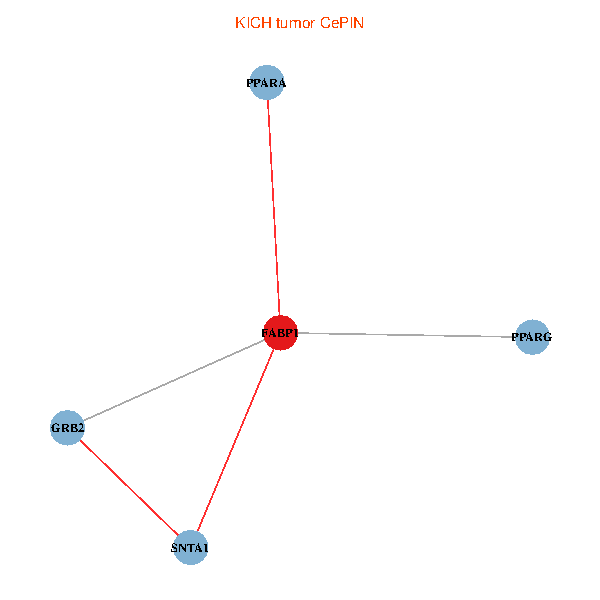
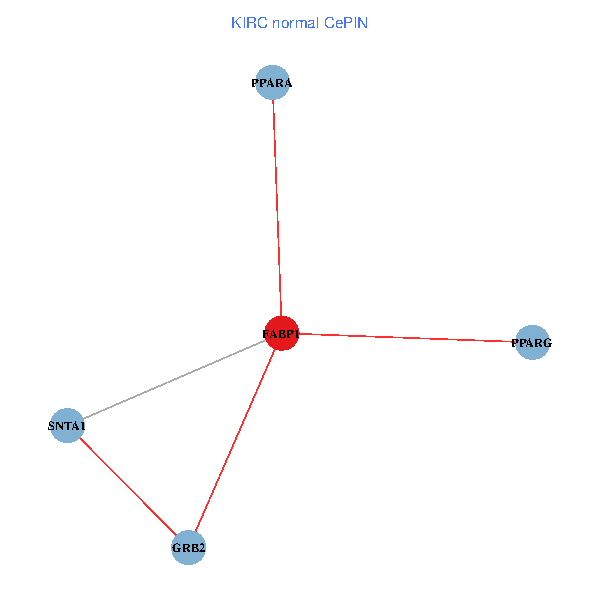
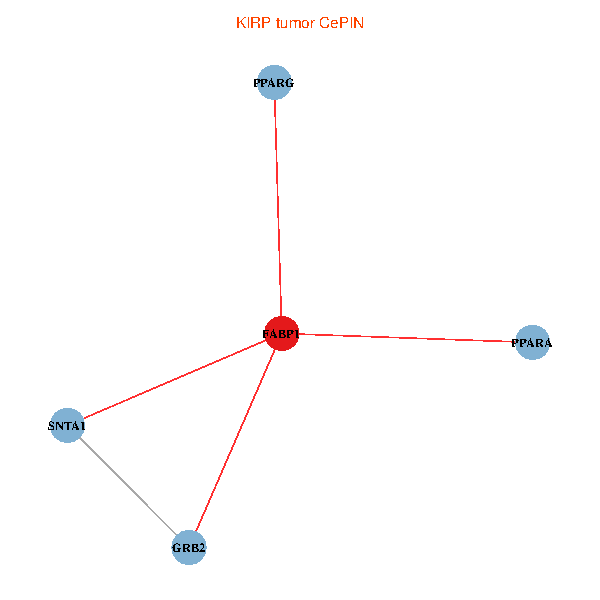
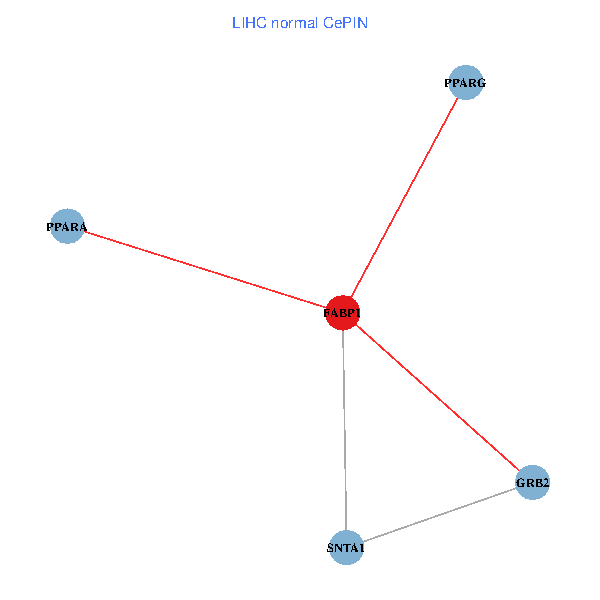
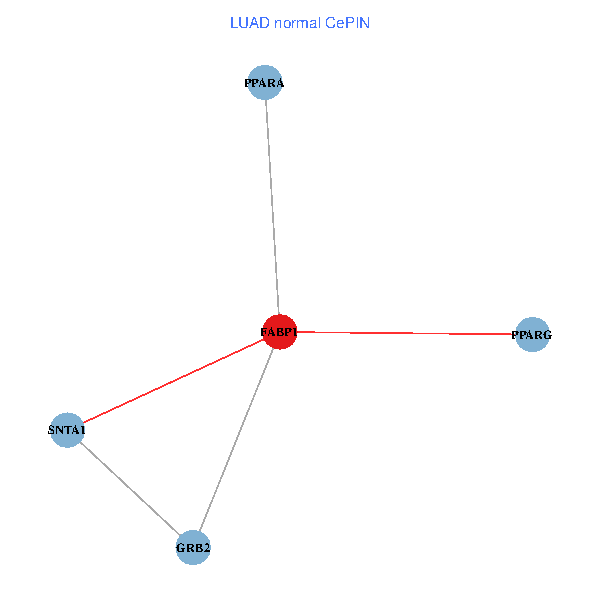
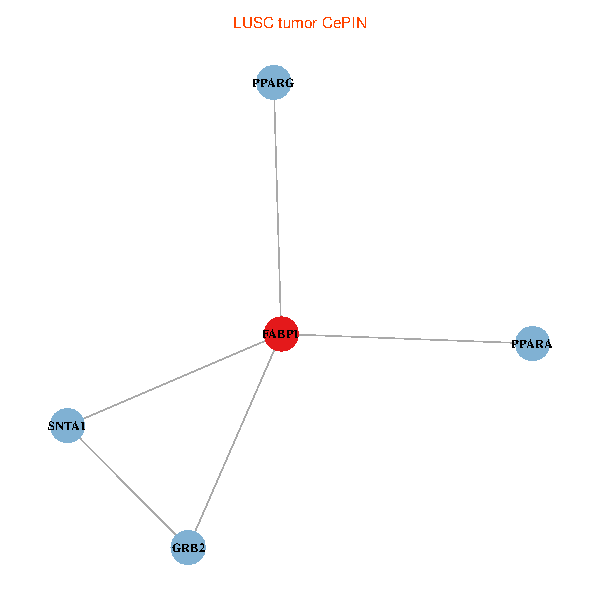
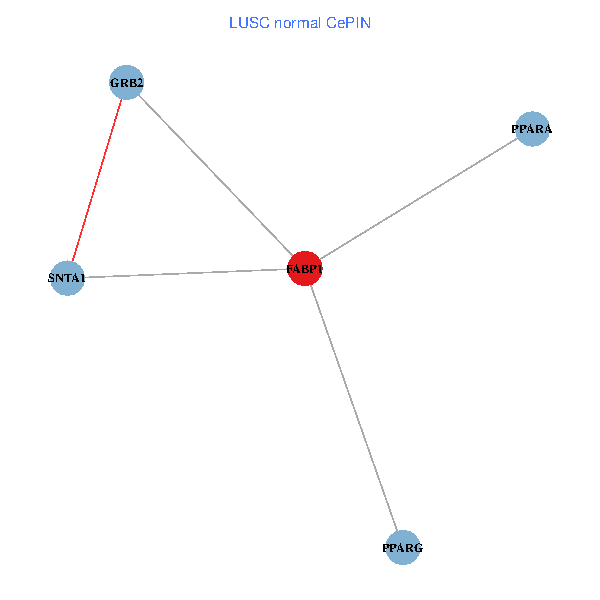
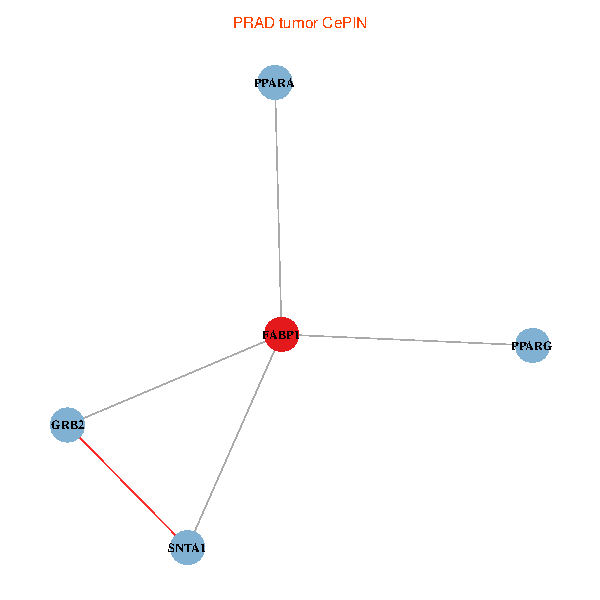
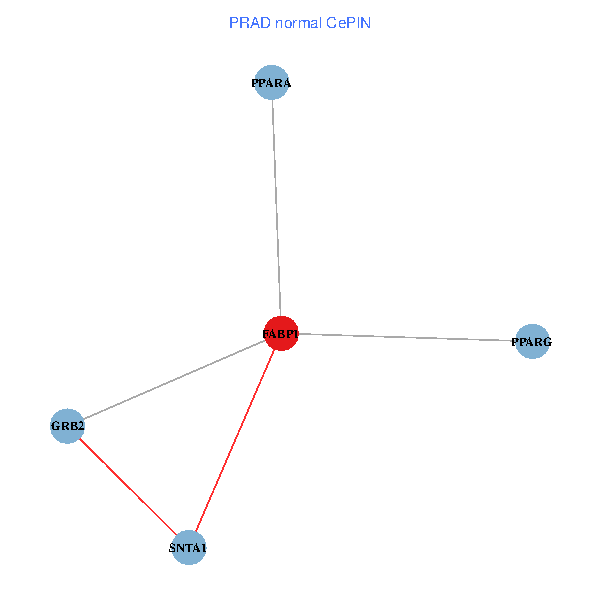
| TissGeneNet for FABP1 |
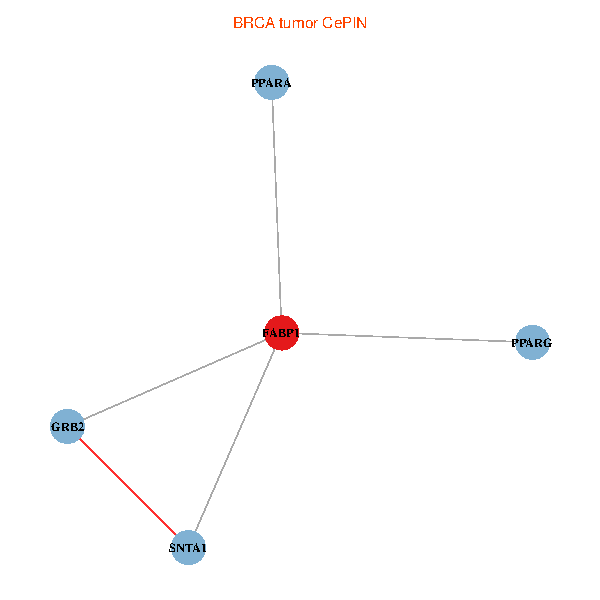
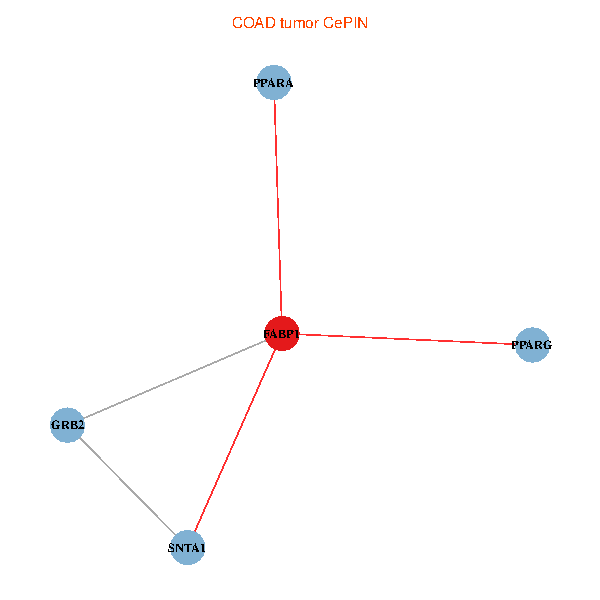
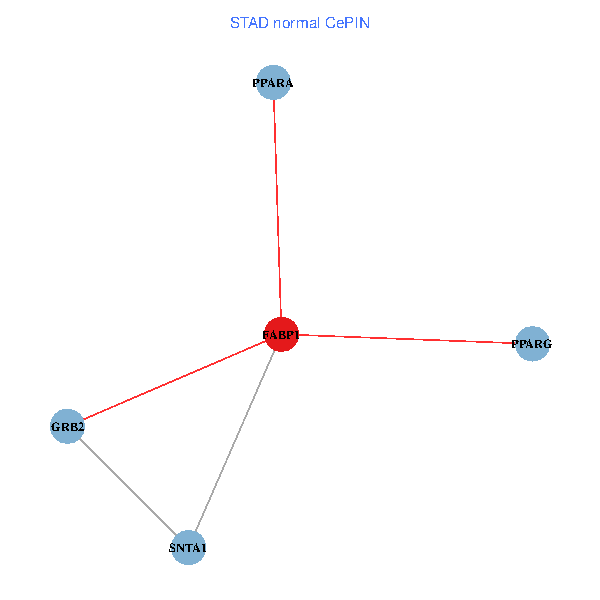
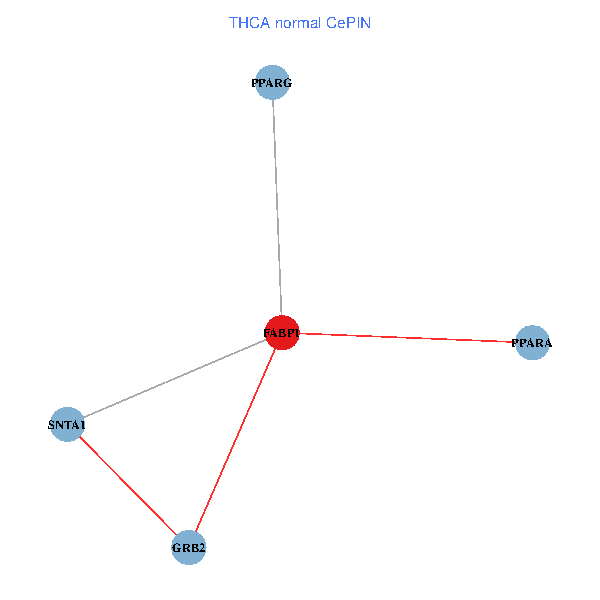
| Co-expressed gene networks based on protein-protein interaction data (CePIN) (TCGA IlluminaHiSeq_RNASeqV2, pan-cancer normalized log2(norm_counts+1) data, version 2016-08-16) (PINA2 ppi data) |
| BRCA (tumor) | BRCA (normal) |
| FABP1, GRB2, PPARG, PPARA, SNTA1 (tumor) | FABP1, GRB2, PPARG, PPARA, SNTA1 (normal) |
 |  |
| COAD (tumor) | COAD (normal) |
| FABP1, GRB2, PPARG, PPARA, SNTA1 (tumor) | FABP1, GRB2, PPARG, PPARA, SNTA1 (normal) |
 |  |
| HNSC (tumor) | HNSC (normal) |
| FABP1, GRB2, PPARG, PPARA, SNTA1 (tumor) | FABP1, GRB2, PPARG, PPARA, SNTA1 (normal) |
 |  |
| KICH (tumor) | KICH (normal) |
| FABP1, GRB2, PPARG, PPARA, SNTA1 (tumor) | FABP1, GRB2, PPARG, PPARA, SNTA1 (normal) |
 |  |
| KIRC (tumor) | KIRC (normal) |
| FABP1, GRB2, PPARG, PPARA, SNTA1 (tumor) | FABP1, GRB2, PPARG, PPARA, SNTA1 (normal) |
 |  |
| KIRP (tumor) | KIRP (normal) |
| FABP1, GRB2, PPARG, PPARA, SNTA1 (tumor) | FABP1, GRB2, PPARG, PPARA, SNTA1 (normal) |
 |  |
| LIHC (tumor) | LIHC (normal) |
| FABP1, GRB2, PPARG, PPARA, SNTA1 (tumor) | FABP1, GRB2, PPARG, PPARA, SNTA1 (normal) |
 |  |
| LUAD (tumor) | LUAD (normal) |
| FABP1, GRB2, PPARG, PPARA, SNTA1 (tumor) | FABP1, GRB2, PPARG, PPARA, SNTA1 (normal) |
 |  |
| LUSC (tumor) | LUSC (normal) |
| FABP1, GRB2, PPARG, PPARA, SNTA1 (tumor) | FABP1, GRB2, PPARG, PPARA, SNTA1 (normal) |
 |  |
| PRAD (tumor) | PRAD (normal) |
| FABP1, GRB2, PPARG, PPARA, SNTA1 (tumor) | FABP1, GRB2, PPARG, PPARA, SNTA1 (normal) |
 |  |
| STAD (tumor) | STAD (normal) |
| FABP1, GRB2, PPARG, PPARA, SNTA1 (tumor) | FABP1, GRB2, PPARG, PPARA, SNTA1 (normal) |
 |  |
| THCA (tumor) | THCA (normal) |
| FABP1, GRB2, PPARG, PPARA, SNTA1 (tumor) | FABP1, GRB2, PPARG, PPARA, SNTA1 (normal) |
 |  |
| Top |
| TissGeneProg for FABP1 |
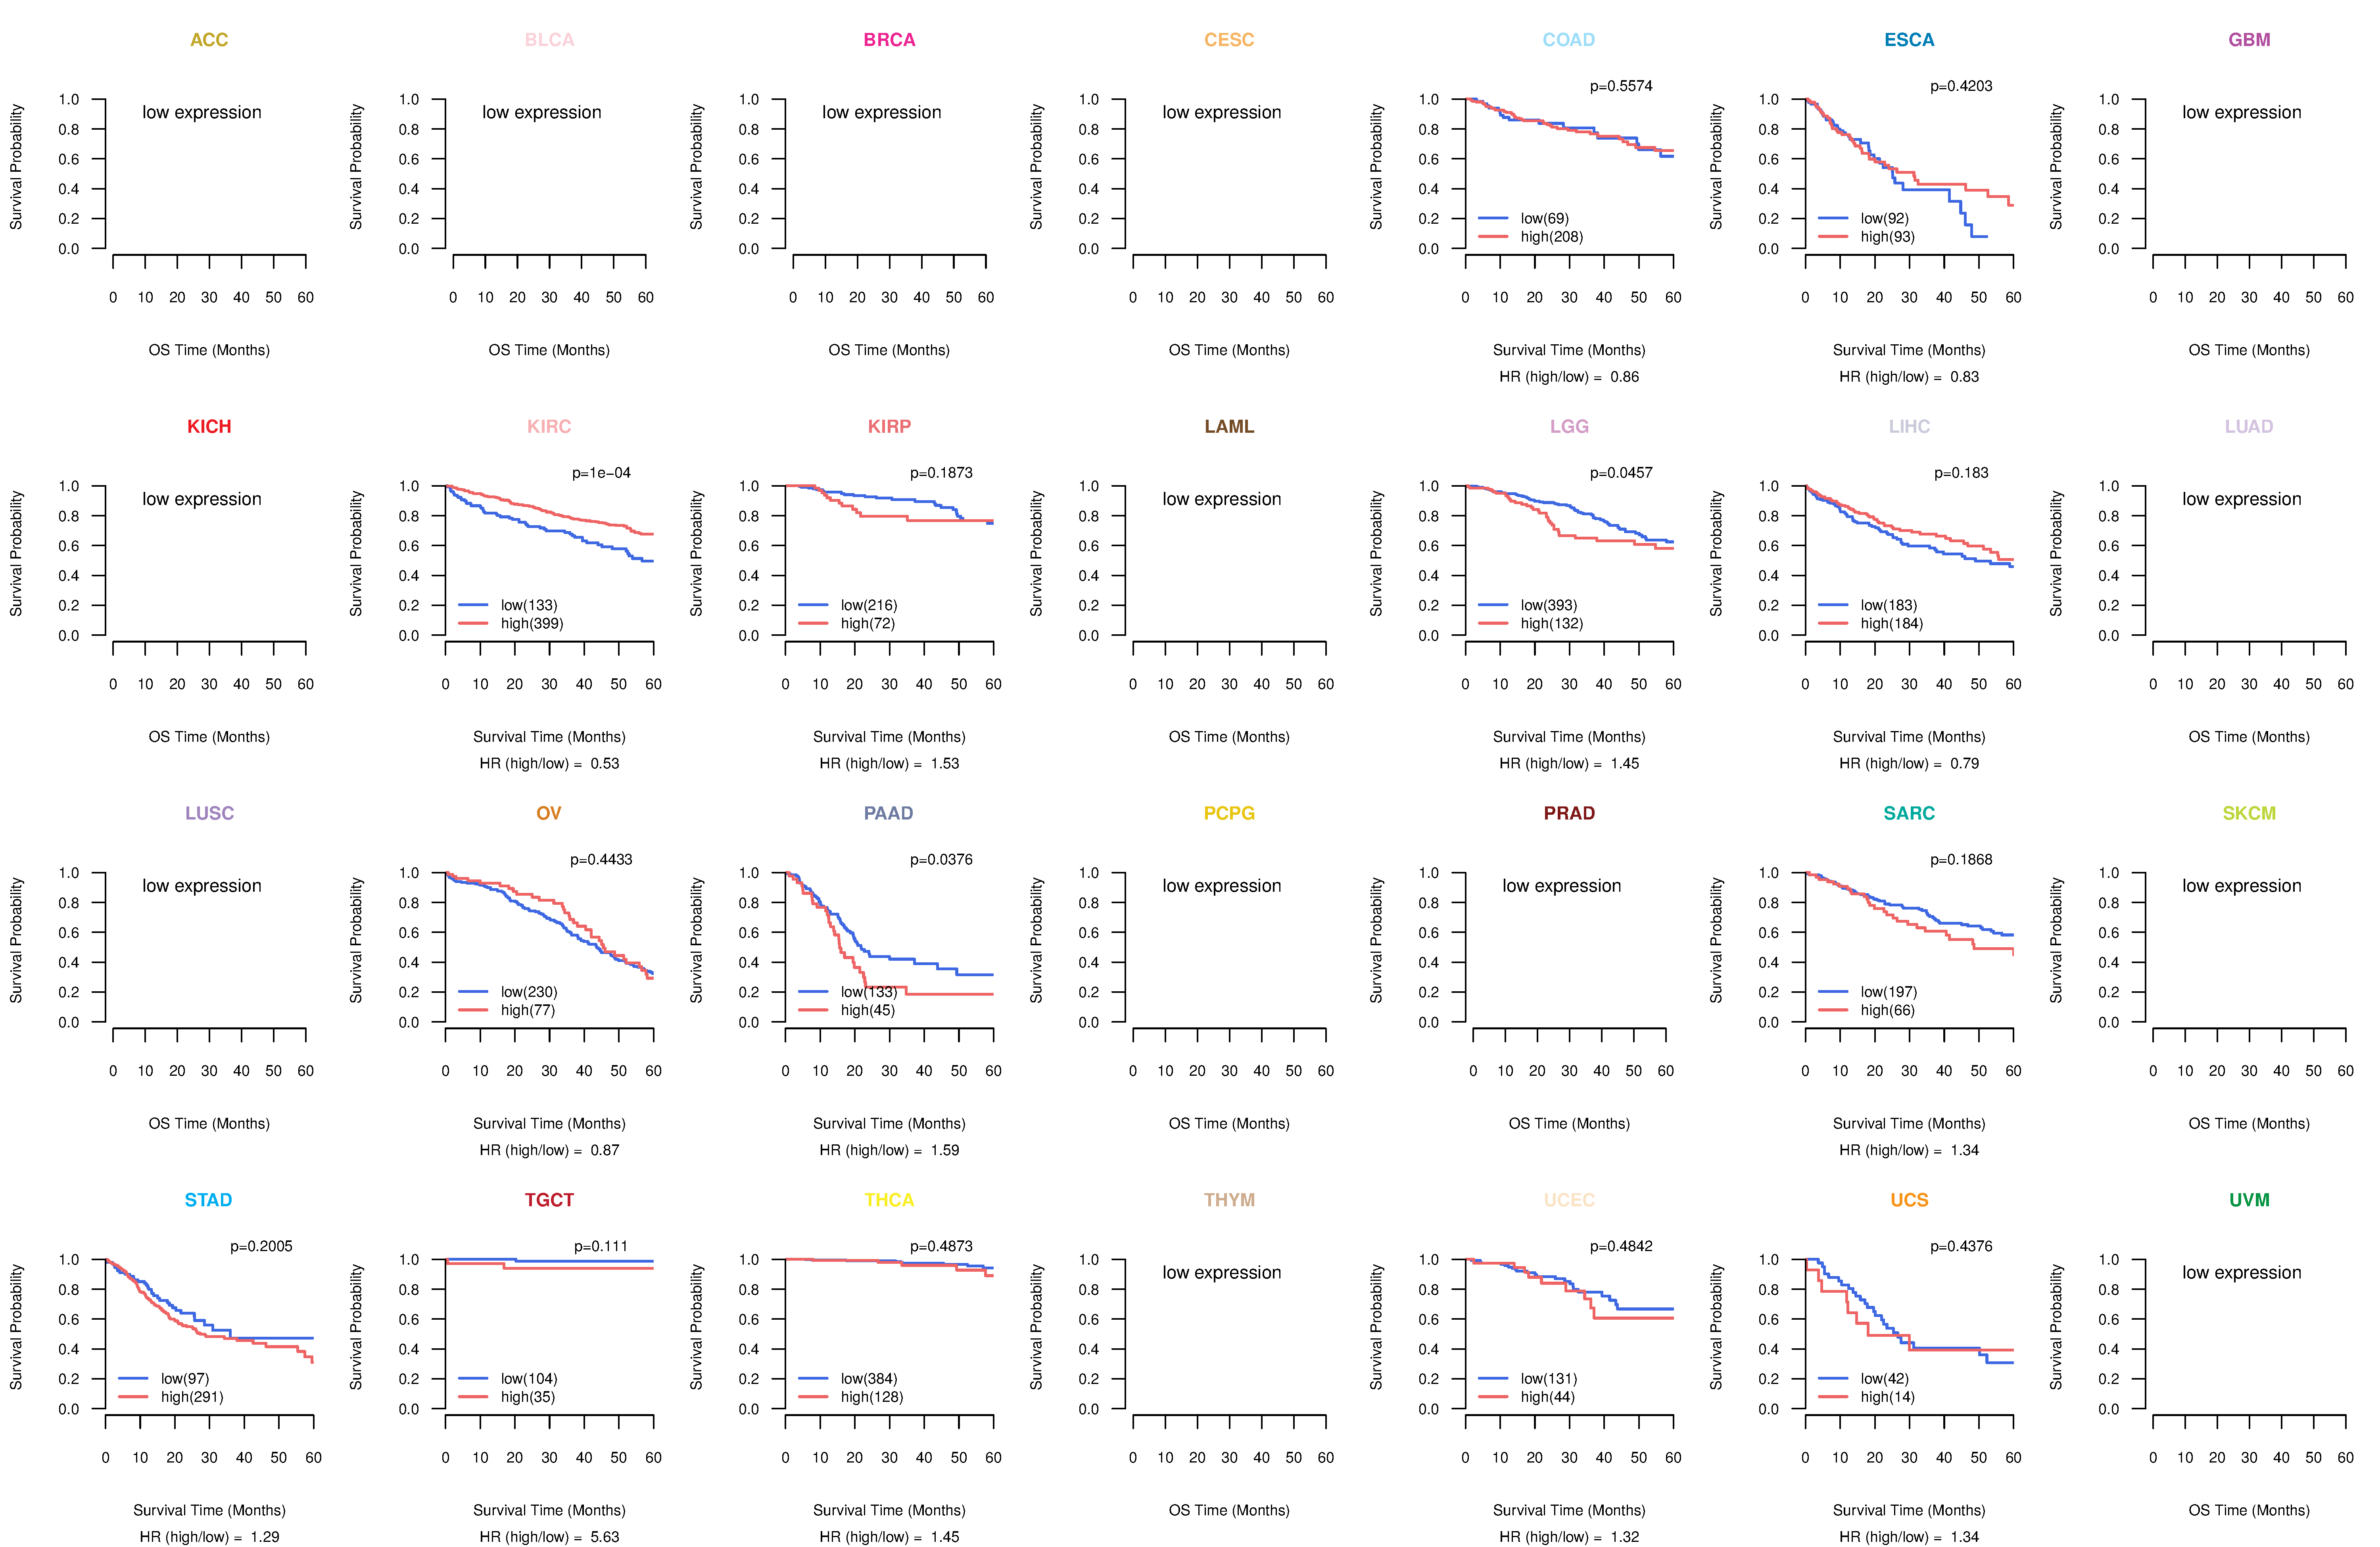
| Kaplan-Meier plots with logrank tests of overall survival (OS) using 28 cancer types (TCGA IlluminaHiSeq_RNASeqV2, pan-cancer normalized log2(norm_counts+1) data, version 2016-08-16) (TCGA clinicalMatrix, phenotype data, version 2016-04-27) * Click on the image to enlarge it in a new window. |
 |
| Kaplan-Meier plots with logrank test of relapse free survival (RFS) using 28 cancer types (TCGA IlluminaHiSeq_RNASeqV2, pan-cancer normalized log2(norm_counts+1) data, version 2016-08-16) (TCGA clinicalMatrix, phenotype data, version 2016-04-27) * Click on the image enlarge it in a new window. |
 |
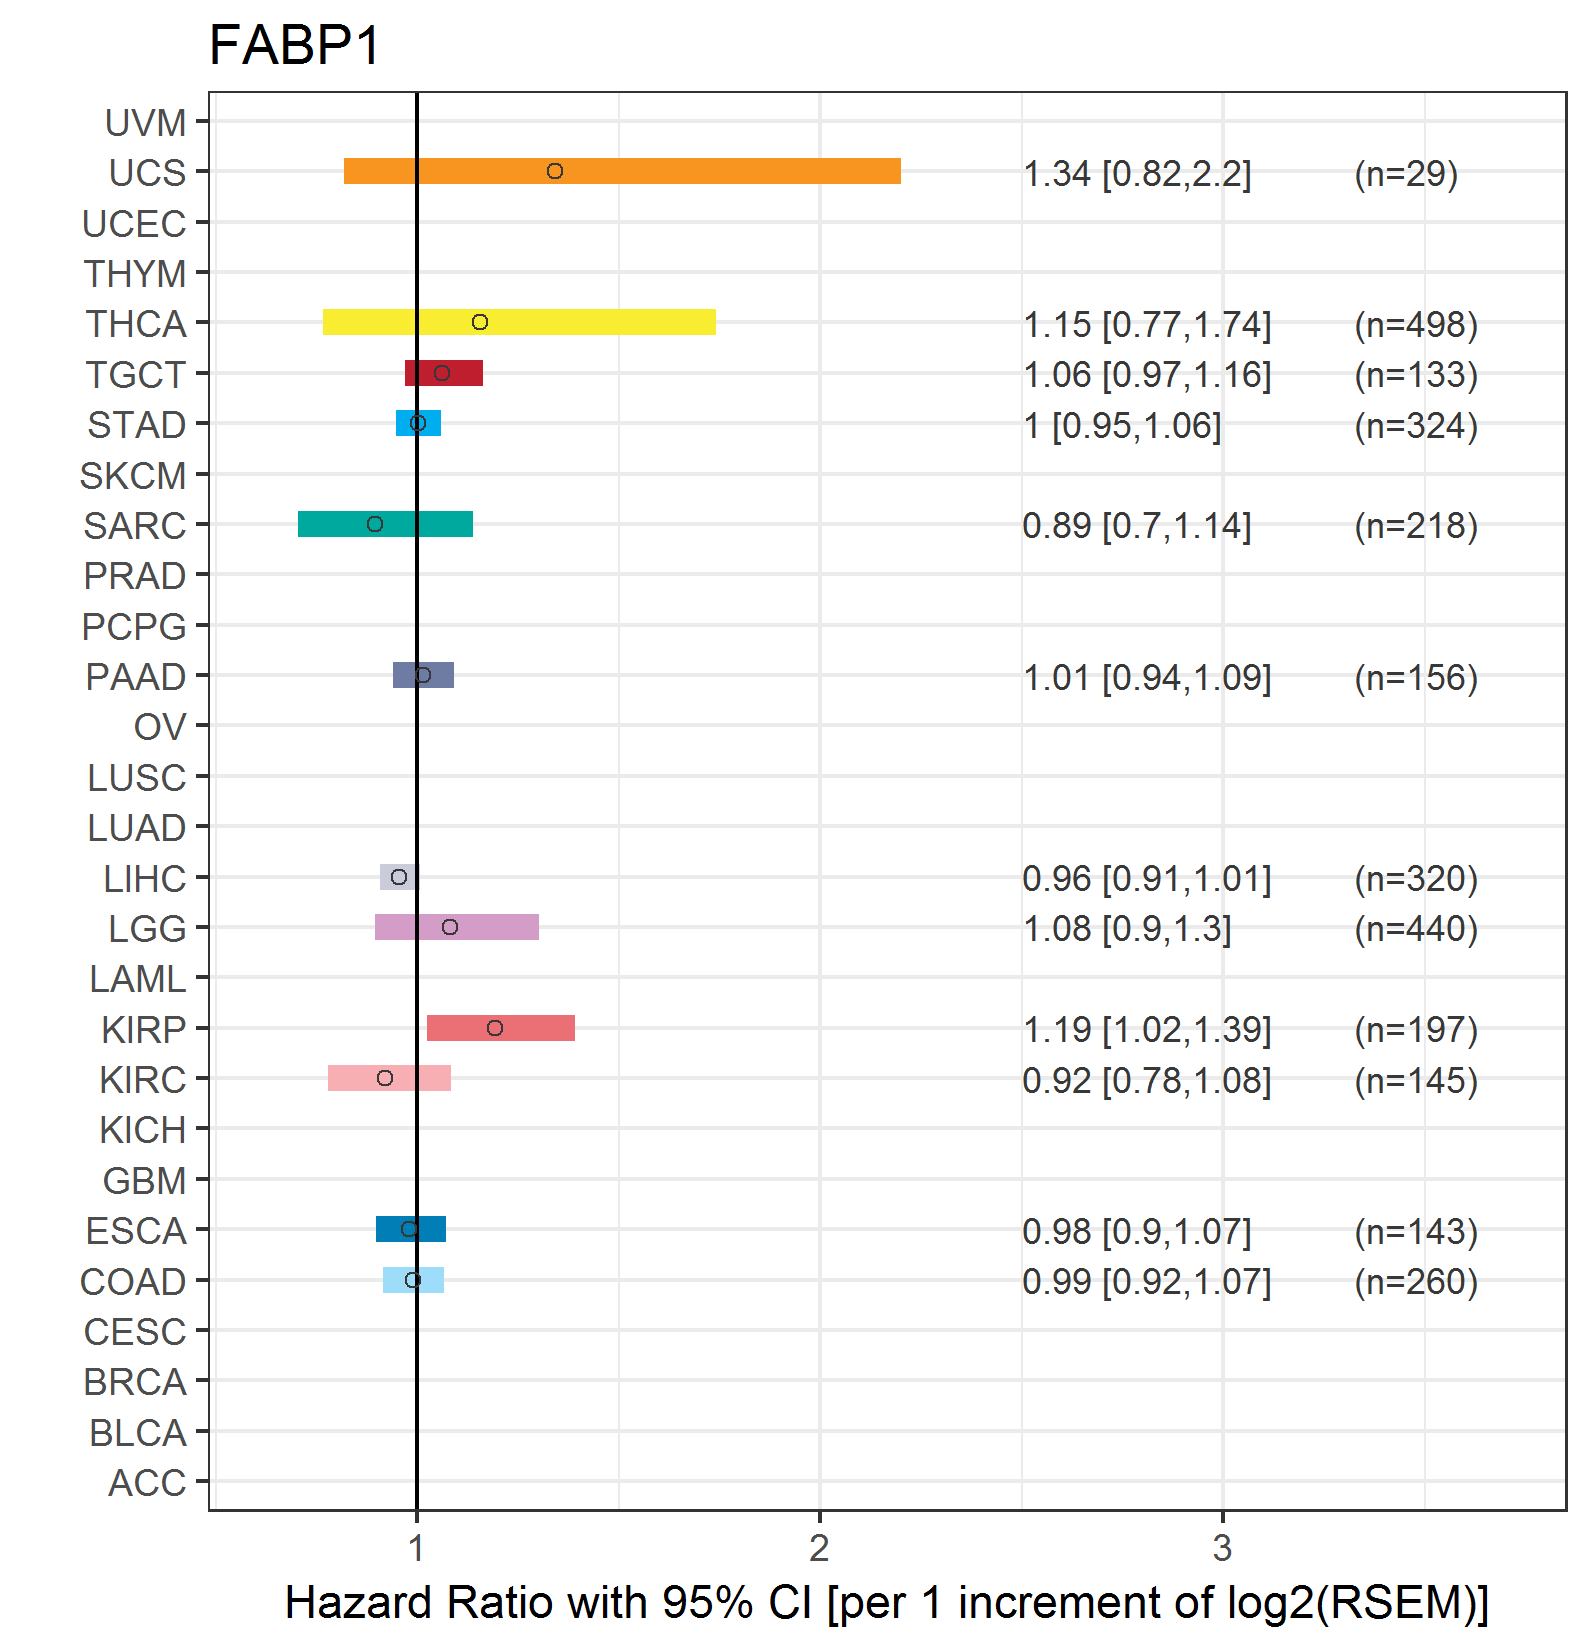
| Forest plot of Cox proportional hazard ratio (HR) and 95% CI of overall survival (OS) using 28 cancer types (TCGA IlluminaHiSeq_RNASeqV2, pan-cancer normalized log2(norm_counts+1) data, version 2016-08-16) (TCGA clinicalMatrix, phenotype data, version 2016-04-27) * Click on the image enlarge it in a new window. |
 |
| Forest plot of Cox proportional hazard ratio (HR) and 95% CI of relapse free survival (RFS) using 28 cancer types (TCGA IlluminaHiSeq_RNASeqV2, pan-cancer normalized log2(norm_counts+1) data, version 2016-08-16) (TCGA clinicalMatrix, phenotype data, version 2016-04-27) * Click on the image enlarge it in a new window. |
 |
| Top |
| TissGeneClin for FABP1 |
| TissGeneDrug for FABP1 |
| Drug information targeting TissGene (DrugBank Version 5.0.6, 2017-04-01) |
| DrugBank ID | Drug name | Drug activity | Drug type | Drug status |
| Top |
| TissGeneDisease for FABP1 |
| Disease information associated with TissGene (DisGeNet, 2016-06-01) |
| Disease ID | Disease name | # pubmeds | Source |
| umls:C0011860 | Diabetes Mellitus, Non-Insulin-Dependent | 4 | BeFree,GAD |
| umls:C0015695 | Fatty Liver | 3 | BeFree |
| umls:C0011881 | Diabetic Nephropathy | 2 | BeFree,LHGDN |
| umls:C0022658 | Kidney Diseases | 2 | BeFree |
| umls:C0022660 | Kidney Failure, Acute | 2 | BeFree |
| umls:C0023794 | Lipoidosis | 2 | CTD_human |
| umls:C0524620 | Metabolic Syndrome X | 2 | BeFree,GAD |
| umls:C1561643 | Chronic Kidney Diseases | 2 | BeFree |
| umls:C2239176 | Liver carcinoma | 2 | BeFree |
| umls:C0002871 | Anemia | 1 | LHGDN |
| umls:C0004096 | Asthma | 1 | BeFree |
| umls:C0007785 | Cerebral Infarction | 1 | LHGDN |
| umls:C0017661 | IGA Glomerulonephritis | 1 | BeFree |
| umls:C0020456 | Hyperglycemia | 1 | LHGDN |
| umls:C0020473 | Hyperlipidemia | 1 | BeFree |
| umls:C0022661 | Kidney Failure, Chronic | 1 | CTD_human |
| umls:C0022672 | Acute Kidney Tubular Necrosis | 1 | CTD_human |
| umls:C0022735 | Klinefelter Syndrome | 1 | BeFree |
| umls:C0024523 | Malabsorption Syndrome | 1 | BeFree |
| umls:C0027430 | Nasal Polyps | 1 | BeFree |
| umls:C0028754 | Obesity | 1 | BeFree |
| umls:C0041956 | Ureteral obstruction | 1 | LHGDN |
| umls:C0206669 | Hepatocellular Adenoma | 1 | BeFree |
| umls:C0340068 | Aspirin-sensitive asthma with nasal polyps | 1 | BeFree |
| umls:C0342276 | Maturity onset diabetes mellitus in young | 1 | BeFree |
| umls:C0403447 | Chronic Kidney Insufficiency | 1 | BeFree |
| umls:C0432474 | Klinefelter's syndrome - male with more than two X chromosomes | 1 | BeFree |
|
Copyright 2016-Present - The University of Texas Health Science Center at Houston (UTHealth) Web File Viewing | How to Report, Fraud, Waste and Abuse | State of Texas | Statewide Search | Texas Homeland Security | Site Policies |