 |
| |
| |
| |
| |
| |
| |
|

| TissGeneSummary for TYSND1 |
 Gene summary Gene summary |
| Basic gene information | Gene symbol | TYSND1 |
| Gene name | trypsin domain containing 1 | |
| Synonyms | NET41 | |
| Cytomap | UCSC genome browser: 10q22.1 | |
| Type of gene | protein-coding | |
| RefGenes | NM_001040273.2, NM_173555.3,NR_073580.1,NR_073581.1,NR_073582.1, NR_073591.1,NR_073592.1,NR_073593.1,NR_073594.1, NR_073595.1, | |
| Description | peroxisomal leader peptide-processing proteasetrypsin domain-containing protein 1 | |
| Modification date | 20141207 | |
| dbXrefs | MIM : 611017 | |
| HGNC : HGNC | ||
| Ensembl : ENSG00000156521 | ||
| HPRD : 15593 | ||
| Vega : OTTHUMG00000018397 | ||
| Protein | UniProt: go to UniProt's Cross Reference DB Table | |
| Expression | CleanEX: HS_TYSND1 | |
| BioGPS: 219743 | ||
| Pathway | NCI Pathway Interaction Database: TYSND1 | |
| KEGG: TYSND1 | ||
| REACTOME: TYSND1 | ||
| Pathway Commons: TYSND1 | ||
| Context | iHOP: TYSND1 | |
| ligand binding site mutation search in PubMed: TYSND1 | ||
| UCL Cancer Institute: TYSND1 | ||
| Assigned class in TissGDB* | C | |
| Included tissue-specific gene expression resources | TiGER,GTEx | |
| Specific-tissues in normal samples (assigned by TissGDB using HPA, TiGER, and GTEx) | Bone marrowOvaryTestis | |
| Cancer types related to the specific-tissues in cancer samples (assigned by TissGDB using TCGA) | LAMLOVTGCT | |
| Reference showing the relevant tissue of TYSND1 | ||
| Description by TissGene annotations | TissgsLTS | |
| * Class A consists of genes with literature evidence and is part of the cTissGenes. Class B consists of only cTissGenes without additional evidence. The remaining genes belong to Class C. |
| Gene ontology having evidence of Inferred from Direct Assay (IDA) from Entrez |
| GO ID | GO term | PubMed ID | GO:0051260 | protein homooligomerization | 22002062 | GO:0051260 | protein homooligomerization | 22002062 |
| Top |
| TissGeneExp for TYSND1 |
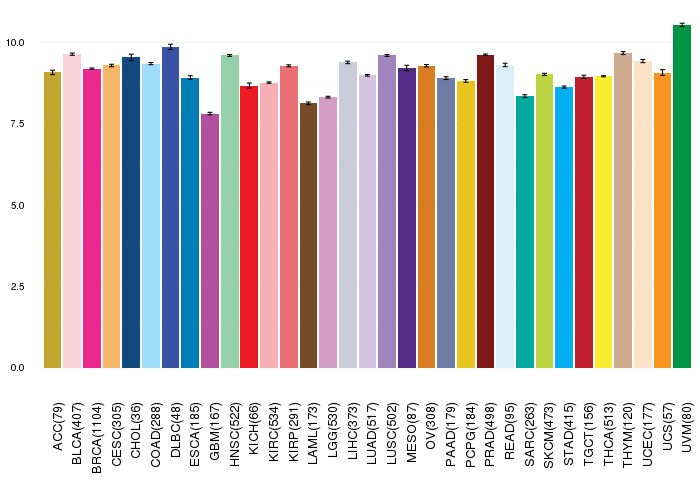
| Gene expressions across 28 cancer types (X-axis: cancer type and Y-axis: log2(norm_counts+1)) (TCGA IlluminaHiSeq_RNASeqV2, pan-cancer normalized log2(norm_counts+1) data, version 2016-08-16) |
 |
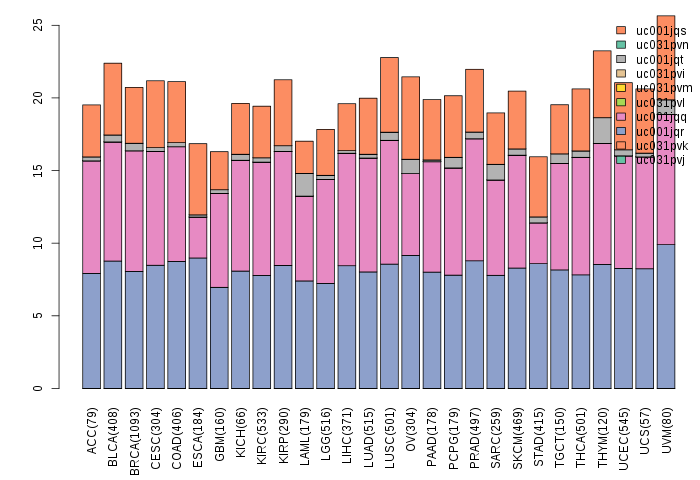
| Gene isoform expressions across 28 cancer types (X-axis: cancer type and Y-axis: log2(norm_counts+1)) (TCGA pan-cancer tcga_rsem_isoform_tpm, version 2016-09-01) |
 |
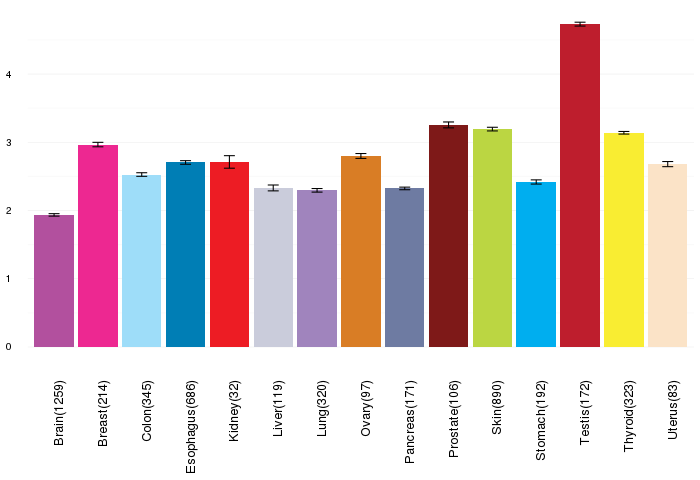
| Gene expressions across normal tissues of GTEx data (GTEx GTEx_Analysis_v6_RNA-seq_RNA-SeQCv1.1.8_gene_rpkm.gct) - Here, we shows the matched tissue types only among our 28 cancer types. |
 |
| Different expressions across 14 cancer types with more than 10 samples between matched tumors and normals (X-axis: cancer type and Y-axis: log2(norm_counts+1)) (TCGA IlluminaHiSeq_RNASeqV2, pan-cancer normalized log2(norm_counts+1) data, version 2016-08-16) |
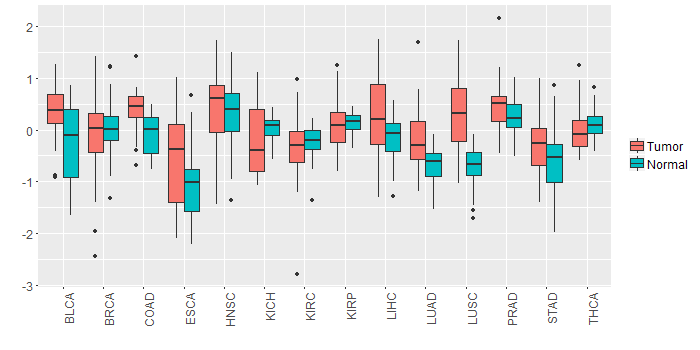 |
| - Significantly differentially expressed cancer types and information. (|Fold change|>1 and FDR<0.05) |
| Cancer type | Mean(exp) in tumor | Mean(exp) in matched normal | Log2FC | P-val. | FDR |
| LUSC | 0.333333906 | -0.69615629 | 1.029490196 | 2.44E-15 | 1.59E-14 |
| Top |
| TissGene-miRNA for TYSND1 |
| Significantly anti-correlated miRNAs of TissGene across 28 cancer types (Gene-miRNA relations from TargetScanHuman Relsease 7.1, Conserved_Site_Context_Scores.txt.zip, 06.01.2016) (TCGA IlluminaHiSeq_miRNASeq, log2(RPM+1) data, version 2016-11-21) (TCGA IlluminaHiSeq_RNASeqV2, log2(normalized_count+1) data, version 2016-08-16) (Spearman’s Rank Correlation (p-value<0.05 and coefficient<-0.25)) |
| Cancer type | miRNA id | miRNA accession | P-val. | Coeff. | # samples |
| Top |
| TissGeneMut for TYSND1 |
| TissGeneSNV for TYSND1 |
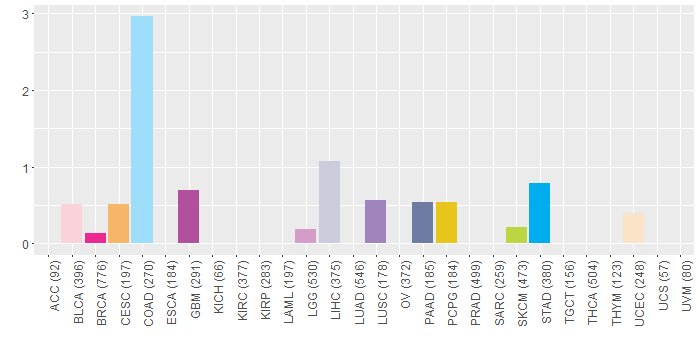
| nsSNV counts per each loci. Different colors of circles represent different cancer types. Circle size denotes number of samples. (TCGA somatic mutation (SNPs and small INDELs) data, version 2016-04-25) * Click on the image to enlarge it in a new window. |
 |
| Somatic nucleotide variants of TissGene across 28 cancer types (X-axis: cancer type and Y-axis: % of mutated samples) The numbers in parentheses are numbers of samples with mutation (nsSNVs). (TCGA somatic mutation (SNPs and small INDELs) data, version 2016-04-25) |
 |
| - nsSNVs sorted by frequency. |
| AAchange | Cancer type | # samples |
| p.T65A | COAD | 8 |
| p.P203L | PCPG | 1 |
| p.S499C | LIHC | 1 |
| p.E434K | LIHC | 1 |
| p.A427T | STAD | 1 |
| p.R539H | LUSC | 1 |
| p.T466M | HNSC | 1 |
| p.P426L | PAAD | 1 |
| p.E377K | SKCM | 1 |
| p.T65A | READ | 1 |
| p.V213M | LIHC | 1 |
| p.S171W | LIHC | 1 |
| p.Q402* | UCEC | 1 |
| p.R556W | BLCA | 1 |
| p.G353D | STAD | 1 |
| p.S171L | BRCA | 1 |
| p.H372Y | GBM | 1 |
| p.R553Q | LGG | 1 |
| p.F515L | CESC | 1 |
| p.S454* | HNSC | 1 |
| p.A379V | GBM | 1 |
| p.G445C | STAD | 1 |
| p.S454L | BLCA | 1 |
| Top |
| TissGeneCNV for TYSND1 |
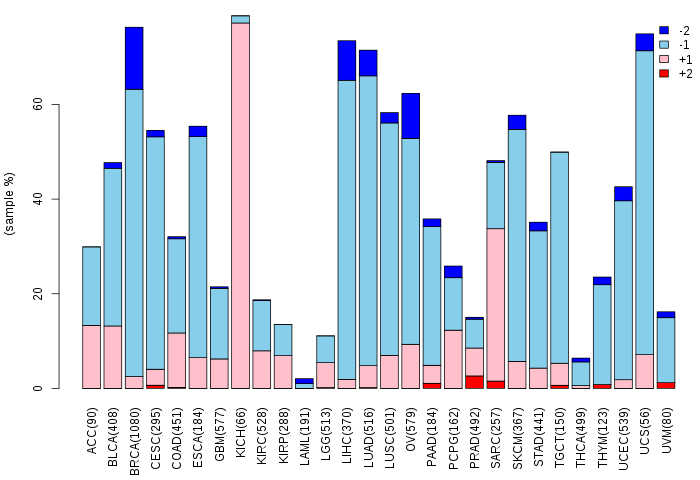
| Copy number variations of TissGene across 28 cancer types (X-axis: cancer type and Y-axis: % of CNV samples) (TCGA Gistic2_CopyNumber_Gistic2_all_data_by_genes, Gistic2 copy number data, version 2016-08-16) |
 |
| Top |
| TissGeneFusions for TYSND1 |
| Fusion genes including TissGene (ChimerDB 3.0, 2016-12-01 and TCGA fusion Portal 2015-12-01) |
| Database | Src | Cancer type | Sample | Fusion gene | ORF | 5'-gene BP | 3'-gene BP |
| Chimerdb3.0 | ChiTaRs | NA | BC088729 | TYSND1-ANKRD11 | chr10:71906403 | chr16:89365287 | |
| Chimerdb3.0 | FusionScan | BRCA | TCGA-LD-A7W5-01A | VDAC2-TYSND1 | In-Frame | chr10:76989459 | chr10:71899897 |
| Top |
| TissGeneNet for TYSND1 |
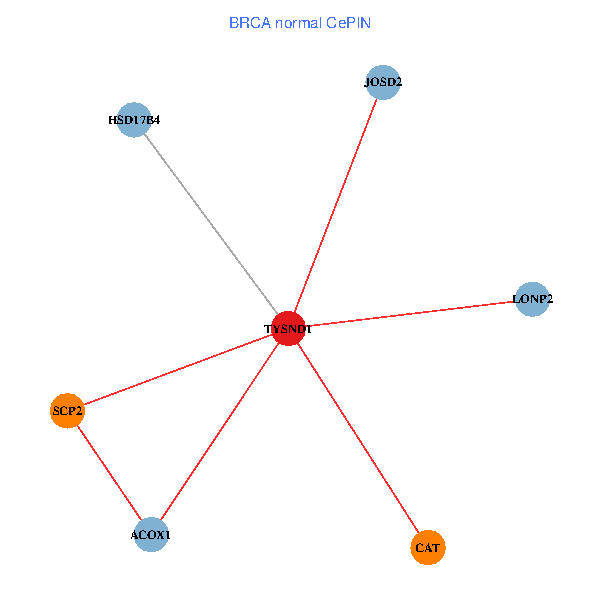
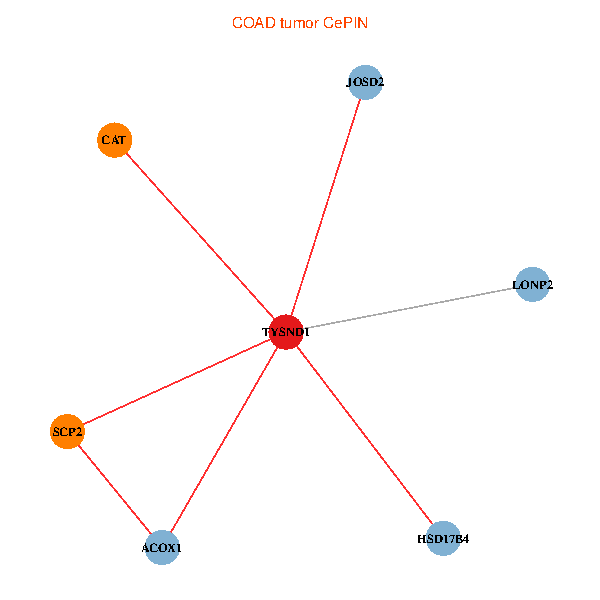
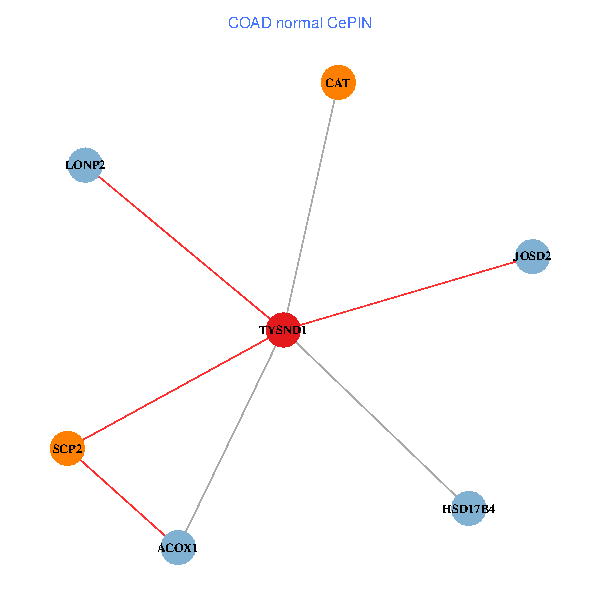
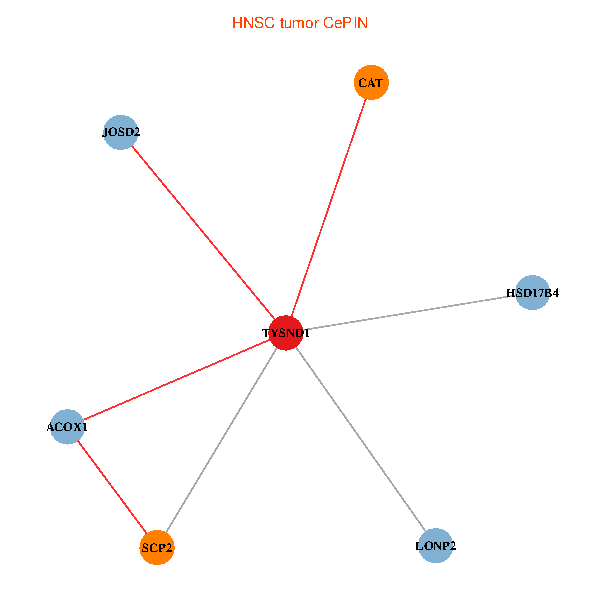
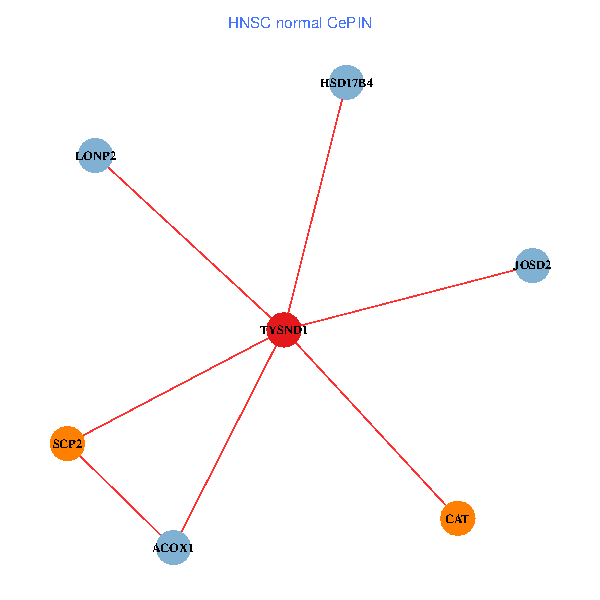
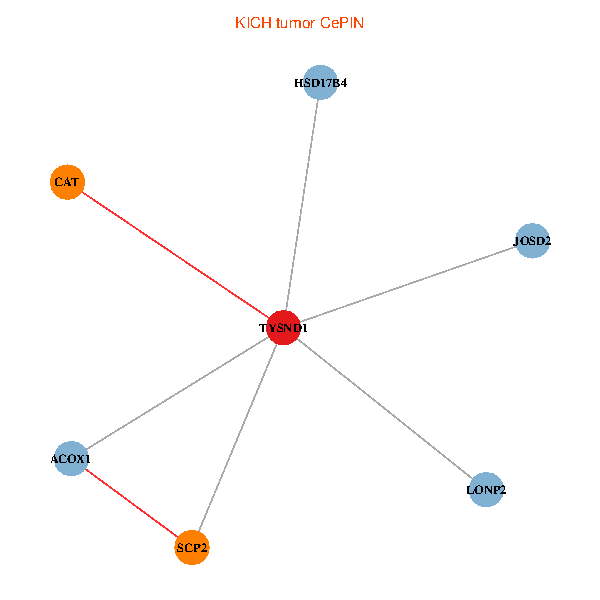
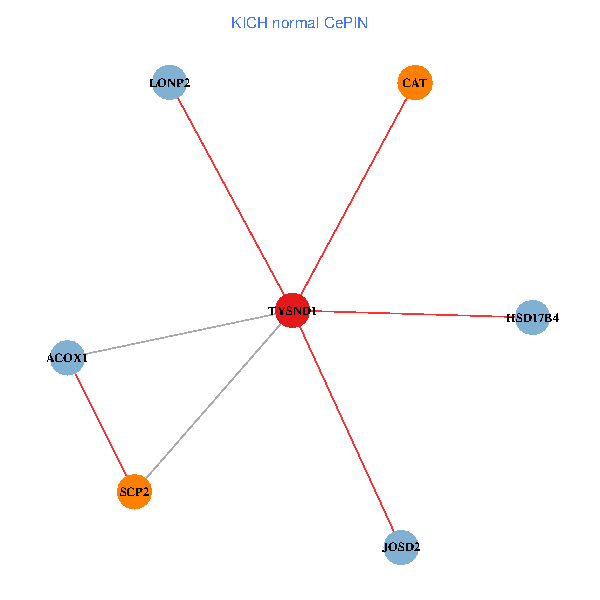
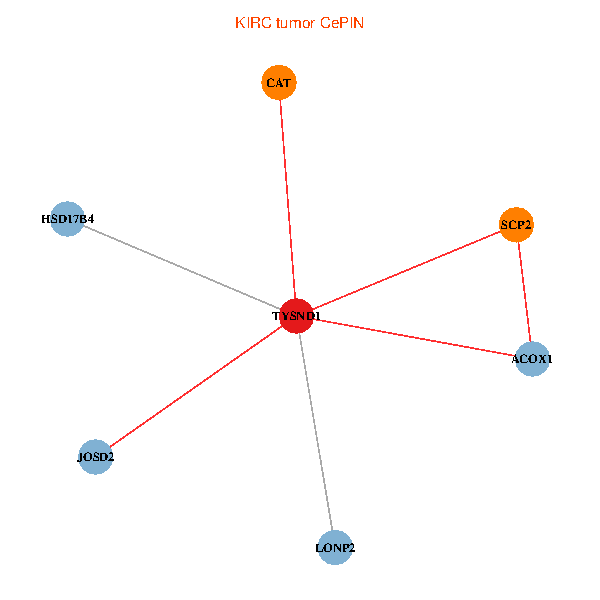
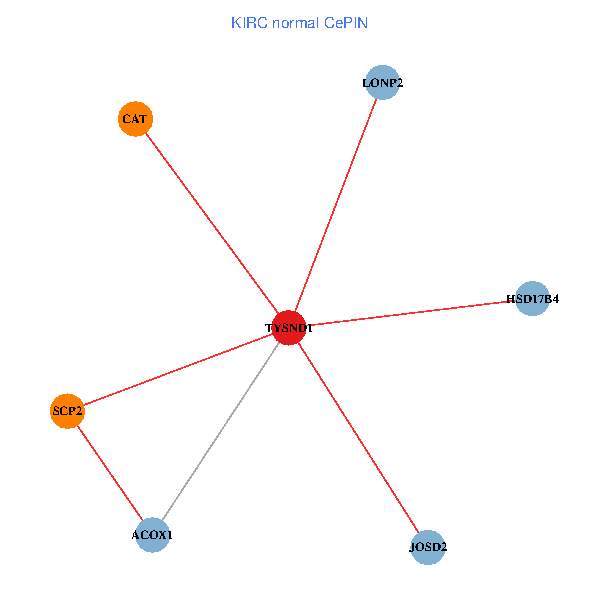
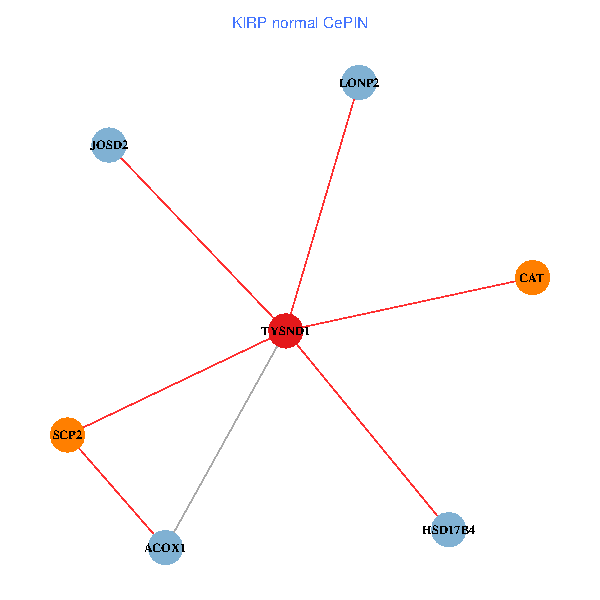
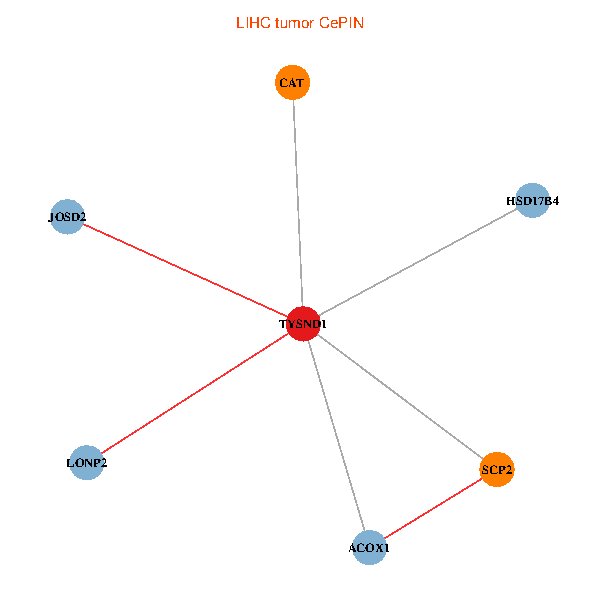
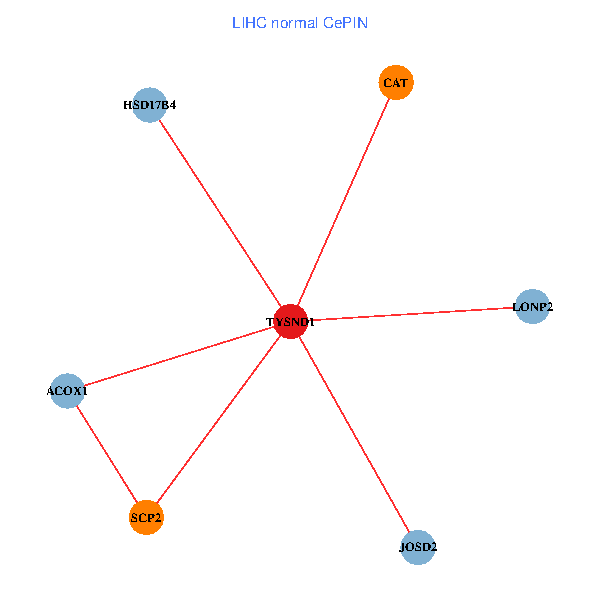
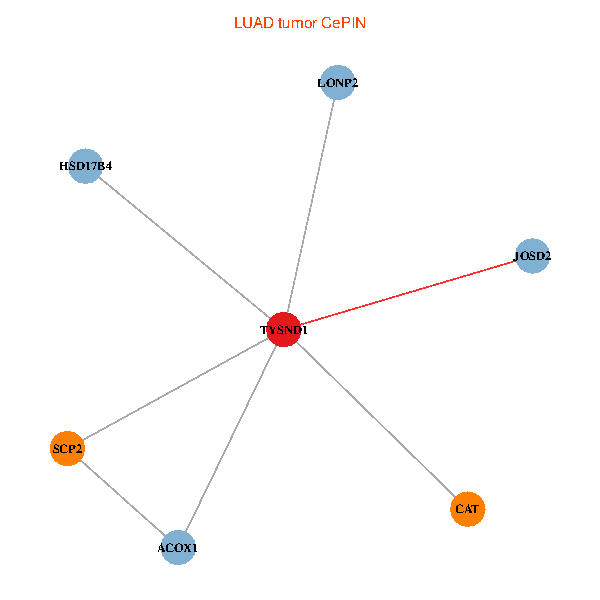
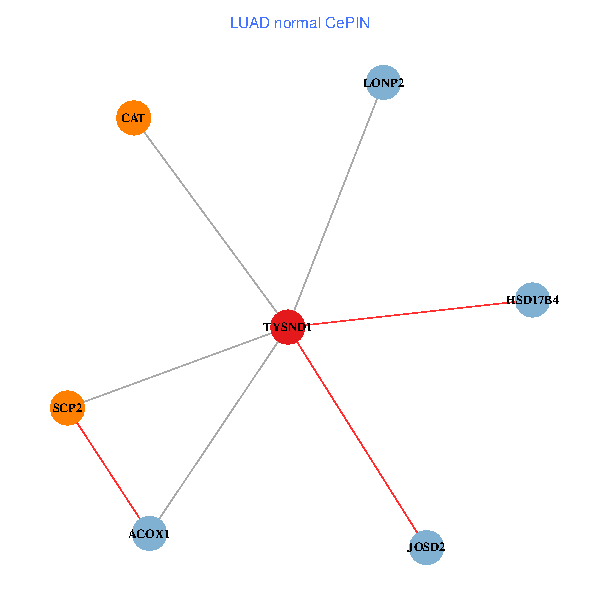
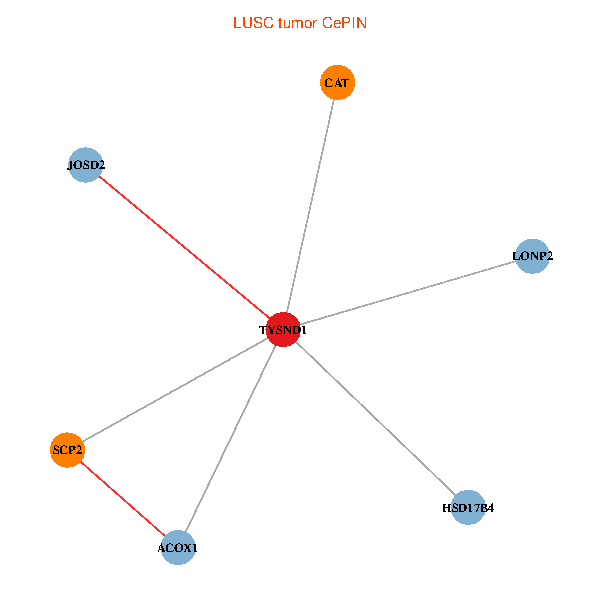
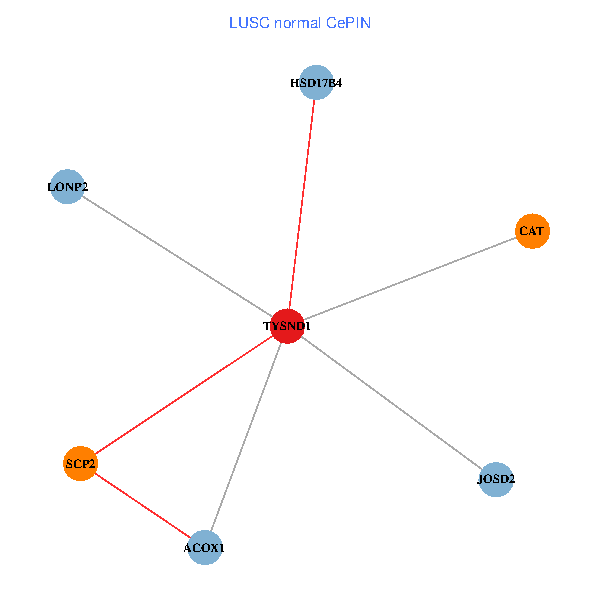
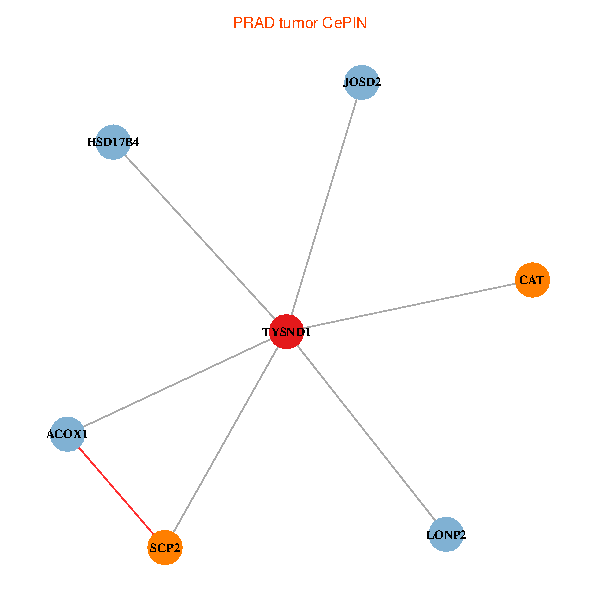
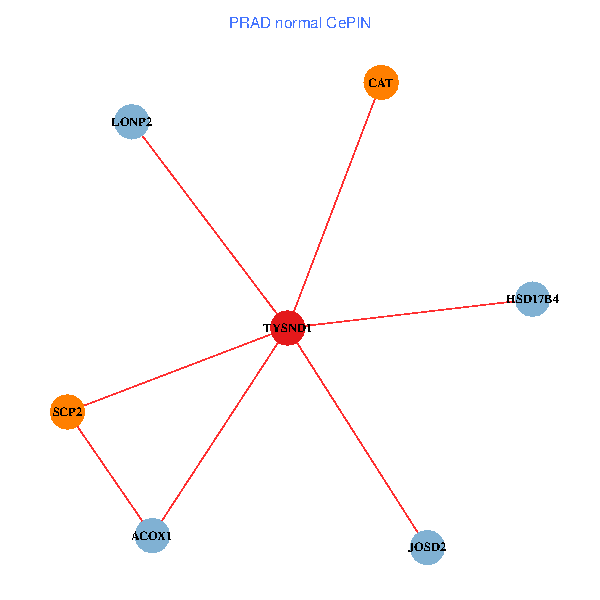
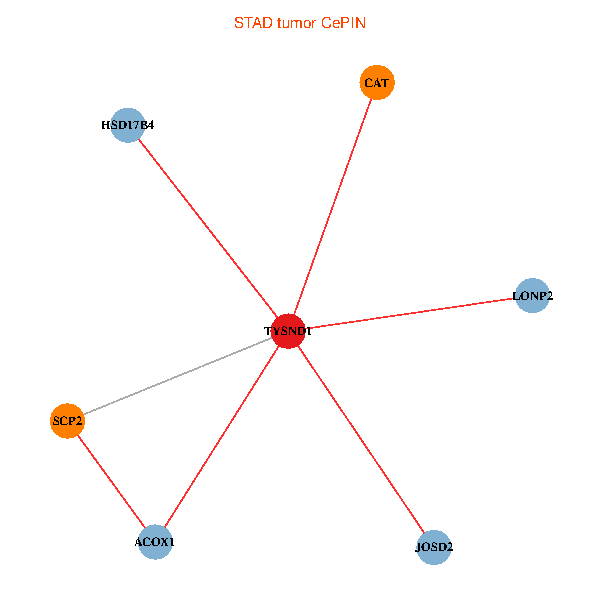
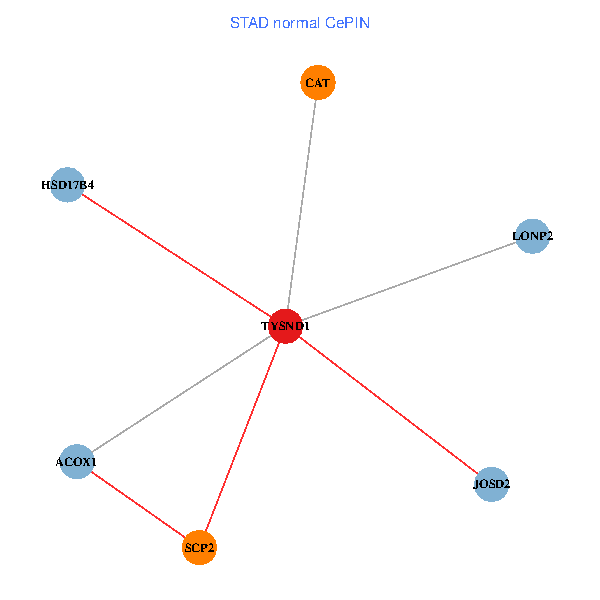
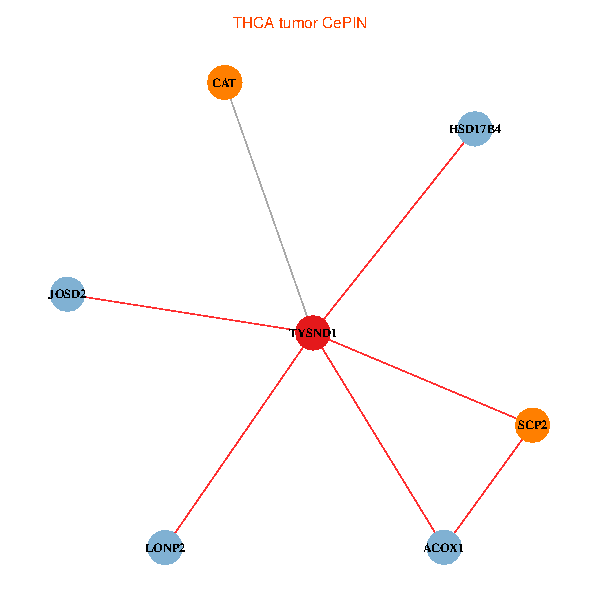
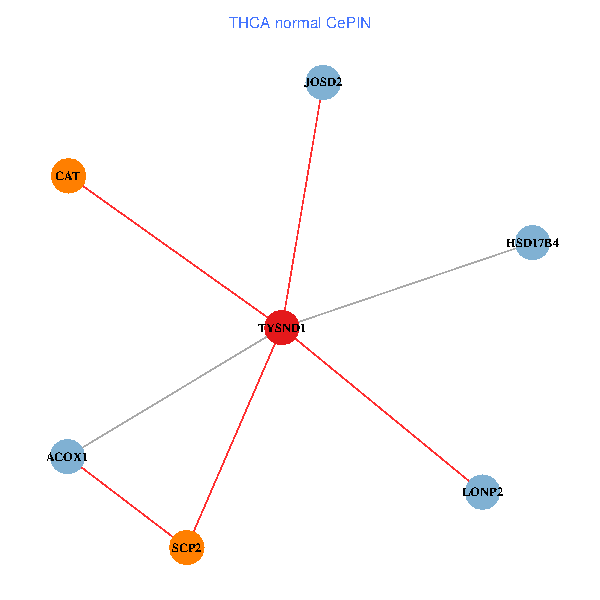
| Co-expressed gene networks based on protein-protein interaction data (CePIN) (TCGA IlluminaHiSeq_RNASeqV2, pan-cancer normalized log2(norm_counts+1) data, version 2016-08-16) (PINA2 ppi data) |
| BRCA (tumor) | BRCA (normal) |
| TYSND1, HSD17B4, CAT, LONP2, SCP2, JOSD2, ACOX1 (tumor) | TYSND1, HSD17B4, CAT, LONP2, SCP2, JOSD2, ACOX1 (normal) |
 |  |
| COAD (tumor) | COAD (normal) |
| TYSND1, HSD17B4, CAT, LONP2, SCP2, JOSD2, ACOX1 (tumor) | TYSND1, HSD17B4, CAT, LONP2, SCP2, JOSD2, ACOX1 (normal) |
 |  |
| HNSC (tumor) | HNSC (normal) |
| TYSND1, HSD17B4, CAT, LONP2, SCP2, JOSD2, ACOX1 (tumor) | TYSND1, HSD17B4, CAT, LONP2, SCP2, JOSD2, ACOX1 (normal) |
 |  |
| KICH (tumor) | KICH (normal) |
| TYSND1, HSD17B4, CAT, LONP2, SCP2, JOSD2, ACOX1 (tumor) | TYSND1, HSD17B4, CAT, LONP2, SCP2, JOSD2, ACOX1 (normal) |
 |  |
| KIRC (tumor) | KIRC (normal) |
| TYSND1, HSD17B4, CAT, LONP2, SCP2, JOSD2, ACOX1 (tumor) | TYSND1, HSD17B4, CAT, LONP2, SCP2, JOSD2, ACOX1 (normal) |
 |  |
| KIRP (tumor) | KIRP (normal) |
| TYSND1, HSD17B4, CAT, LONP2, SCP2, JOSD2, ACOX1 (tumor) | TYSND1, HSD17B4, CAT, LONP2, SCP2, JOSD2, ACOX1 (normal) |
 |  |
| LIHC (tumor) | LIHC (normal) |
| TYSND1, HSD17B4, CAT, LONP2, SCP2, JOSD2, ACOX1 (tumor) | TYSND1, HSD17B4, CAT, LONP2, SCP2, JOSD2, ACOX1 (normal) |
 |  |
| LUAD (tumor) | LUAD (normal) |
| TYSND1, HSD17B4, CAT, LONP2, SCP2, JOSD2, ACOX1 (tumor) | TYSND1, HSD17B4, CAT, LONP2, SCP2, JOSD2, ACOX1 (normal) |
 |  |
| LUSC (tumor) | LUSC (normal) |
| TYSND1, HSD17B4, CAT, LONP2, SCP2, JOSD2, ACOX1 (tumor) | TYSND1, HSD17B4, CAT, LONP2, SCP2, JOSD2, ACOX1 (normal) |
 |  |
| PRAD (tumor) | PRAD (normal) |
| TYSND1, HSD17B4, CAT, LONP2, SCP2, JOSD2, ACOX1 (tumor) | TYSND1, HSD17B4, CAT, LONP2, SCP2, JOSD2, ACOX1 (normal) |
 |  |
| STAD (tumor) | STAD (normal) |
| TYSND1, HSD17B4, CAT, LONP2, SCP2, JOSD2, ACOX1 (tumor) | TYSND1, HSD17B4, CAT, LONP2, SCP2, JOSD2, ACOX1 (normal) |
 |  |
| THCA (tumor) | THCA (normal) |
| TYSND1, HSD17B4, CAT, LONP2, SCP2, JOSD2, ACOX1 (tumor) | TYSND1, HSD17B4, CAT, LONP2, SCP2, JOSD2, ACOX1 (normal) |
 |  |
| Top |
| TissGeneProg for TYSND1 |
| Kaplan-Meier plots with logrank tests of overall survival (OS) using 28 cancer types (TCGA IlluminaHiSeq_RNASeqV2, pan-cancer normalized log2(norm_counts+1) data, version 2016-08-16) (TCGA clinicalMatrix, phenotype data, version 2016-04-27) * Click on the image to enlarge it in a new window. |
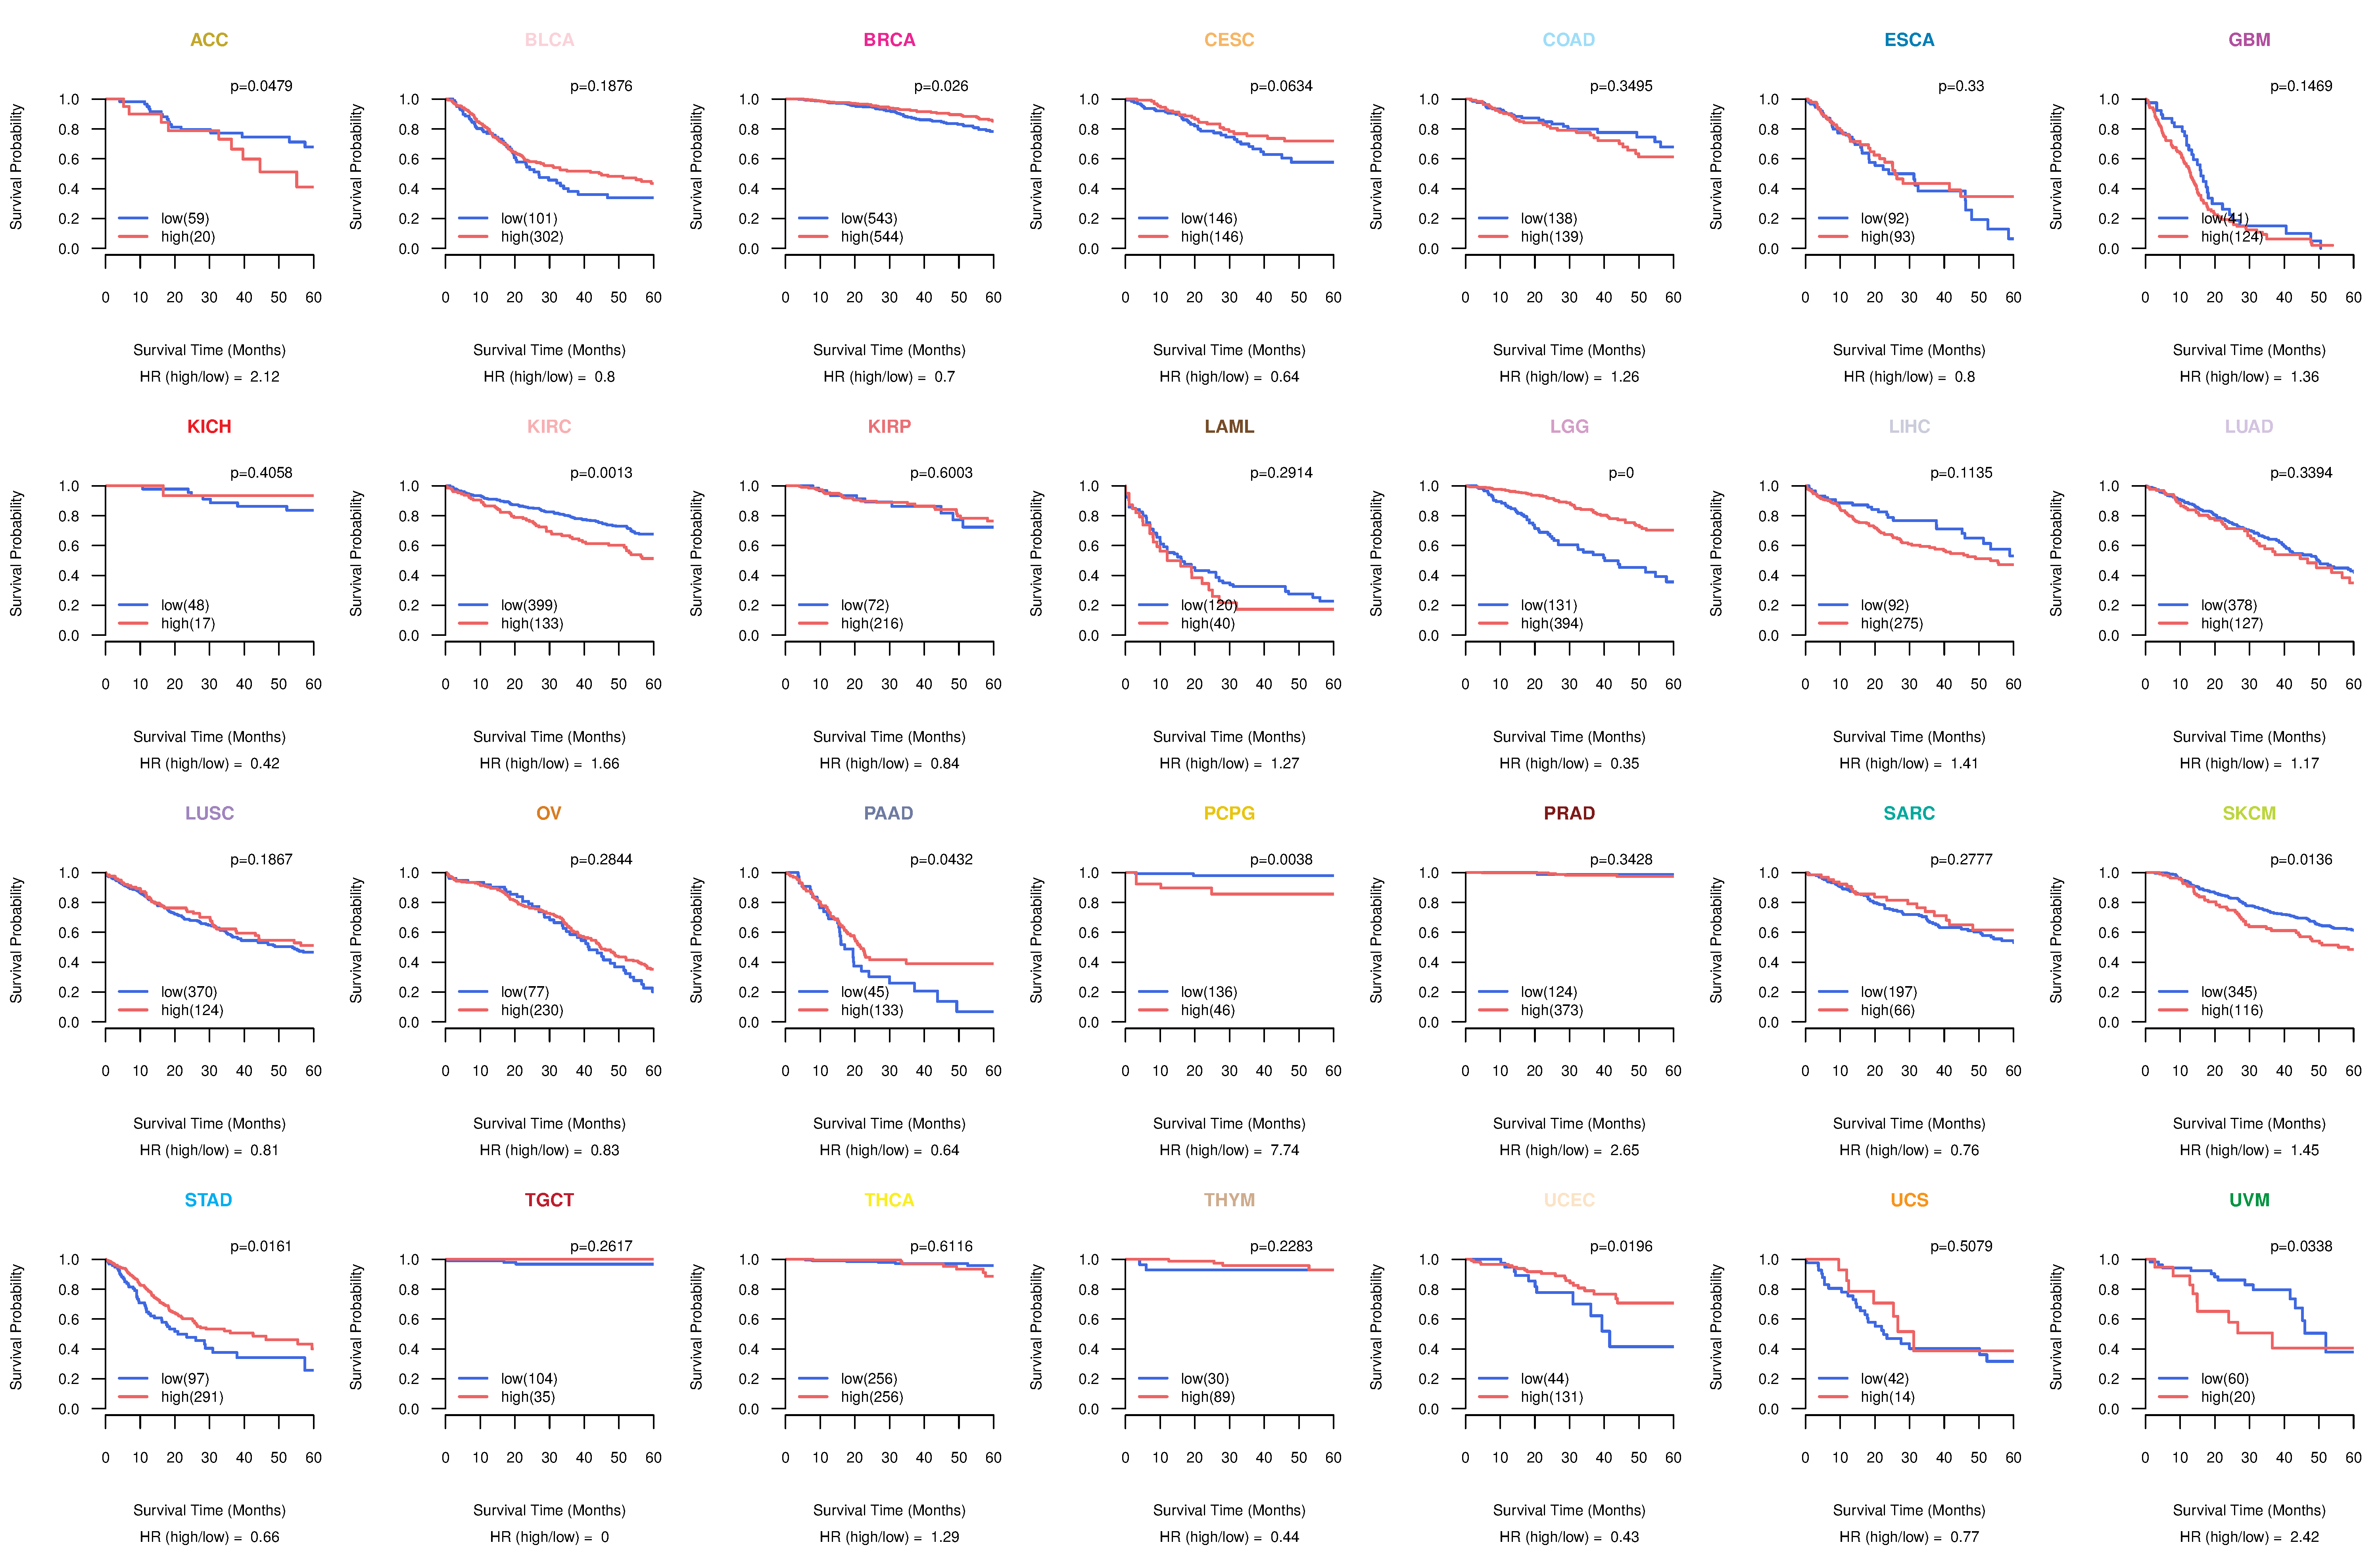 |
| Kaplan-Meier plots with logrank test of relapse free survival (RFS) using 28 cancer types (TCGA IlluminaHiSeq_RNASeqV2, pan-cancer normalized log2(norm_counts+1) data, version 2016-08-16) (TCGA clinicalMatrix, phenotype data, version 2016-04-27) * Click on the image enlarge it in a new window. |
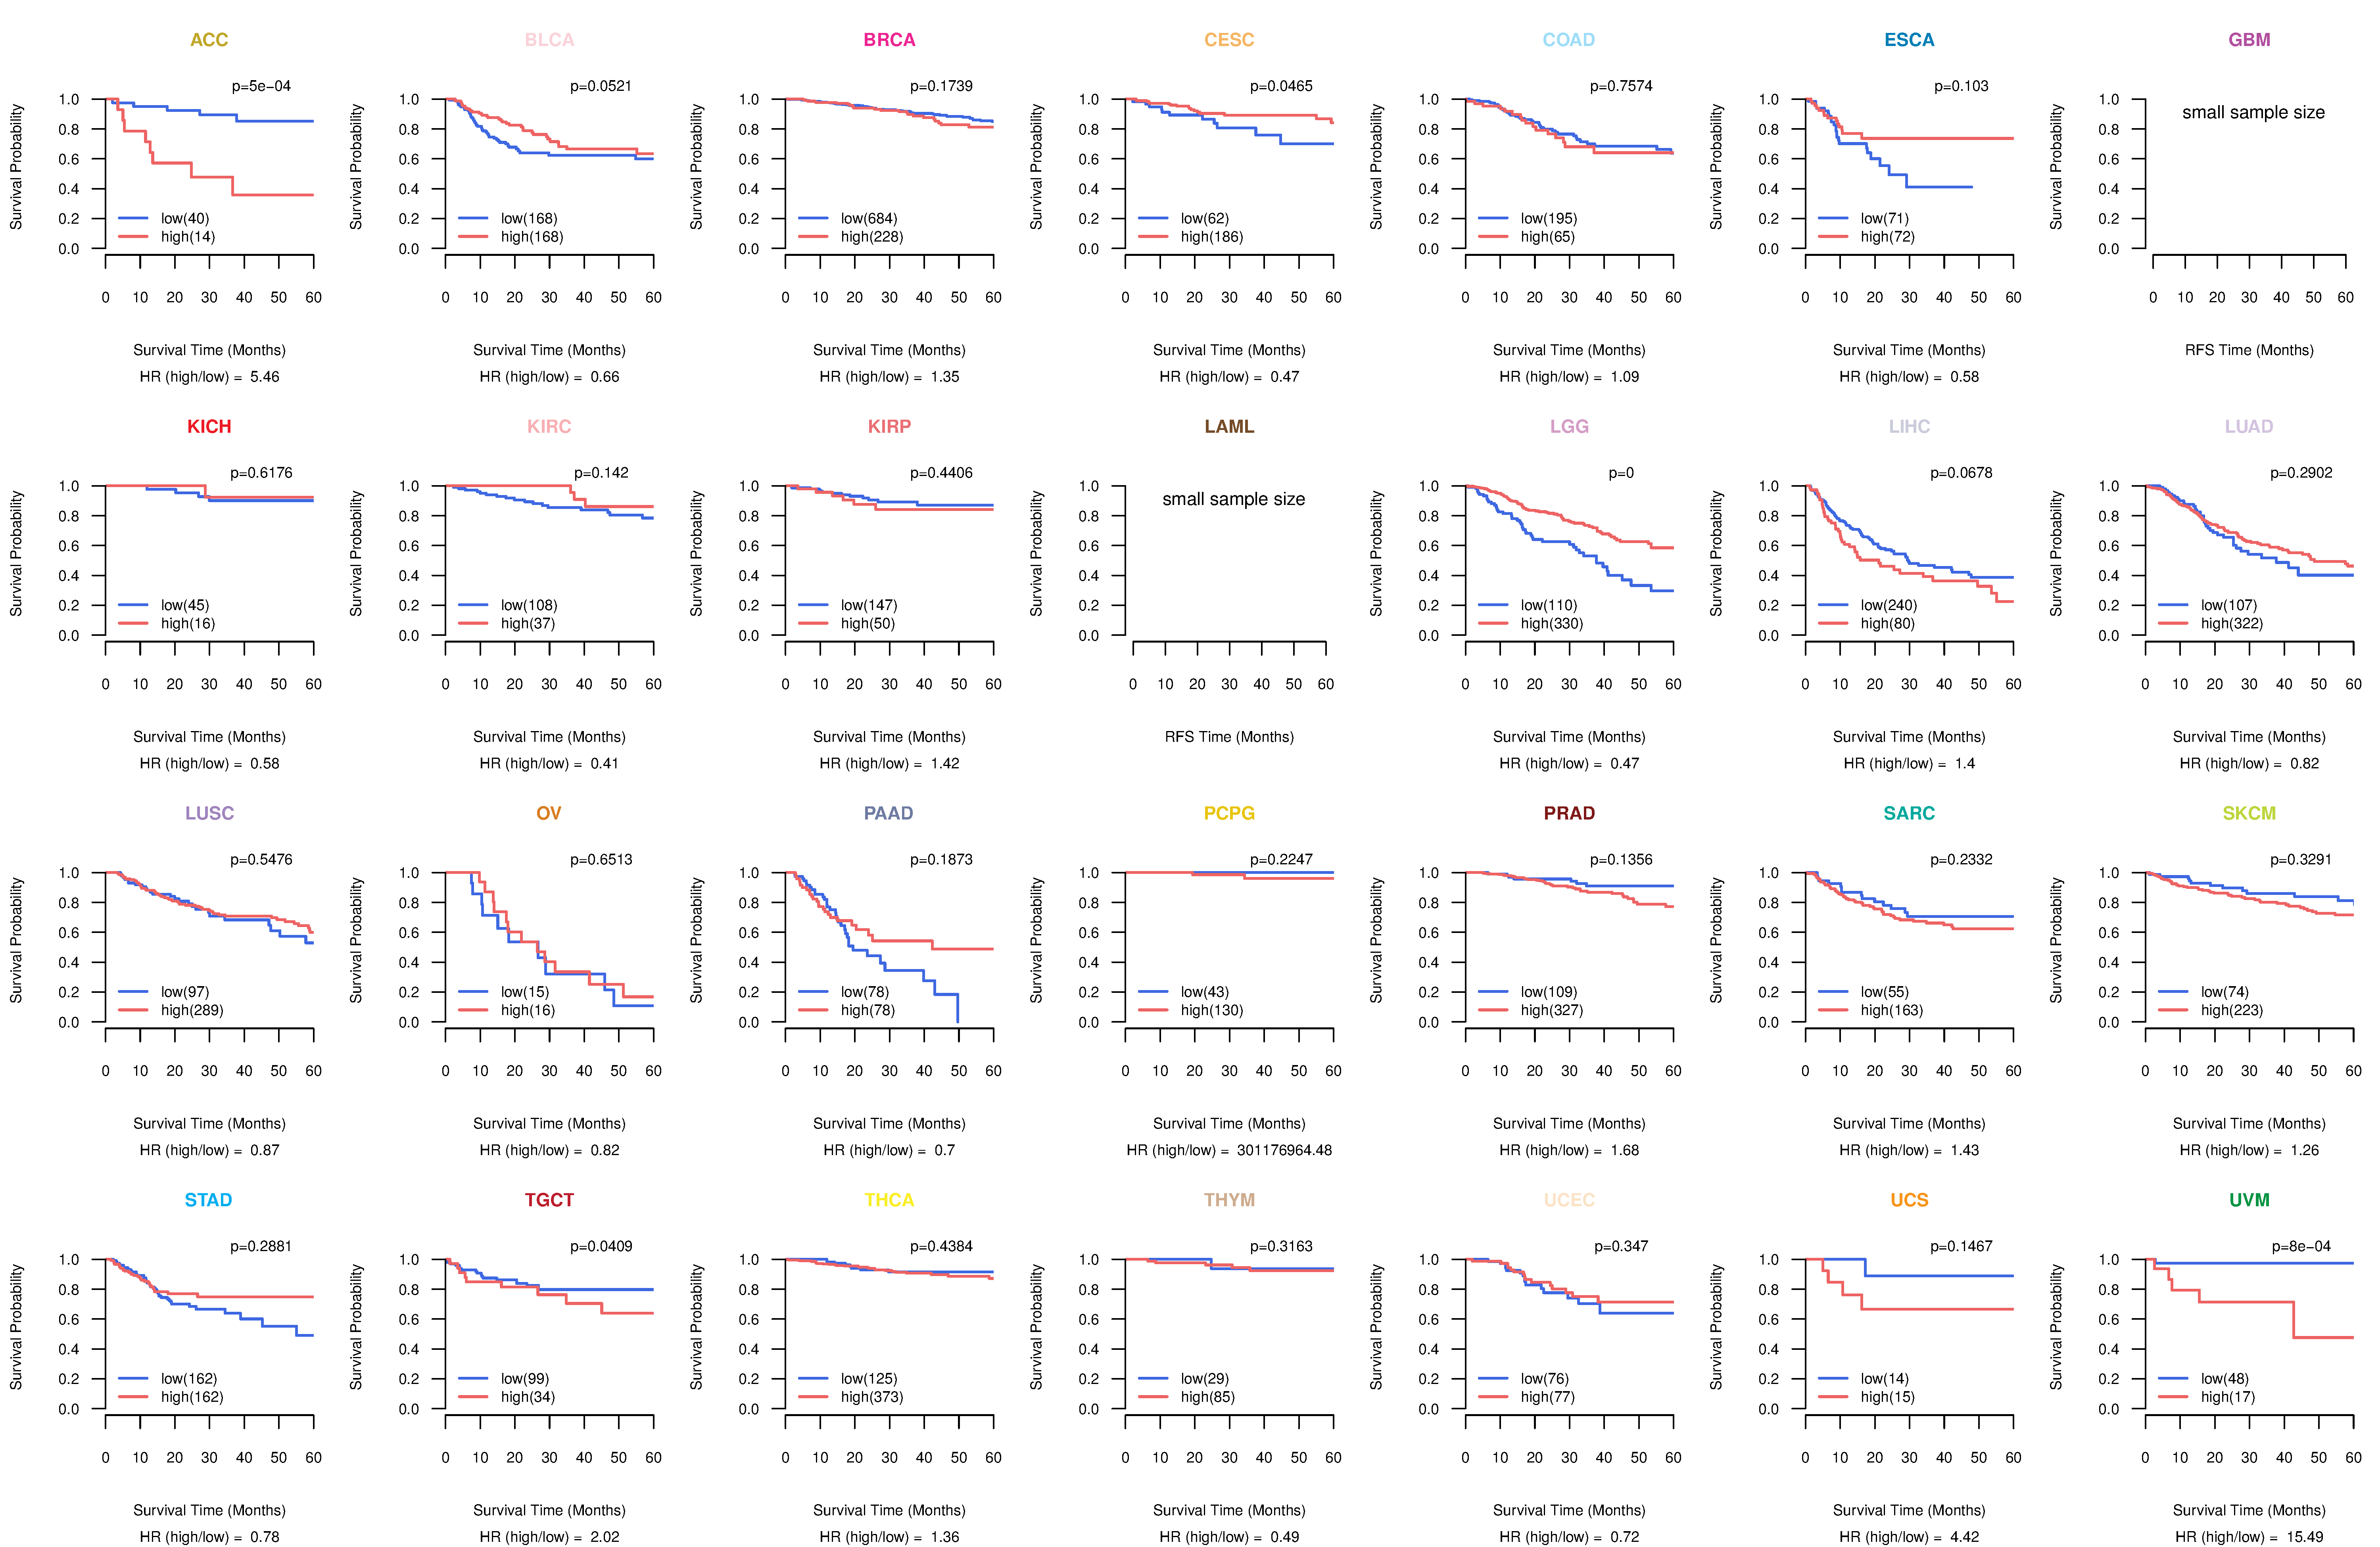 |
| Forest plot of Cox proportional hazard ratio (HR) and 95% CI of overall survival (OS) using 28 cancer types (TCGA IlluminaHiSeq_RNASeqV2, pan-cancer normalized log2(norm_counts+1) data, version 2016-08-16) (TCGA clinicalMatrix, phenotype data, version 2016-04-27) * Click on the image enlarge it in a new window. |
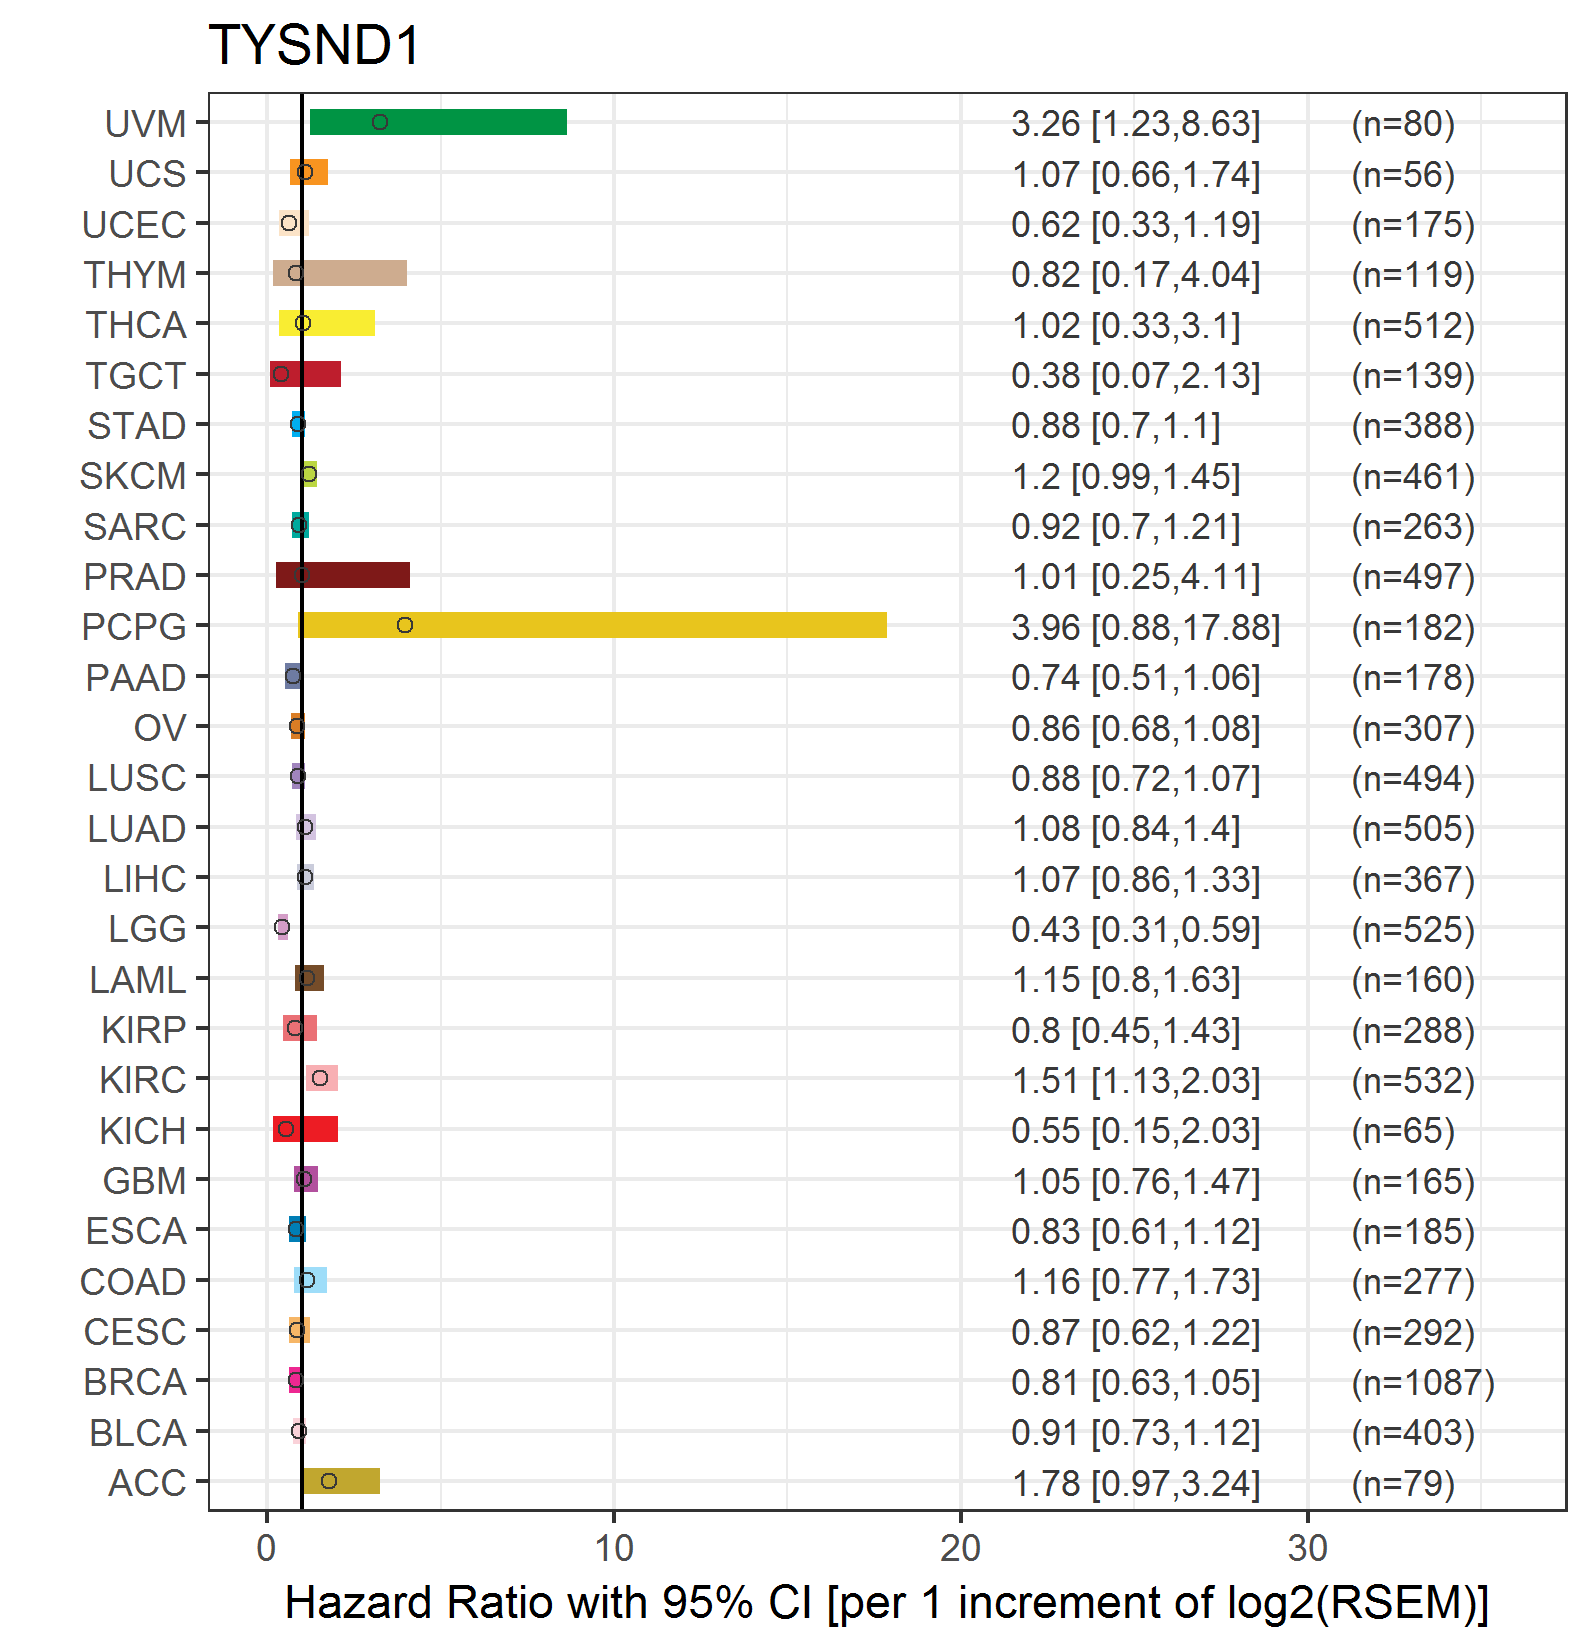 |
| Forest plot of Cox proportional hazard ratio (HR) and 95% CI of relapse free survival (RFS) using 28 cancer types (TCGA IlluminaHiSeq_RNASeqV2, pan-cancer normalized log2(norm_counts+1) data, version 2016-08-16) (TCGA clinicalMatrix, phenotype data, version 2016-04-27) * Click on the image enlarge it in a new window. |
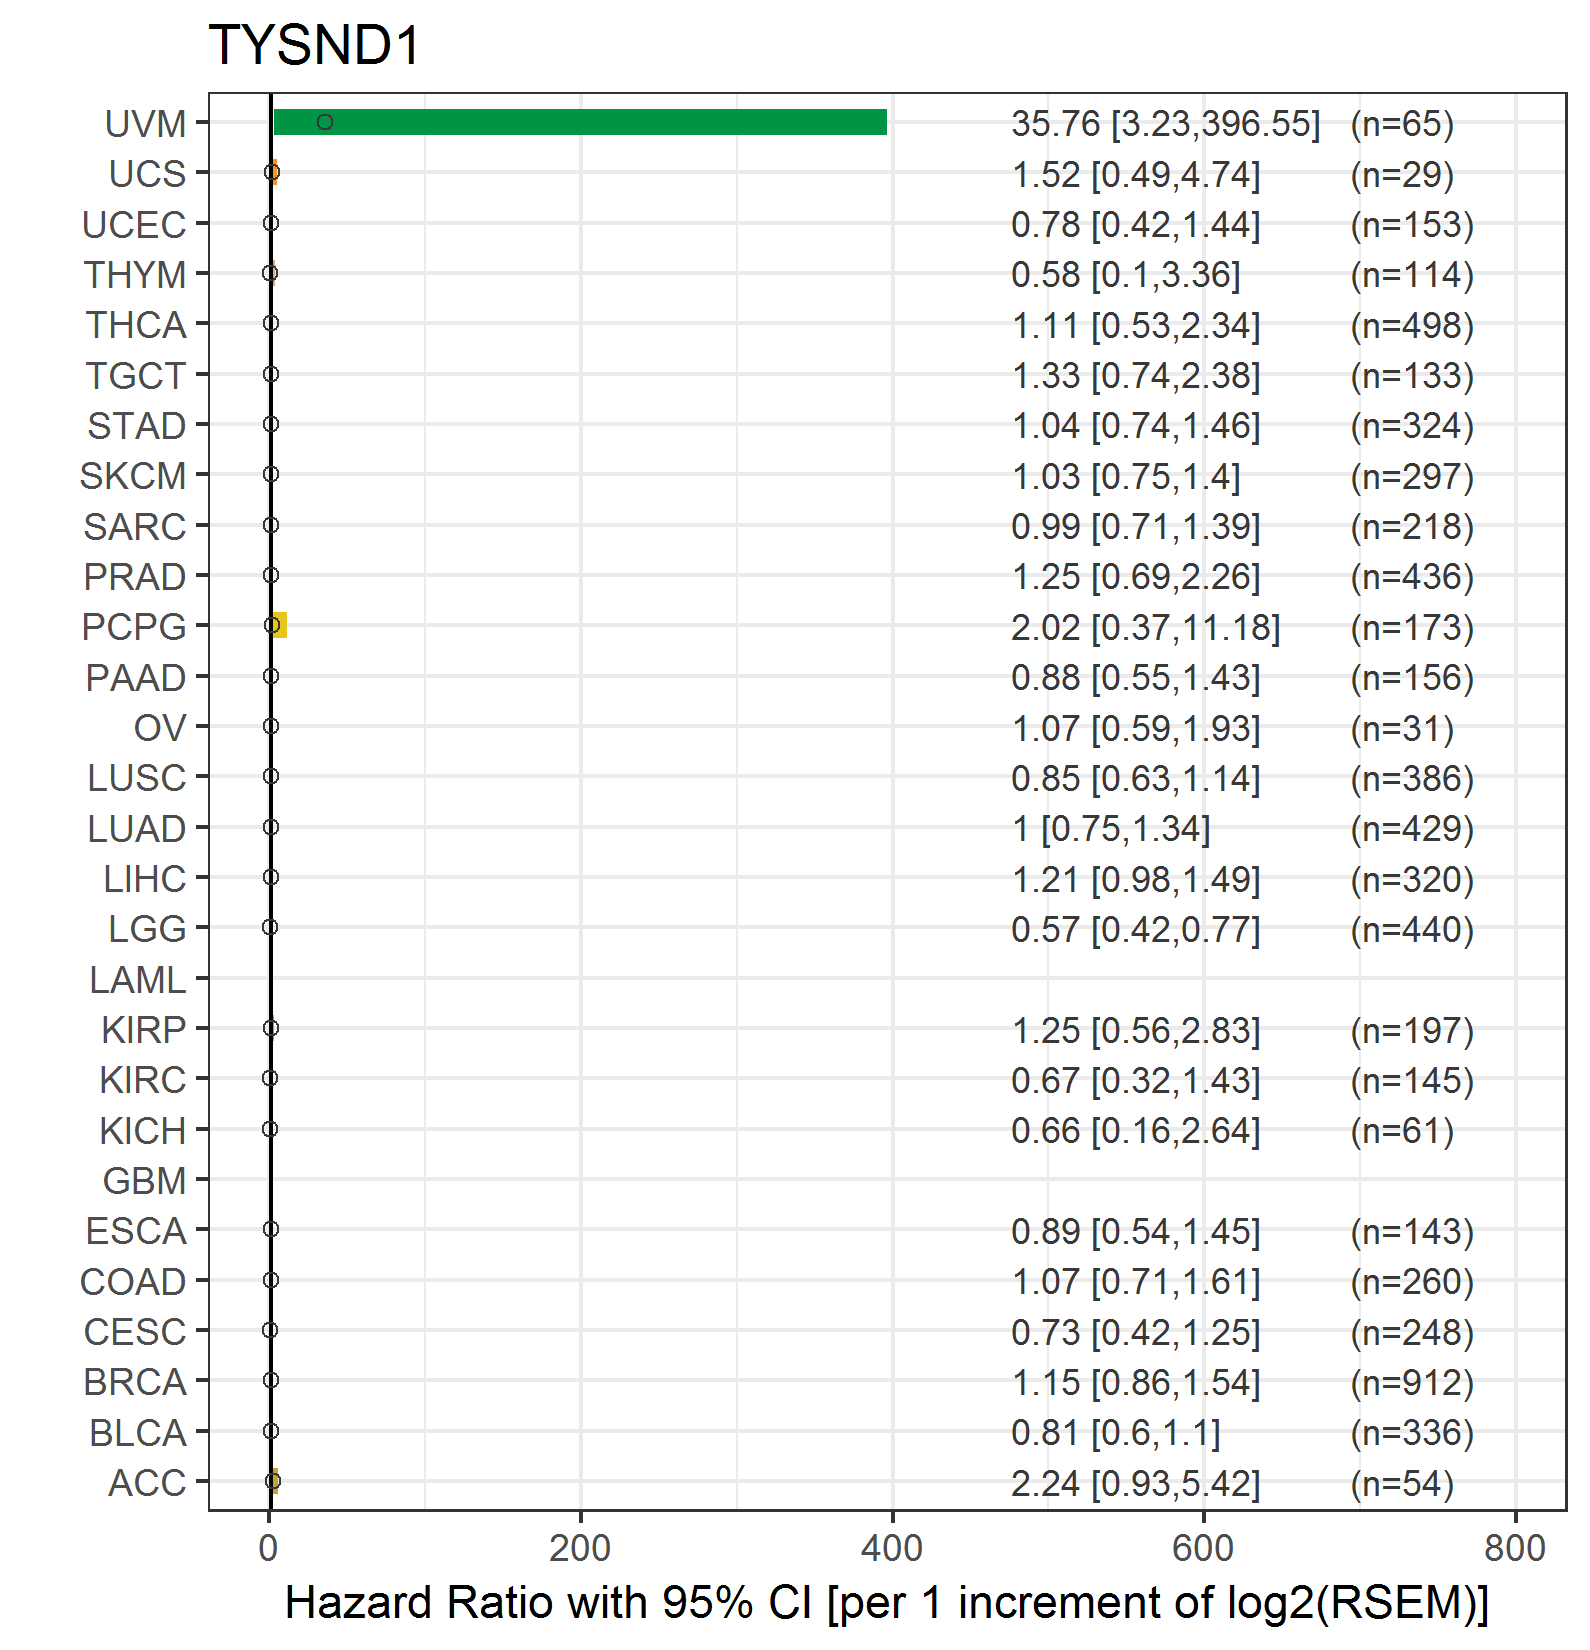 |
| Top |
| TissGeneClin for TYSND1 |
| TissGeneDrug for TYSND1 |
| Drug information targeting TissGene (DrugBank Version 5.0.6, 2017-04-01) |
| DrugBank ID | Drug name | Drug activity | Drug type | Drug status |
| Top |
| TissGeneDisease for TYSND1 |
| Disease information associated with TissGene (DisGeNet, 2016-06-01) |
| Disease ID | Disease name | # pubmeds | Source |
| umls:C0021364 | Male infertility | 1 | BeFree |
| umls:C0040336 | Tobacco Use Disorder | 1 | GAD |
| umls:C3658299 | Zellweger Spectrum | 1 | BeFree |
|
Copyright 2016-Present - The University of Texas Health Science Center at Houston (UTHealth) Web File Viewing | How to Report, Fraud, Waste and Abuse | State of Texas | Statewide Search | Texas Homeland Security | Site Policies |