 |
| |
| |
| |
| |
| |
| |
|

| TissGeneSummary for TBATA |
 Gene summary Gene summary |
| Basic gene information | Gene symbol | TBATA |
| Gene name | thymus, brain and testes associated | |
| Synonyms | C10orf27|spatial | |
| Cytomap | UCSC genome browser: 10q22.1 | |
| Type of gene | protein-coding | |
| RefGenes | NM_152710.2, | |
| Description | protein SPATIALprotein TBATAstromal protein associated with thymii and lymph node homologthymus, brain and testes-associated protein | |
| Modification date | 20141207 | |
| dbXrefs | MIM : 612640 | |
| HGNC : HGNC | ||
| Ensembl : ENSG00000166220 | ||
| HPRD : 08500 | ||
| Vega : OTTHUMG00000018413 | ||
| Protein | UniProt: go to UniProt's Cross Reference DB Table | |
| Expression | CleanEX: HS_TBATA | |
| BioGPS: 219793 | ||
| Pathway | NCI Pathway Interaction Database: TBATA | |
| KEGG: TBATA | ||
| REACTOME: TBATA | ||
| Pathway Commons: TBATA | ||
| Context | iHOP: TBATA | |
| ligand binding site mutation search in PubMed: TBATA | ||
| UCL Cancer Institute: TBATA | ||
| Assigned class in TissGDB* | A | |
| Included tissue-specific gene expression resources | HPA,TiGER,GTEx | |
| Specific-tissues in normal samples (assigned by TissGDB using HPA, TiGER, and GTEx) | TestisThymus | |
| Cancer types related to the specific-tissues in cancer samples (assigned by TissGDB using TCGA) | TGCTTHYM | |
| Reference showing the relevant tissue of TBATA | Dynamic distribution of Spatial during mouse spermatogenesis and its interaction with the kinesin KIF17b. Exp Cell Res. 2007 Feb 1;313(3):614-26. Epub 2006 Nov 29. (pmid:20937703) go to articlePeptides presented by HLA class I molecules in the human thymus. J Proteomics. 2013 Dec 6;94:23-36. doi: 10.1016/j.jprot.2013.08.023. Epub 2013 Sep 9. (pmid:24029068) go to article | |
| Description by TissGene annotations | ||
| * Class A consists of genes with literature evidence and is part of the cTissGenes. Class B consists of only cTissGenes without additional evidence. The remaining genes belong to Class C. |
| Gene ontology having evidence of Inferred from Direct Assay (IDA) from Entrez |
| GO ID | GO term | PubMed ID |
| Top |
| TissGeneExp for TBATA |
| Gene expressions across 28 cancer types (X-axis: cancer type and Y-axis: log2(norm_counts+1)) (TCGA IlluminaHiSeq_RNASeqV2, pan-cancer normalized log2(norm_counts+1) data, version 2016-08-16) |
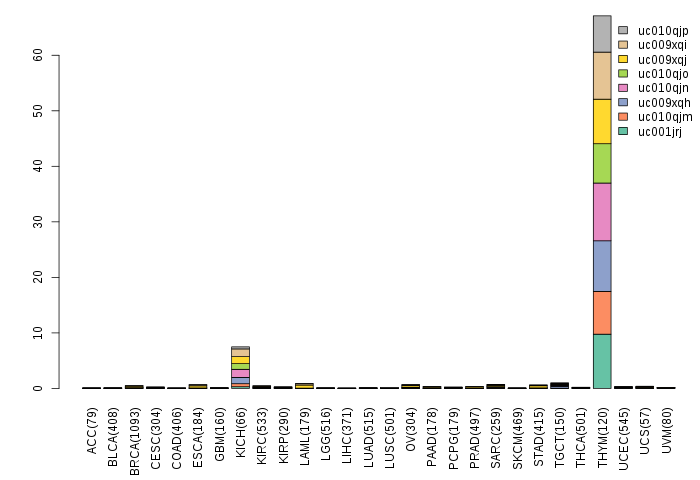
| Gene isoform expressions across 28 cancer types (X-axis: cancer type and Y-axis: log2(norm_counts+1)) (TCGA pan-cancer tcga_rsem_isoform_tpm, version 2016-09-01) |
 |
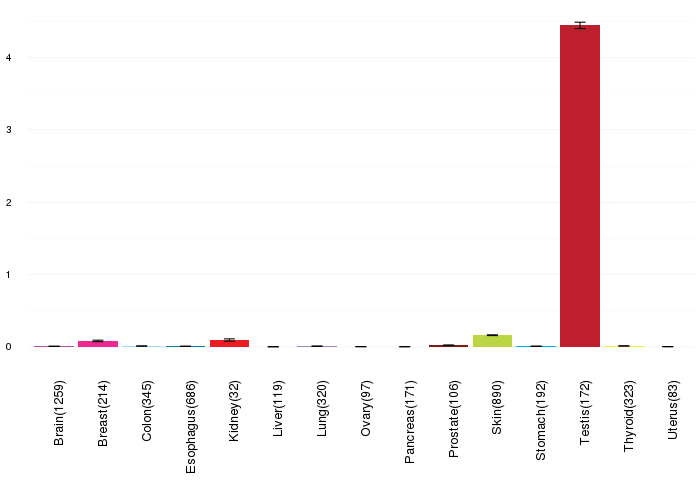
| Gene expressions across normal tissues of GTEx data (GTEx GTEx_Analysis_v6_RNA-seq_RNA-SeQCv1.1.8_gene_rpkm.gct) - Here, we shows the matched tissue types only among our 28 cancer types. |
 |
| Different expressions across 14 cancer types with more than 10 samples between matched tumors and normals (X-axis: cancer type and Y-axis: log2(norm_counts+1)) (TCGA IlluminaHiSeq_RNASeqV2, pan-cancer normalized log2(norm_counts+1) data, version 2016-08-16) |
| - Significantly differentially expressed cancer types and information. (|Fold change|>1 and FDR<0.05) |
| Cancer type | Mean(exp) in tumor | Mean(exp) in matched normal | Log2FC | P-val. | FDR |
| Top |
| TissGene-miRNA for TBATA |
| Significantly anti-correlated miRNAs of TissGene across 28 cancer types (Gene-miRNA relations from TargetScanHuman Relsease 7.1, Conserved_Site_Context_Scores.txt.zip, 06.01.2016) (TCGA IlluminaHiSeq_miRNASeq, log2(RPM+1) data, version 2016-11-21) (TCGA IlluminaHiSeq_RNASeqV2, log2(normalized_count+1) data, version 2016-08-16) (Spearman’s Rank Correlation (p-value<0.05 and coefficient<-0.25)) |
| Cancer type | miRNA id | miRNA accession | P-val. | Coeff. | # samples |
| Top |
| TissGeneMut for TBATA |
| TissGeneSNV for TBATA |
| nsSNV counts per each loci. Different colors of circles represent different cancer types. Circle size denotes number of samples. (TCGA somatic mutation (SNPs and small INDELs) data, version 2016-04-25) * Click on the image to enlarge it in a new window. |
 |
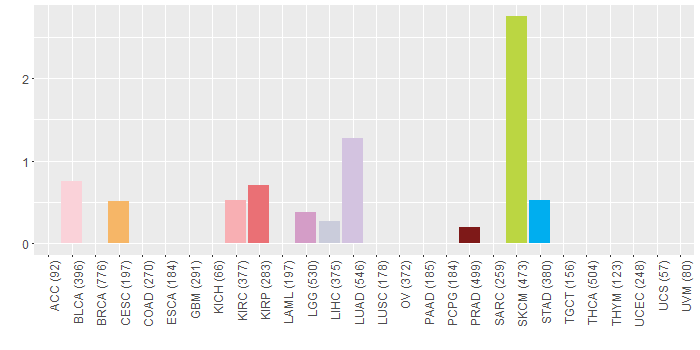
| Somatic nucleotide variants of TissGene across 28 cancer types (X-axis: cancer type and Y-axis: % of mutated samples) The numbers in parentheses are numbers of samples with mutation (nsSNVs). (TCGA somatic mutation (SNPs and small INDELs) data, version 2016-04-25) |
 |
| - nsSNVs sorted by frequency. |
| AAchange | Cancer type | # samples |
| p.E321K | SKCM | 2 |
| p.G181E | SKCM | 1 |
| p.V293L | LUAD | 1 |
| p.R51Q | SKCM | 1 |
| p.E164K | SKCM | 1 |
| p.P309L | STAD | 1 |
| p.K39T | LGG | 1 |
| p.S25* | CESC | 1 |
| p.I314V | KIRC | 1 |
| p.Y253H | SKCM | 1 |
| p.L266M | DLBC | 1 |
| p.Q206* | LUAD | 1 |
| p.P132S | LUAD | 1 |
| p.Q227* | SKCM | 1 |
| p.R202S | BLCA | 1 |
| p.R51W | BLCA | 1 |
| p.E299* | SKCM | 1 |
| p.E299X | SKCM | 1 |
| p.S204P | LIHC | 1 |
| p.E174K | SKCM | 1 |
| p.R27H | CHOL | 1 |
| p.I43V | KIRC | 1 |
| p.G218R | SKCM | 1 |
| p.P106S | LUAD | 1 |
| p.P138S | LUAD | 1 |
| p.S126C | BLCA | 1 |
| p.E341X | STAD | 1 |
| p.R27C | LGG | 1 |
| p.H205L | SKCM | 1 |
| p.R202L | LUAD | 1 |
| p.R155W | SKCM | 1 |
| p.E295D | KIRP | 1 |
| p.E341* | STAD | 1 |
| p.P297S | SKCM | 1 |
| p.E179G | KIRP | 1 |
| p.R27H | PRAD | 1 |
| p.Q227X | SKCM | 1 |
| p.D104Y | LUAD | 1 |
| Top |
| TissGeneCNV for TBATA |
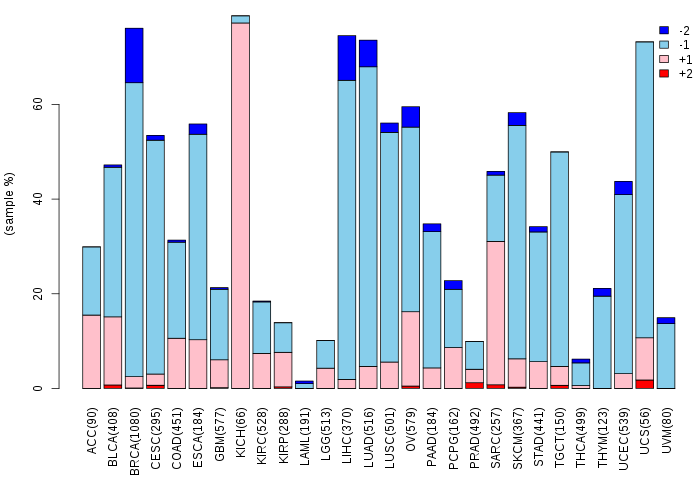
| Copy number variations of TissGene across 28 cancer types (X-axis: cancer type and Y-axis: % of CNV samples) (TCGA Gistic2_CopyNumber_Gistic2_all_data_by_genes, Gistic2 copy number data, version 2016-08-16) |
 |
| Top |
| TissGeneFusions for TBATA |
| Fusion genes including TissGene (ChimerDB 3.0, 2016-12-01 and TCGA fusion Portal 2015-12-01) |
| Database | Src | Cancer type | Sample | Fusion gene | ORF | 5'-gene BP | 3'-gene BP |
| Top |
| TissGeneNet for TBATA |
| Co-expressed gene networks based on protein-protein interaction data (CePIN) (TCGA IlluminaHiSeq_RNASeqV2, pan-cancer normalized log2(norm_counts+1) data, version 2016-08-16) (PINA2 ppi data) |
| Top |
| TissGeneProg for TBATA |
| Kaplan-Meier plots with logrank tests of overall survival (OS) using 28 cancer types (TCGA IlluminaHiSeq_RNASeqV2, pan-cancer normalized log2(norm_counts+1) data, version 2016-08-16) (TCGA clinicalMatrix, phenotype data, version 2016-04-27) * Click on the image to enlarge it in a new window. |
| Kaplan-Meier plots with logrank test of relapse free survival (RFS) using 28 cancer types (TCGA IlluminaHiSeq_RNASeqV2, pan-cancer normalized log2(norm_counts+1) data, version 2016-08-16) (TCGA clinicalMatrix, phenotype data, version 2016-04-27) * Click on the image enlarge it in a new window. |
| Forest plot of Cox proportional hazard ratio (HR) and 95% CI of overall survival (OS) using 28 cancer types (TCGA IlluminaHiSeq_RNASeqV2, pan-cancer normalized log2(norm_counts+1) data, version 2016-08-16) (TCGA clinicalMatrix, phenotype data, version 2016-04-27) * Click on the image enlarge it in a new window. |
| Forest plot of Cox proportional hazard ratio (HR) and 95% CI of relapse free survival (RFS) using 28 cancer types (TCGA IlluminaHiSeq_RNASeqV2, pan-cancer normalized log2(norm_counts+1) data, version 2016-08-16) (TCGA clinicalMatrix, phenotype data, version 2016-04-27) * Click on the image enlarge it in a new window. |
| Top |
| TissGeneClin for TBATA |
| TissGeneDrug for TBATA |
| Drug information targeting TissGene (DrugBank Version 5.0.6, 2017-04-01) |
| DrugBank ID | Drug name | Drug activity | Drug type | Drug status |
| Top |
| TissGeneDisease for TBATA |
| Disease information associated with TissGene (DisGeNet, 2016-06-01) |
| Disease ID | Disease name | # pubmeds | Source |
| umls:C0019693 | HIV Infections | 2 | BeFree |
| umls:C0006142 | Malignant neoplasm of breast | 1 | BeFree |
| umls:C0026769 | Multiple Sclerosis | 1 | BeFree,GAD,LHGDN |
| umls:C0678222 | Breast Carcinoma | 1 | BeFree |
|
Copyright 2016-Present - The University of Texas Health Science Center at Houston (UTHealth) Web File Viewing | How to Report, Fraud, Waste and Abuse | State of Texas | Statewide Search | Texas Homeland Security | Site Policies |