 |
| |
| |
| |
| |
| |
| |
|

| TissGeneSummary for MS4A15 |
 Gene summary Gene summary |
| Basic gene information | Gene symbol | MS4A15 |
| Gene name | membrane-spanning 4-domains, subfamily A, member 15 | |
| Synonyms | - | |
| Cytomap | UCSC genome browser: 11q12.2 | |
| Type of gene | protein-coding | |
| RefGenes | NM_001098835.1, NM_001278242.1,NM_152717.2,NR_103481.1, | |
| Description | membrane-spanning 4-domains subfamily A member 15 | |
| Modification date | 20141207 | |
| dbXrefs | HGNC : HGNC | |
| Ensembl : ENSG00000166961 | ||
| HPRD : 17532 | ||
| Vega : OTTHUMG00000167688 | ||
| Protein | UniProt: go to UniProt's Cross Reference DB Table | |
| Expression | CleanEX: HS_MS4A15 | |
| BioGPS: 219995 | ||
| Pathway | NCI Pathway Interaction Database: MS4A15 | |
| KEGG: MS4A15 | ||
| REACTOME: MS4A15 | ||
| Pathway Commons: MS4A15 | ||
| Context | iHOP: MS4A15 | |
| ligand binding site mutation search in PubMed: MS4A15 | ||
| UCL Cancer Institute: MS4A15 | ||
| Assigned class in TissGDB* | C | |
| Included tissue-specific gene expression resources | HPA,GTEx | |
| Specific-tissues in normal samples (assigned by TissGDB using HPA, TiGER, and GTEx) | Lung | |
| Cancer types related to the specific-tissues in cancer samples (assigned by TissGDB using TCGA) | LUAD,LUSC | |
| Reference showing the relevant tissue of MS4A15 | ||
| Description by TissGene annotations | ||
| * Class A consists of genes with literature evidence and is part of the cTissGenes. Class B consists of only cTissGenes without additional evidence. The remaining genes belong to Class C. |
| Gene ontology having evidence of Inferred from Direct Assay (IDA) from Entrez |
| GO ID | GO term | PubMed ID |
| Top |
| TissGeneExp for MS4A15 |
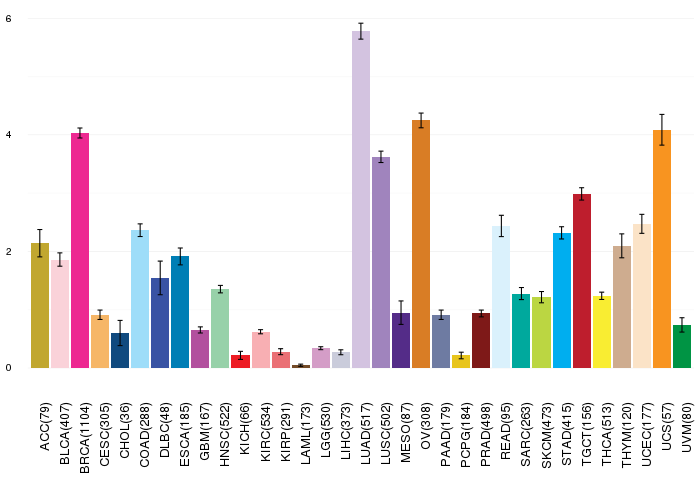
| Gene expressions across 28 cancer types (X-axis: cancer type and Y-axis: log2(norm_counts+1)) (TCGA IlluminaHiSeq_RNASeqV2, pan-cancer normalized log2(norm_counts+1) data, version 2016-08-16) |
 |
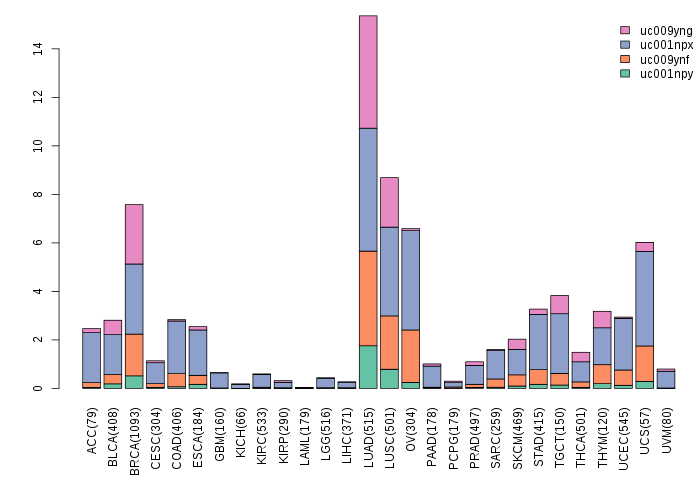
| Gene isoform expressions across 28 cancer types (X-axis: cancer type and Y-axis: log2(norm_counts+1)) (TCGA pan-cancer tcga_rsem_isoform_tpm, version 2016-09-01) |
 |
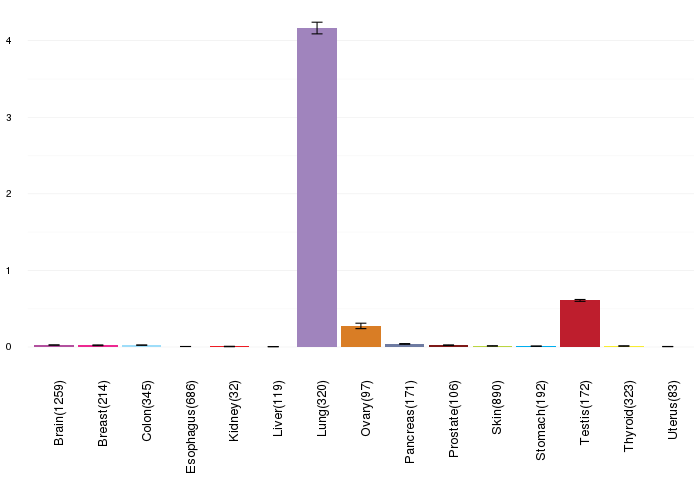
| Gene expressions across normal tissues of GTEx data (GTEx GTEx_Analysis_v6_RNA-seq_RNA-SeQCv1.1.8_gene_rpkm.gct) - Here, we shows the matched tissue types only among our 28 cancer types. |
 |
| Different expressions across 14 cancer types with more than 10 samples between matched tumors and normals (X-axis: cancer type and Y-axis: log2(norm_counts+1)) (TCGA IlluminaHiSeq_RNASeqV2, pan-cancer normalized log2(norm_counts+1) data, version 2016-08-16) |
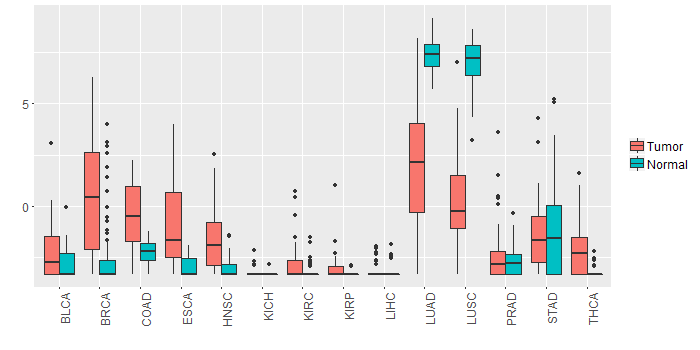 |
| - Significantly differentially expressed cancer types and information. (|Fold change|>1 and FDR<0.05) |
| Cancer type | Mean(exp) in tumor | Mean(exp) in matched normal | Log2FC | P-val. | FDR |
| COAD | -0.570570005 | -2.242962312 | 1.672392308 | 2.00E-05 | 8.54E-05 |
| HNSC | -1.628336642 | -3.001706409 | 1.373369767 | 8.69E-07 | 6.70E-06 |
| LUSC | 0.409183012 | 6.939469286 | -6.530286275 | 6.32E-31 | 3.16E-29 |
| BRCA | 0.51535071 | -2.583792272 | 3.099142982 | 4.08E-20 | 2.92E-19 |
| THCA | -2.003450122 | -3.242095885 | 1.238645763 | 3.14E-09 | 1.68E-08 |
| LUAD | 2.062177873 | 7.334126149 | -5.271948276 | 7.72E-19 | 1.24E-17 |
| Top |
| TissGene-miRNA for MS4A15 |
| Significantly anti-correlated miRNAs of TissGene across 28 cancer types (Gene-miRNA relations from TargetScanHuman Relsease 7.1, Conserved_Site_Context_Scores.txt.zip, 06.01.2016) (TCGA IlluminaHiSeq_miRNASeq, log2(RPM+1) data, version 2016-11-21) (TCGA IlluminaHiSeq_RNASeqV2, log2(normalized_count+1) data, version 2016-08-16) (Spearman’s Rank Correlation (p-value<0.05 and coefficient<-0.25)) |
| Cancer type | miRNA id | miRNA accession | P-val. | Coeff. | # samples |
| Top |
| TissGeneMut for MS4A15 |
| TissGeneSNV for MS4A15 |
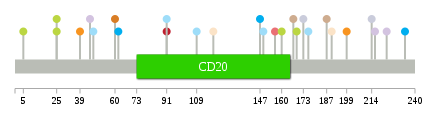
| nsSNV counts per each loci. Different colors of circles represent different cancer types. Circle size denotes number of samples. (TCGA somatic mutation (SNPs and small INDELs) data, version 2016-04-25) * Click on the image to enlarge it in a new window. |
 |
 |
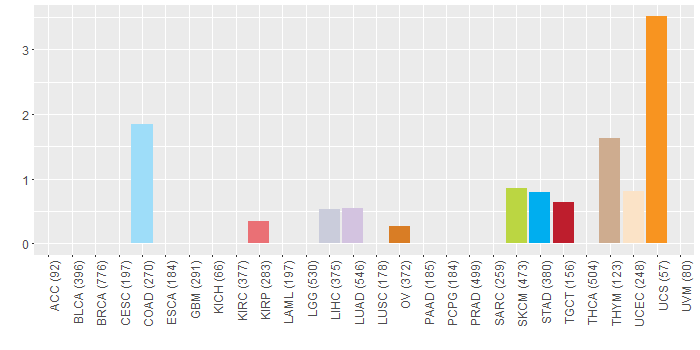
| Somatic nucleotide variants of TissGene across 28 cancer types (X-axis: cancer type and Y-axis: % of mutated samples) The numbers in parentheses are numbers of samples with mutation (nsSNVs). (TCGA somatic mutation (SNPs and small INDELs) data, version 2016-04-25) |
 |
| - nsSNVs sorted by frequency. |
| AAchange | Cancer type | # samples |
| p.P25S | SKCM | 1 |
| p.V91L | TGCT | 1 |
| p.L176F | COAD | 1 |
| p.D169N | SKCM | 1 |
| p.D160N | SKCM | 1 |
| p.I119V | UCEC | 1 |
| p.L173M | LIHC | 1 |
| p.D216Y | LUAD | 1 |
| p.D167Y | THYM | 1 |
| p.L60F | OV | 1 |
| p.P62S | STAD | 1 |
| p.A234T | STAD | 1 |
| p.S214N | LIHC | 1 |
| p.L47R | COAD | 1 |
| p.P5S | SKCM | 1 |
| p.I156N | KIRP | 1 |
| p.H199L | UCS | 1 |
| p.V175M | HNSC | 1 |
| p.A187V | THYM | 1 |
| p.P117S | READ | 1 |
| p.A190T | UCEC | 1 |
| p.I39S | UCS | 1 |
| p.G9V | HNSC | 1 |
| p.P25L | SKCM | 1 |
| p.V147I | STAD | 1 |
| p.P45T | LUAD | 1 |
| p.S214N | HNSC | 1 |
| p.A149P | COAD | 1 |
| p.V82M | READ | 1 |
| p.V109I | COAD | 1 |
| p.V91M | COAD | 1 |
| p.A223V | LUAD | 1 |
| Top |
| TissGeneCNV for MS4A15 |
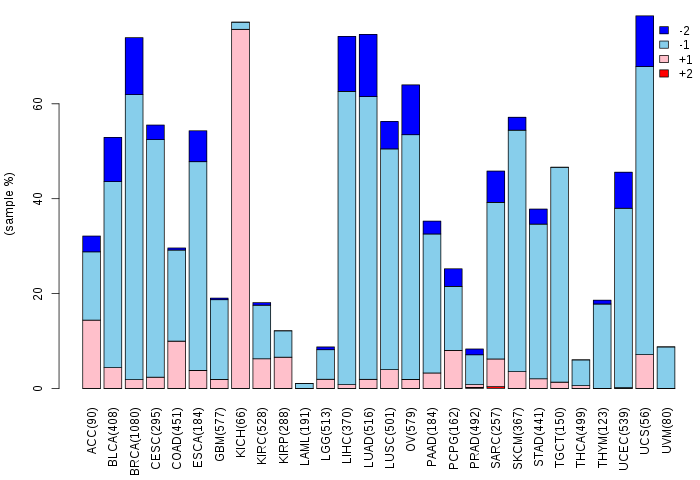
| Copy number variations of TissGene across 28 cancer types (X-axis: cancer type and Y-axis: % of CNV samples) (TCGA Gistic2_CopyNumber_Gistic2_all_data_by_genes, Gistic2 copy number data, version 2016-08-16) |
 |
| Top |
| TissGeneFusions for MS4A15 |
| Fusion genes including TissGene (ChimerDB 3.0, 2016-12-01 and TCGA fusion Portal 2015-12-01) |
| Database | Src | Cancer type | Sample | Fusion gene | ORF | 5'-gene BP | 3'-gene BP |
| Chimerdb3.0 | FusionScan | PRAD | TCGA-HC-7209-01A | STX3-MS4A15 | In-Frame | chr11:59523108 | chr11:60535039 |
| Chimerdb3.0 | TopHat-Fusion | PRAD | TCGA-HC-7209-01A | STX3-MS4A15 | In-Frame | chr11:59523107 | chr11:60535005 |
| Chimerdb3.0 | TopHat-Fusion | PRAD | TCGA-HC-7209-01A | STX3-MS4A15 | In-Frame | chr11:59523107 | chr11:60535039 |
| Chimerdb3.0 | TopHat-Fusion | PRAD | TCGA-HC-7209-01A | STX3-MS4A15 | In-Frame | chr11:59523107 | chr11:60538763 |
| TCGAfusionPortal | PRADA | HNSC | TCGA-CV-5440-01A | FHOD3-MS4A15 | CDS-5UTR | Chr18:34267141 | Chr11:60531179 |
| Top |
| TissGeneNet for MS4A15 |
| Co-expressed gene networks based on protein-protein interaction data (CePIN) (TCGA IlluminaHiSeq_RNASeqV2, pan-cancer normalized log2(norm_counts+1) data, version 2016-08-16) (PINA2 ppi data) |
| Top |
| TissGeneProg for MS4A15 |
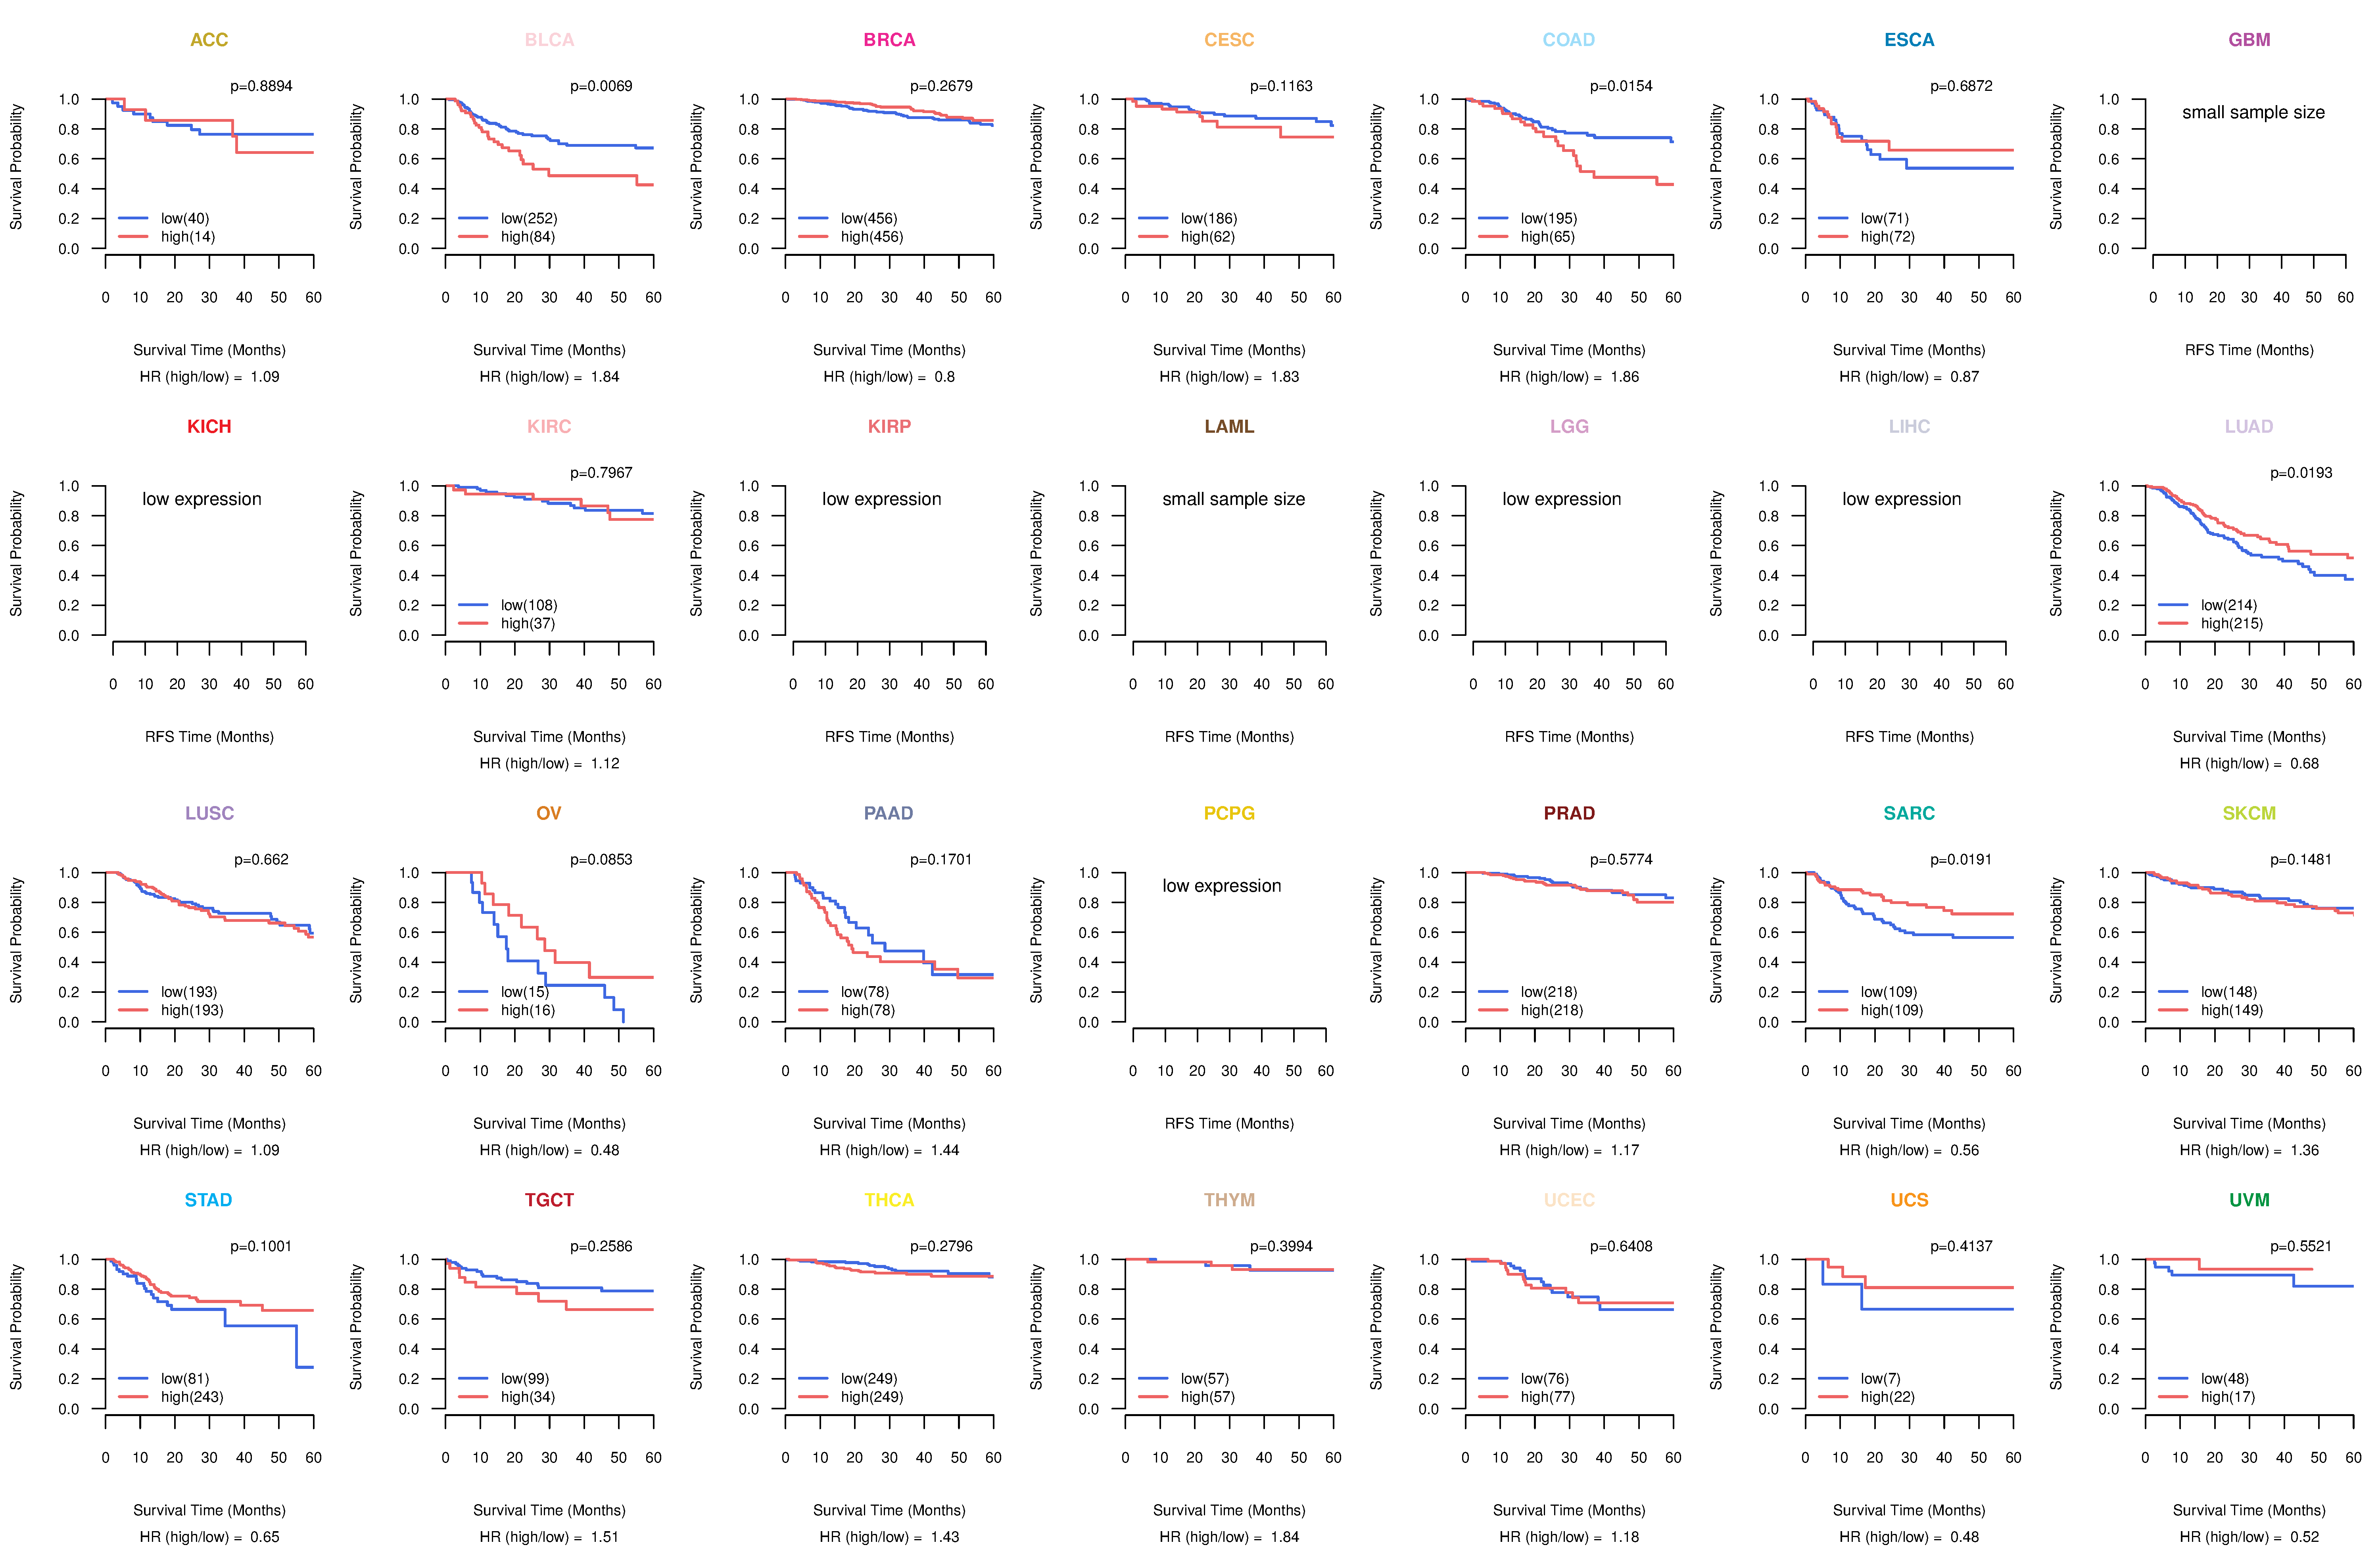
| Kaplan-Meier plots with logrank tests of overall survival (OS) using 28 cancer types (TCGA IlluminaHiSeq_RNASeqV2, pan-cancer normalized log2(norm_counts+1) data, version 2016-08-16) (TCGA clinicalMatrix, phenotype data, version 2016-04-27) * Click on the image to enlarge it in a new window. |
 |
| Kaplan-Meier plots with logrank test of relapse free survival (RFS) using 28 cancer types (TCGA IlluminaHiSeq_RNASeqV2, pan-cancer normalized log2(norm_counts+1) data, version 2016-08-16) (TCGA clinicalMatrix, phenotype data, version 2016-04-27) * Click on the image enlarge it in a new window. |
 |
| Forest plot of Cox proportional hazard ratio (HR) and 95% CI of overall survival (OS) using 28 cancer types (TCGA IlluminaHiSeq_RNASeqV2, pan-cancer normalized log2(norm_counts+1) data, version 2016-08-16) (TCGA clinicalMatrix, phenotype data, version 2016-04-27) * Click on the image enlarge it in a new window. |
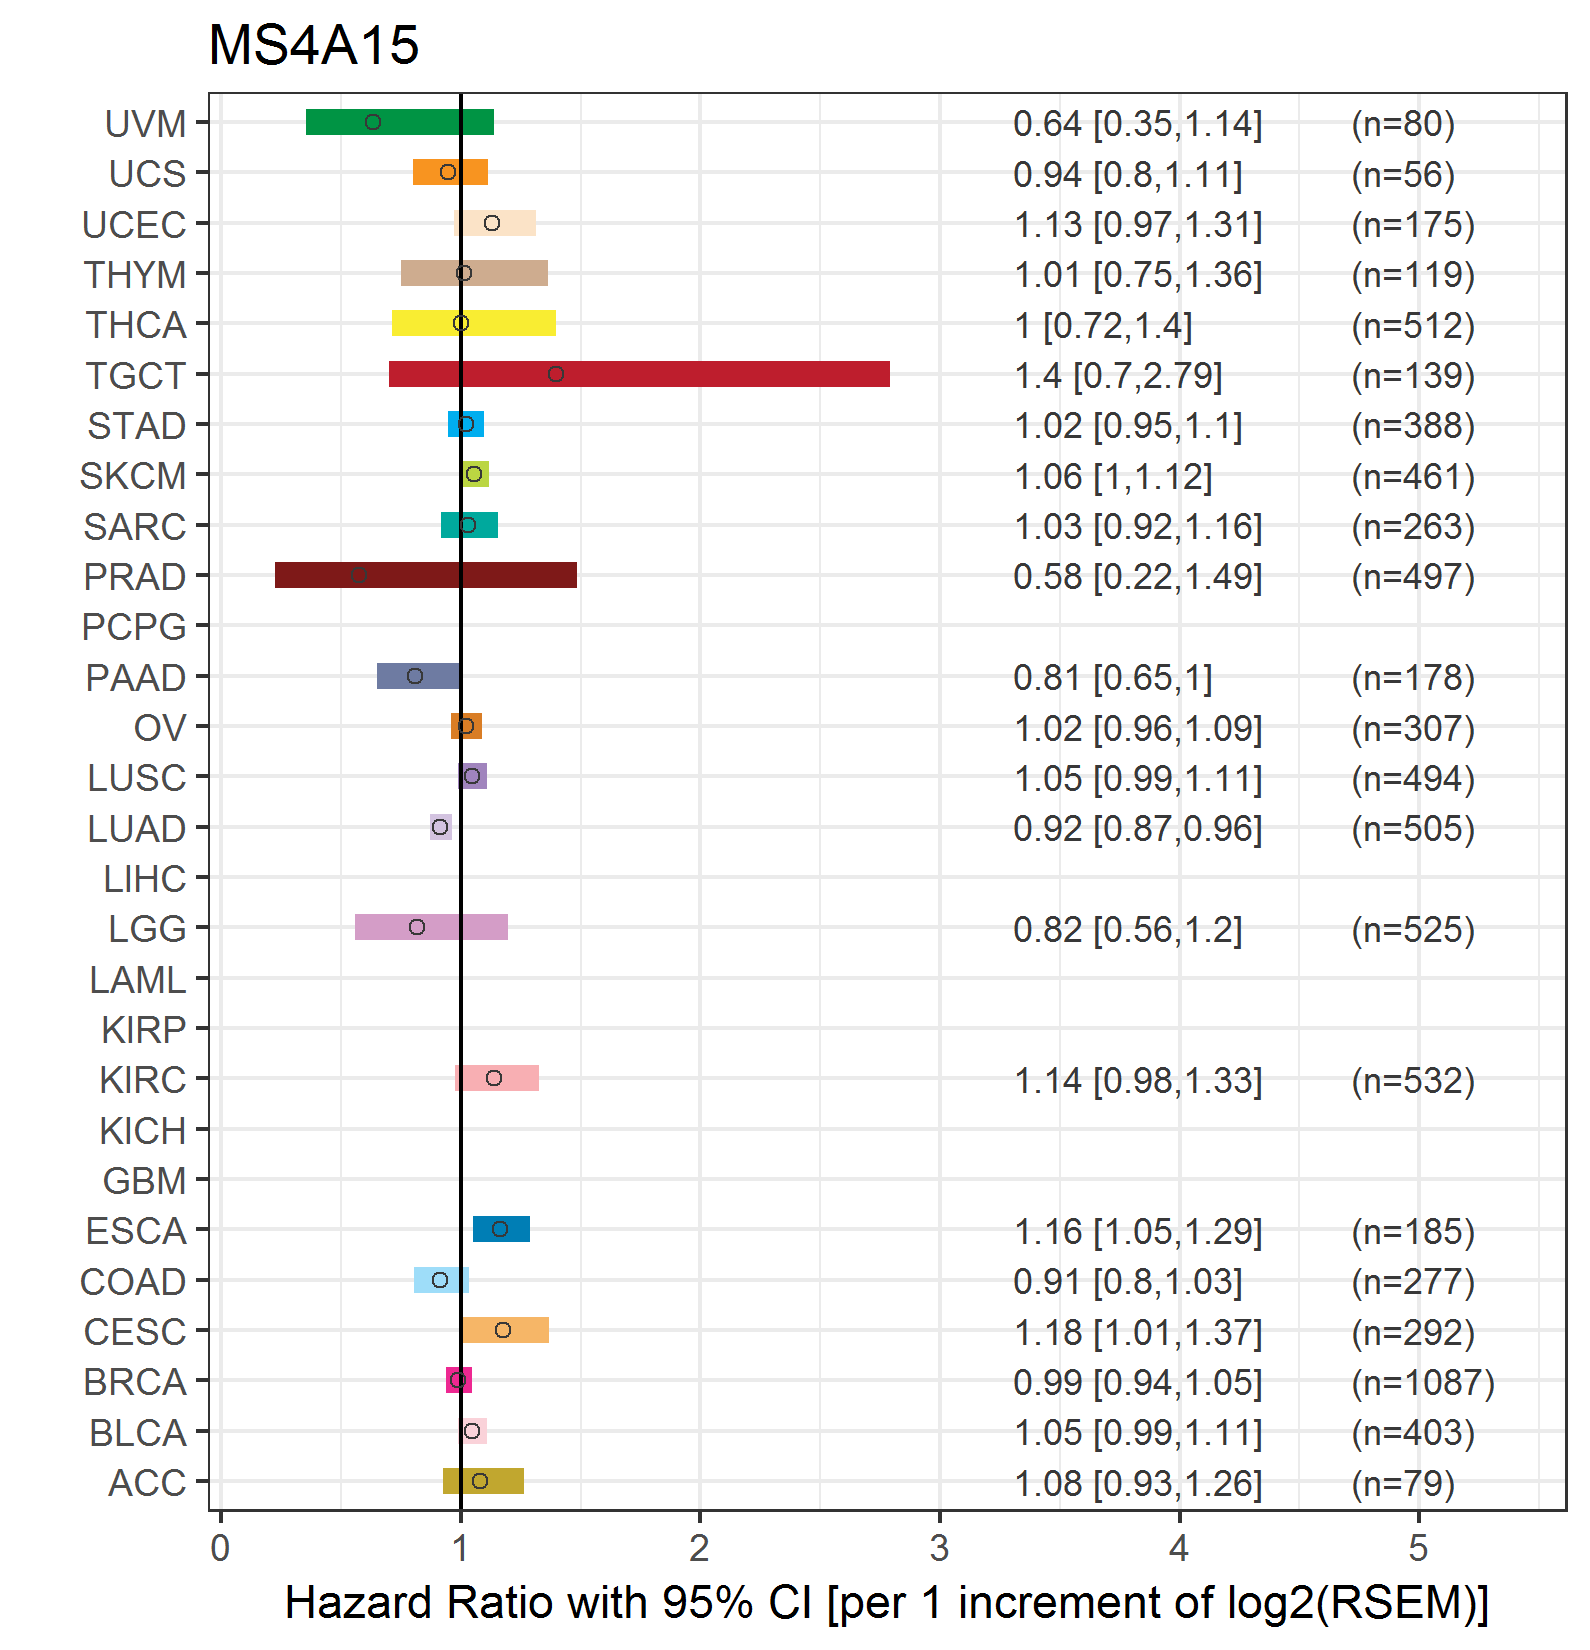 |
| Forest plot of Cox proportional hazard ratio (HR) and 95% CI of relapse free survival (RFS) using 28 cancer types (TCGA IlluminaHiSeq_RNASeqV2, pan-cancer normalized log2(norm_counts+1) data, version 2016-08-16) (TCGA clinicalMatrix, phenotype data, version 2016-04-27) * Click on the image enlarge it in a new window. |
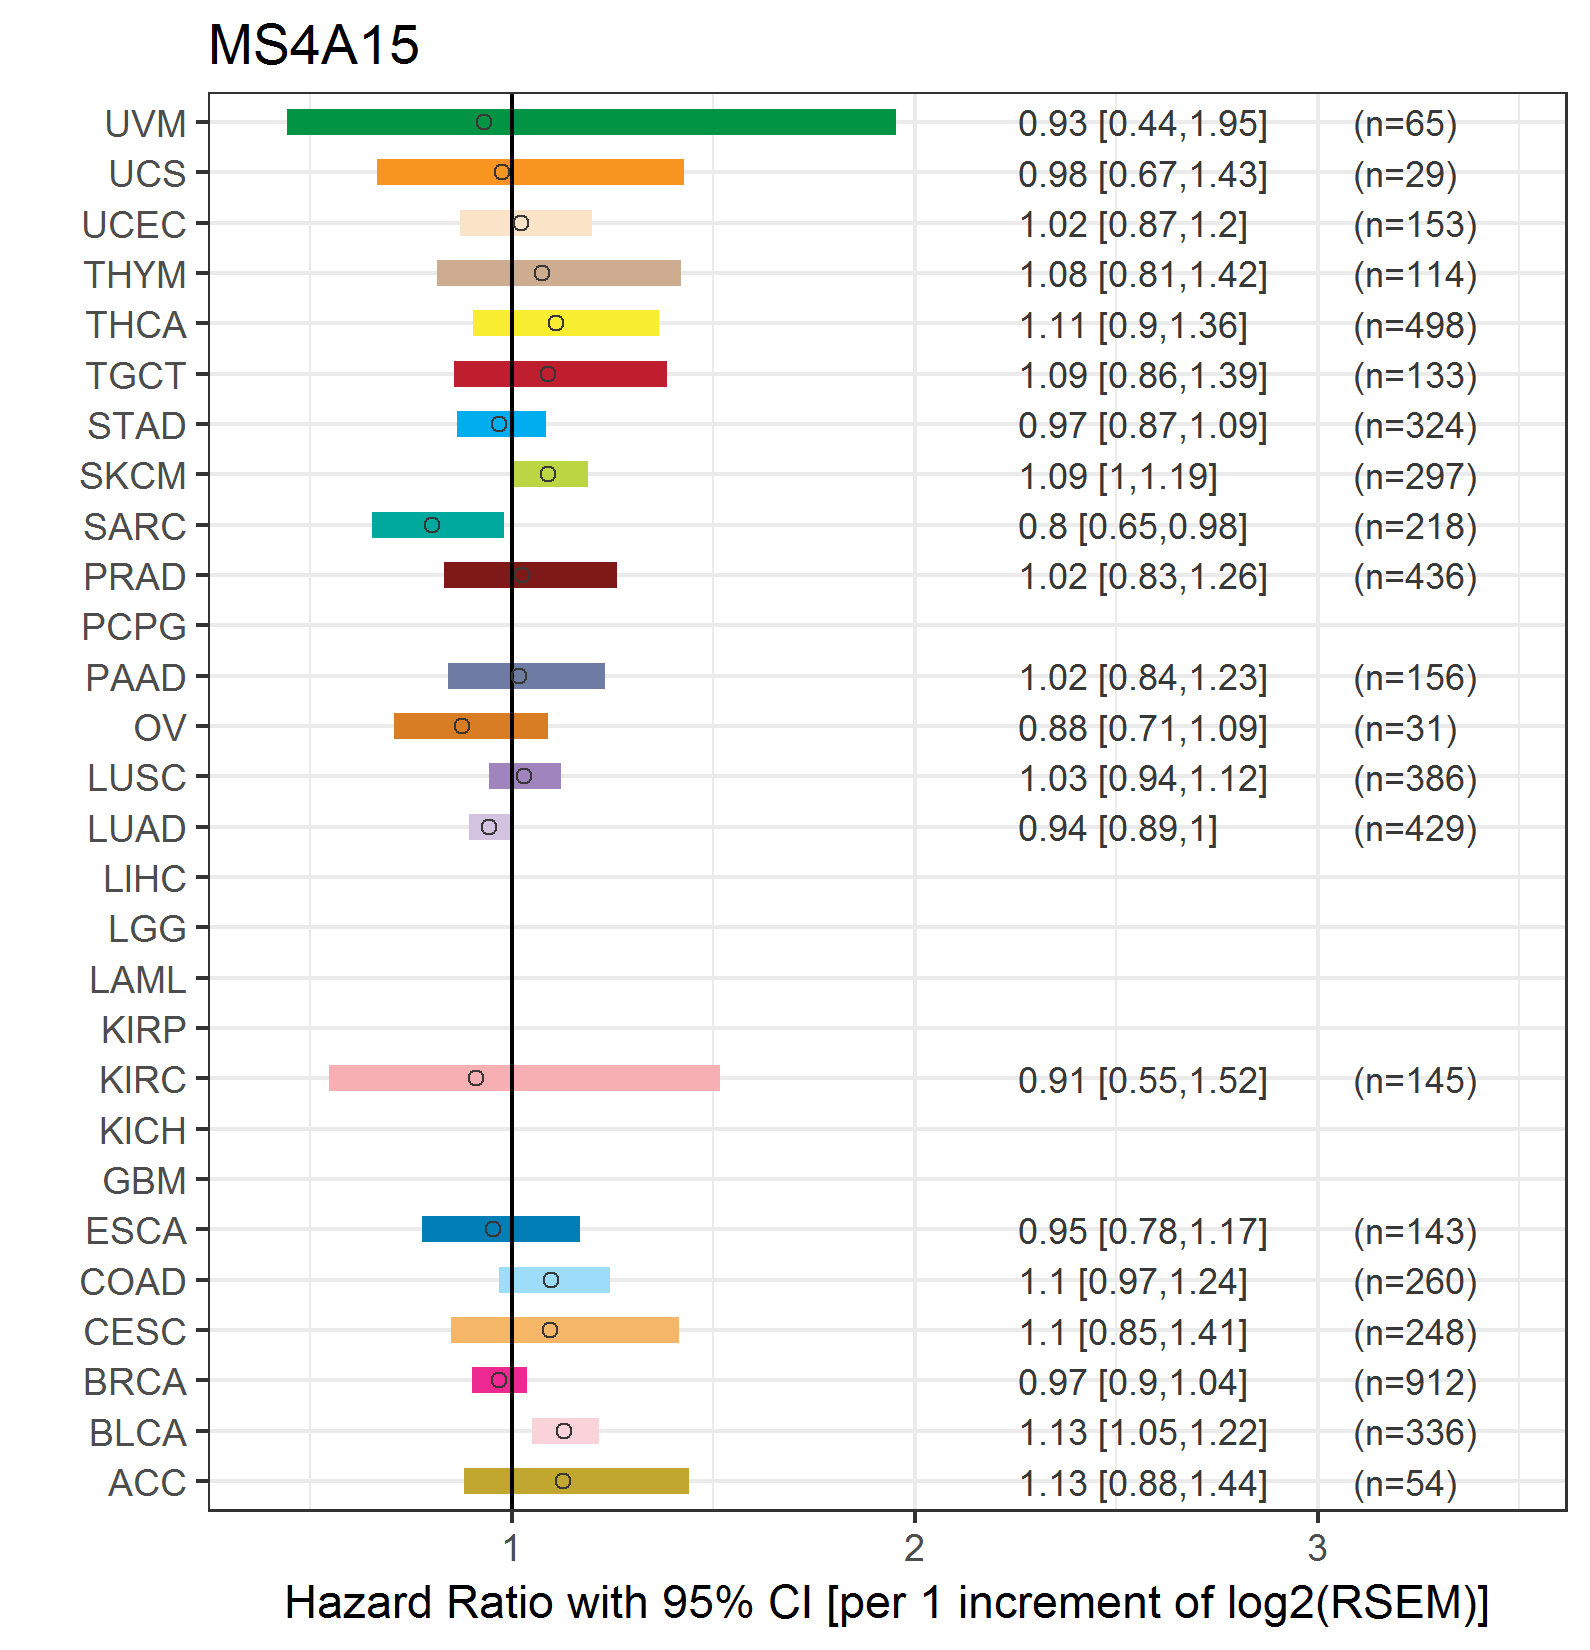 |
| Top |
| TissGeneClin for MS4A15 |
| TissGeneDrug for MS4A15 |
| Drug information targeting TissGene (DrugBank Version 5.0.6, 2017-04-01) |
| DrugBank ID | Drug name | Drug activity | Drug type | Drug status |
| Top |
| TissGeneDisease for MS4A15 |
| Disease information associated with TissGene (DisGeNet, 2016-06-01) |
| Disease ID | Disease name | # pubmeds | Source |
|
Copyright 2016-Present - The University of Texas Health Science Center at Houston (UTHealth) Web File Viewing | How to Report, Fraud, Waste and Abuse | State of Texas | Statewide Search | Texas Homeland Security | Site Policies |