 |
| |
| |
| |
| |
| |
| |
|

| TissGeneSummary for ATOH7 |
 Gene summary Gene summary |
| Basic gene information | Gene symbol | ATOH7 |
| Gene name | atonal homolog 7 (Drosophila) | |
| Synonyms | Math5|NCRNA|PHPVAR|RNANC|bHLHa13 | |
| Cytomap | UCSC genome browser: 10q21.3|10q21.3-q22.1 | |
| Type of gene | protein-coding | |
| RefGenes | NM_145178.3, | |
| Description | class A basic helix-loop-helix protein 13helix-loop-helix protein hATH-5protein atonal homolog 7 | |
| Modification date | 20141207 | |
| dbXrefs | MIM : 609875 | |
| HGNC : HGNC | ||
| Ensembl : ENSG00000179774 | ||
| HPRD : 09812 | ||
| Vega : OTTHUMG00000018346 | ||
| Protein | UniProt: go to UniProt's Cross Reference DB Table | |
| Expression | CleanEX: HS_ATOH7 | |
| BioGPS: 220202 | ||
| Pathway | NCI Pathway Interaction Database: ATOH7 | |
| KEGG: ATOH7 | ||
| REACTOME: ATOH7 | ||
| Pathway Commons: ATOH7 | ||
| Context | iHOP: ATOH7 | |
| ligand binding site mutation search in PubMed: ATOH7 | ||
| UCL Cancer Institute: ATOH7 | ||
| Assigned class in TissGDB* | C | |
| Included tissue-specific gene expression resources | HPA,GTEx | |
| Specific-tissues in normal samples (assigned by TissGDB using HPA, TiGER, and GTEx) | BrainLiver | |
| Cancer types related to the specific-tissues in cancer samples (assigned by TissGDB using TCGA) | GBM,LGGLIHC | |
| Reference showing the relevant tissue of ATOH7 | ||
| Description by TissGene annotations | ||
| * Class A consists of genes with literature evidence and is part of the cTissGenes. Class B consists of only cTissGenes without additional evidence. The remaining genes belong to Class C. |
| Gene ontology having evidence of Inferred from Direct Assay (IDA) from Entrez |
| GO ID | GO term | PubMed ID |
| Top |
| TissGeneExp for ATOH7 |
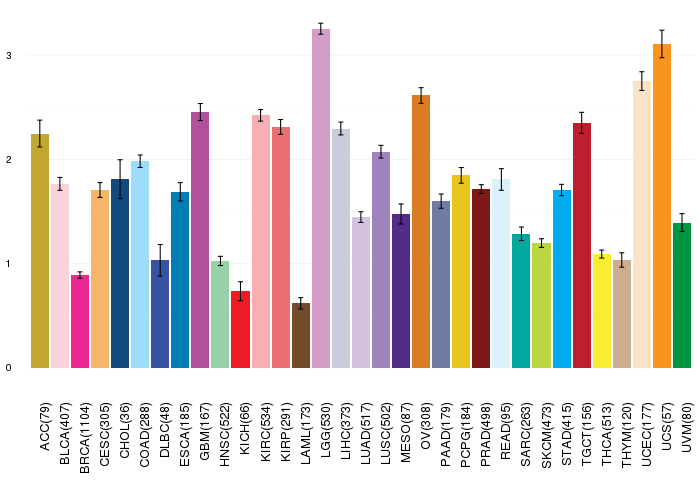
| Gene expressions across 28 cancer types (X-axis: cancer type and Y-axis: log2(norm_counts+1)) (TCGA IlluminaHiSeq_RNASeqV2, pan-cancer normalized log2(norm_counts+1) data, version 2016-08-16) |
 |
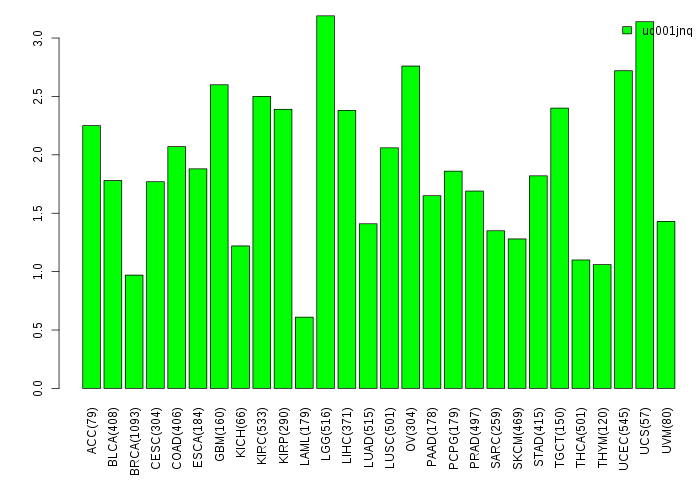
| Gene isoform expressions across 28 cancer types (X-axis: cancer type and Y-axis: log2(norm_counts+1)) (TCGA pan-cancer tcga_rsem_isoform_tpm, version 2016-09-01) |
 |
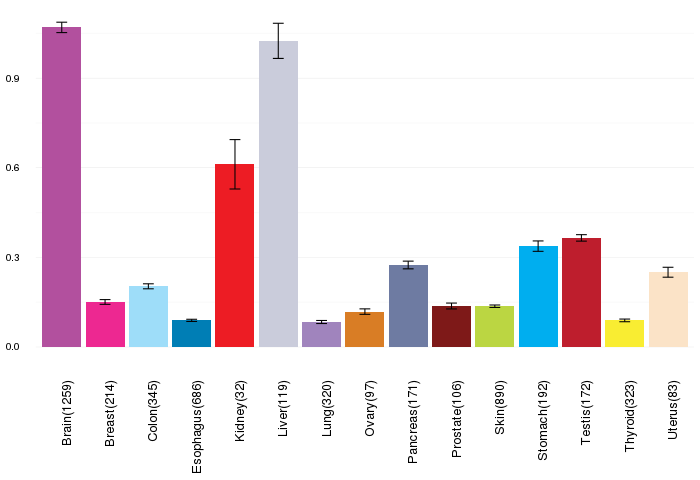
| Gene expressions across normal tissues of GTEx data (GTEx GTEx_Analysis_v6_RNA-seq_RNA-SeQCv1.1.8_gene_rpkm.gct) - Here, we shows the matched tissue types only among our 28 cancer types. |
 |
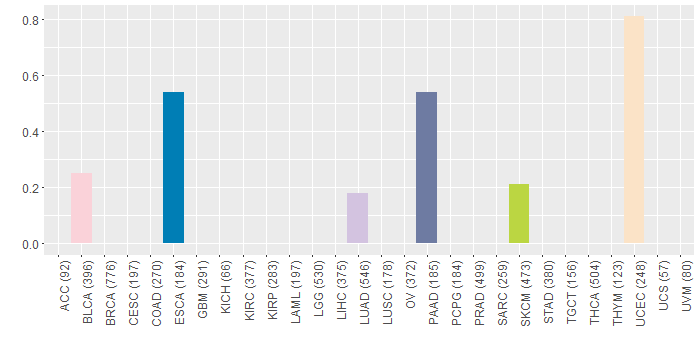
| Different expressions across 14 cancer types with more than 10 samples between matched tumors and normals (X-axis: cancer type and Y-axis: log2(norm_counts+1)) (TCGA IlluminaHiSeq_RNASeqV2, pan-cancer normalized log2(norm_counts+1) data, version 2016-08-16) |
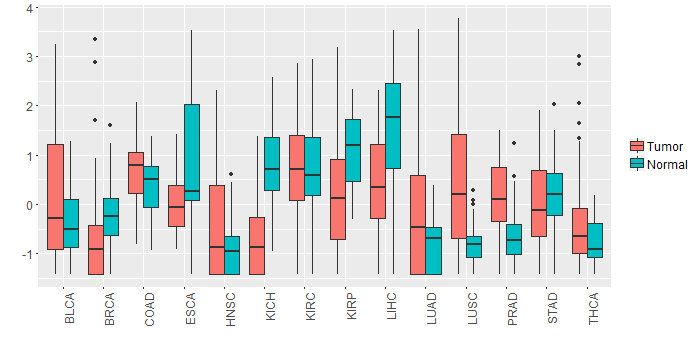 |
| - Significantly differentially expressed cancer types and information. (|Fold change|>1 and FDR<0.05) |
| Cancer type | Mean(exp) in tumor | Mean(exp) in matched normal | Log2FC | P-val. | FDR |
| KICH | -0.734714277 | 0.769665723 | -1.50438 | 1.91E-08 | 9.74E-08 |
| LUSC | 0.375688547 | -0.833719297 | 1.209407843 | 6.65E-08 | 1.91E-07 |
| LIHC | 0.410325723 | 1.642019723 | -1.231694 | 2.18E-08 | 1.77E-07 |
| Top |
| TissGene-miRNA for ATOH7 |
| Significantly anti-correlated miRNAs of TissGene across 28 cancer types (Gene-miRNA relations from TargetScanHuman Relsease 7.1, Conserved_Site_Context_Scores.txt.zip, 06.01.2016) (TCGA IlluminaHiSeq_miRNASeq, log2(RPM+1) data, version 2016-11-21) (TCGA IlluminaHiSeq_RNASeqV2, log2(normalized_count+1) data, version 2016-08-16) (Spearman’s Rank Correlation (p-value<0.05 and coefficient<-0.25)) |
| Cancer type | miRNA id | miRNA accession | P-val. | Coeff. | # samples |
| Top |
| TissGeneMut for ATOH7 |
| TissGeneSNV for ATOH7 |
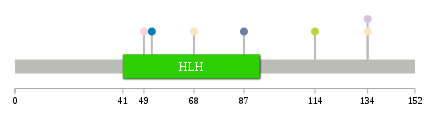
| nsSNV counts per each loci. Different colors of circles represent different cancer types. Circle size denotes number of samples. (TCGA somatic mutation (SNPs and small INDELs) data, version 2016-04-25) * Click on the image to enlarge it in a new window. |
 |
 |
| Somatic nucleotide variants of TissGene across 28 cancer types (X-axis: cancer type and Y-axis: % of mutated samples) The numbers in parentheses are numbers of samples with mutation (nsSNVs). (TCGA somatic mutation (SNPs and small INDELs) data, version 2016-04-25) |
 |
| - nsSNVs sorted by frequency. |
| AAchange | Cancer type | # samples |
| p.E49K | BLCA | 1 |
| p.N57D | DLBC | 1 |
| p.E134K | LUAD | 1 |
| p.E134Q | UCEC | 1 |
| p.S87I | PAAD | 1 |
| p.E114Q | SKCM | 1 |
| p.P68T | UCEC | 1 |
| p.R52C | ESCA | 1 |
| Top |
| TissGeneCNV for ATOH7 |
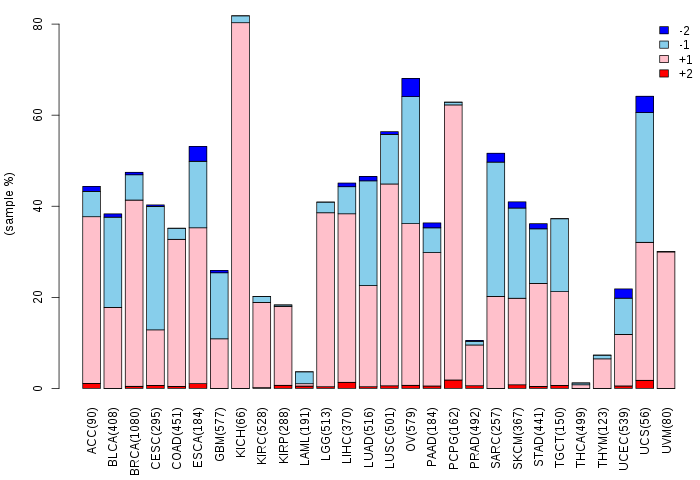
| Copy number variations of TissGene across 28 cancer types (X-axis: cancer type and Y-axis: % of CNV samples) (TCGA Gistic2_CopyNumber_Gistic2_all_data_by_genes, Gistic2 copy number data, version 2016-08-16) |
 |
| Top |
| TissGeneFusions for ATOH7 |
| Fusion genes including TissGene (ChimerDB 3.0, 2016-12-01 and TCGA fusion Portal 2015-12-01) |
| Database | Src | Cancer type | Sample | Fusion gene | ORF | 5'-gene BP | 3'-gene BP |
| Top |
| TissGeneNet for ATOH7 |
| Co-expressed gene networks based on protein-protein interaction data (CePIN) (TCGA IlluminaHiSeq_RNASeqV2, pan-cancer normalized log2(norm_counts+1) data, version 2016-08-16) (PINA2 ppi data) |
| Top |
| TissGeneProg for ATOH7 |
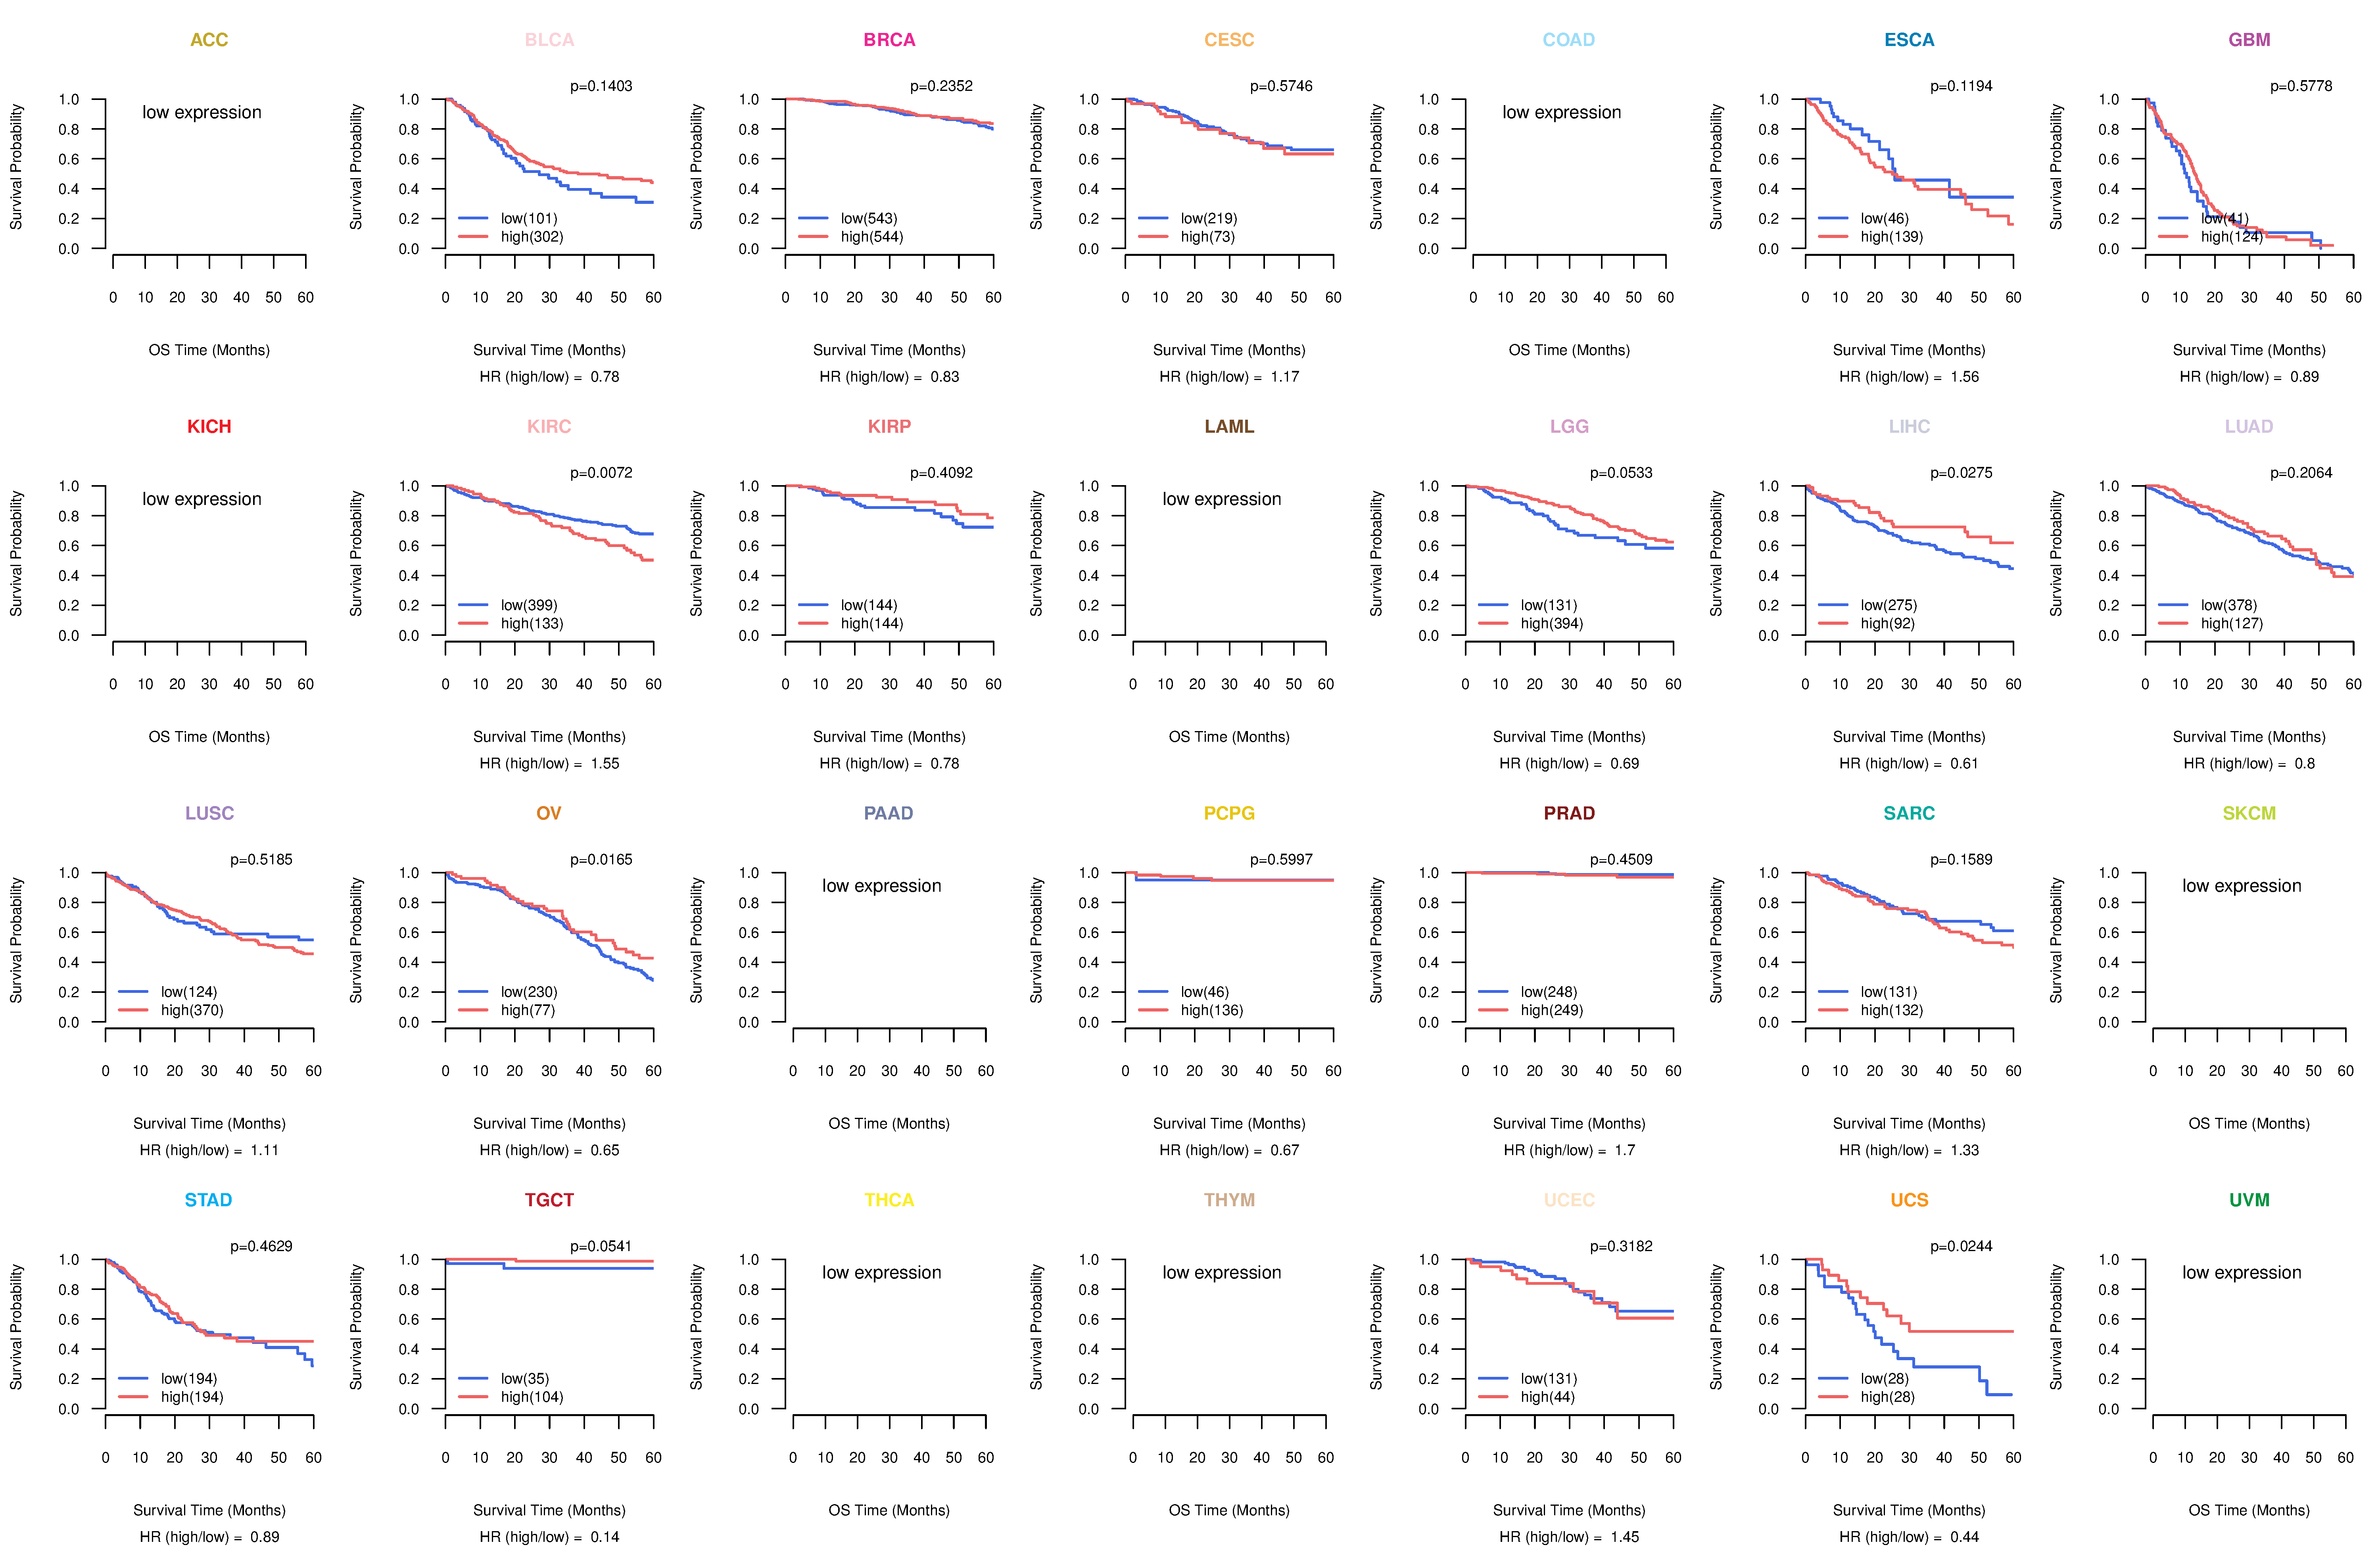
| Kaplan-Meier plots with logrank tests of overall survival (OS) using 28 cancer types (TCGA IlluminaHiSeq_RNASeqV2, pan-cancer normalized log2(norm_counts+1) data, version 2016-08-16) (TCGA clinicalMatrix, phenotype data, version 2016-04-27) * Click on the image to enlarge it in a new window. |
 |
| Kaplan-Meier plots with logrank test of relapse free survival (RFS) using 28 cancer types (TCGA IlluminaHiSeq_RNASeqV2, pan-cancer normalized log2(norm_counts+1) data, version 2016-08-16) (TCGA clinicalMatrix, phenotype data, version 2016-04-27) * Click on the image enlarge it in a new window. |
 |
| Forest plot of Cox proportional hazard ratio (HR) and 95% CI of overall survival (OS) using 28 cancer types (TCGA IlluminaHiSeq_RNASeqV2, pan-cancer normalized log2(norm_counts+1) data, version 2016-08-16) (TCGA clinicalMatrix, phenotype data, version 2016-04-27) * Click on the image enlarge it in a new window. |
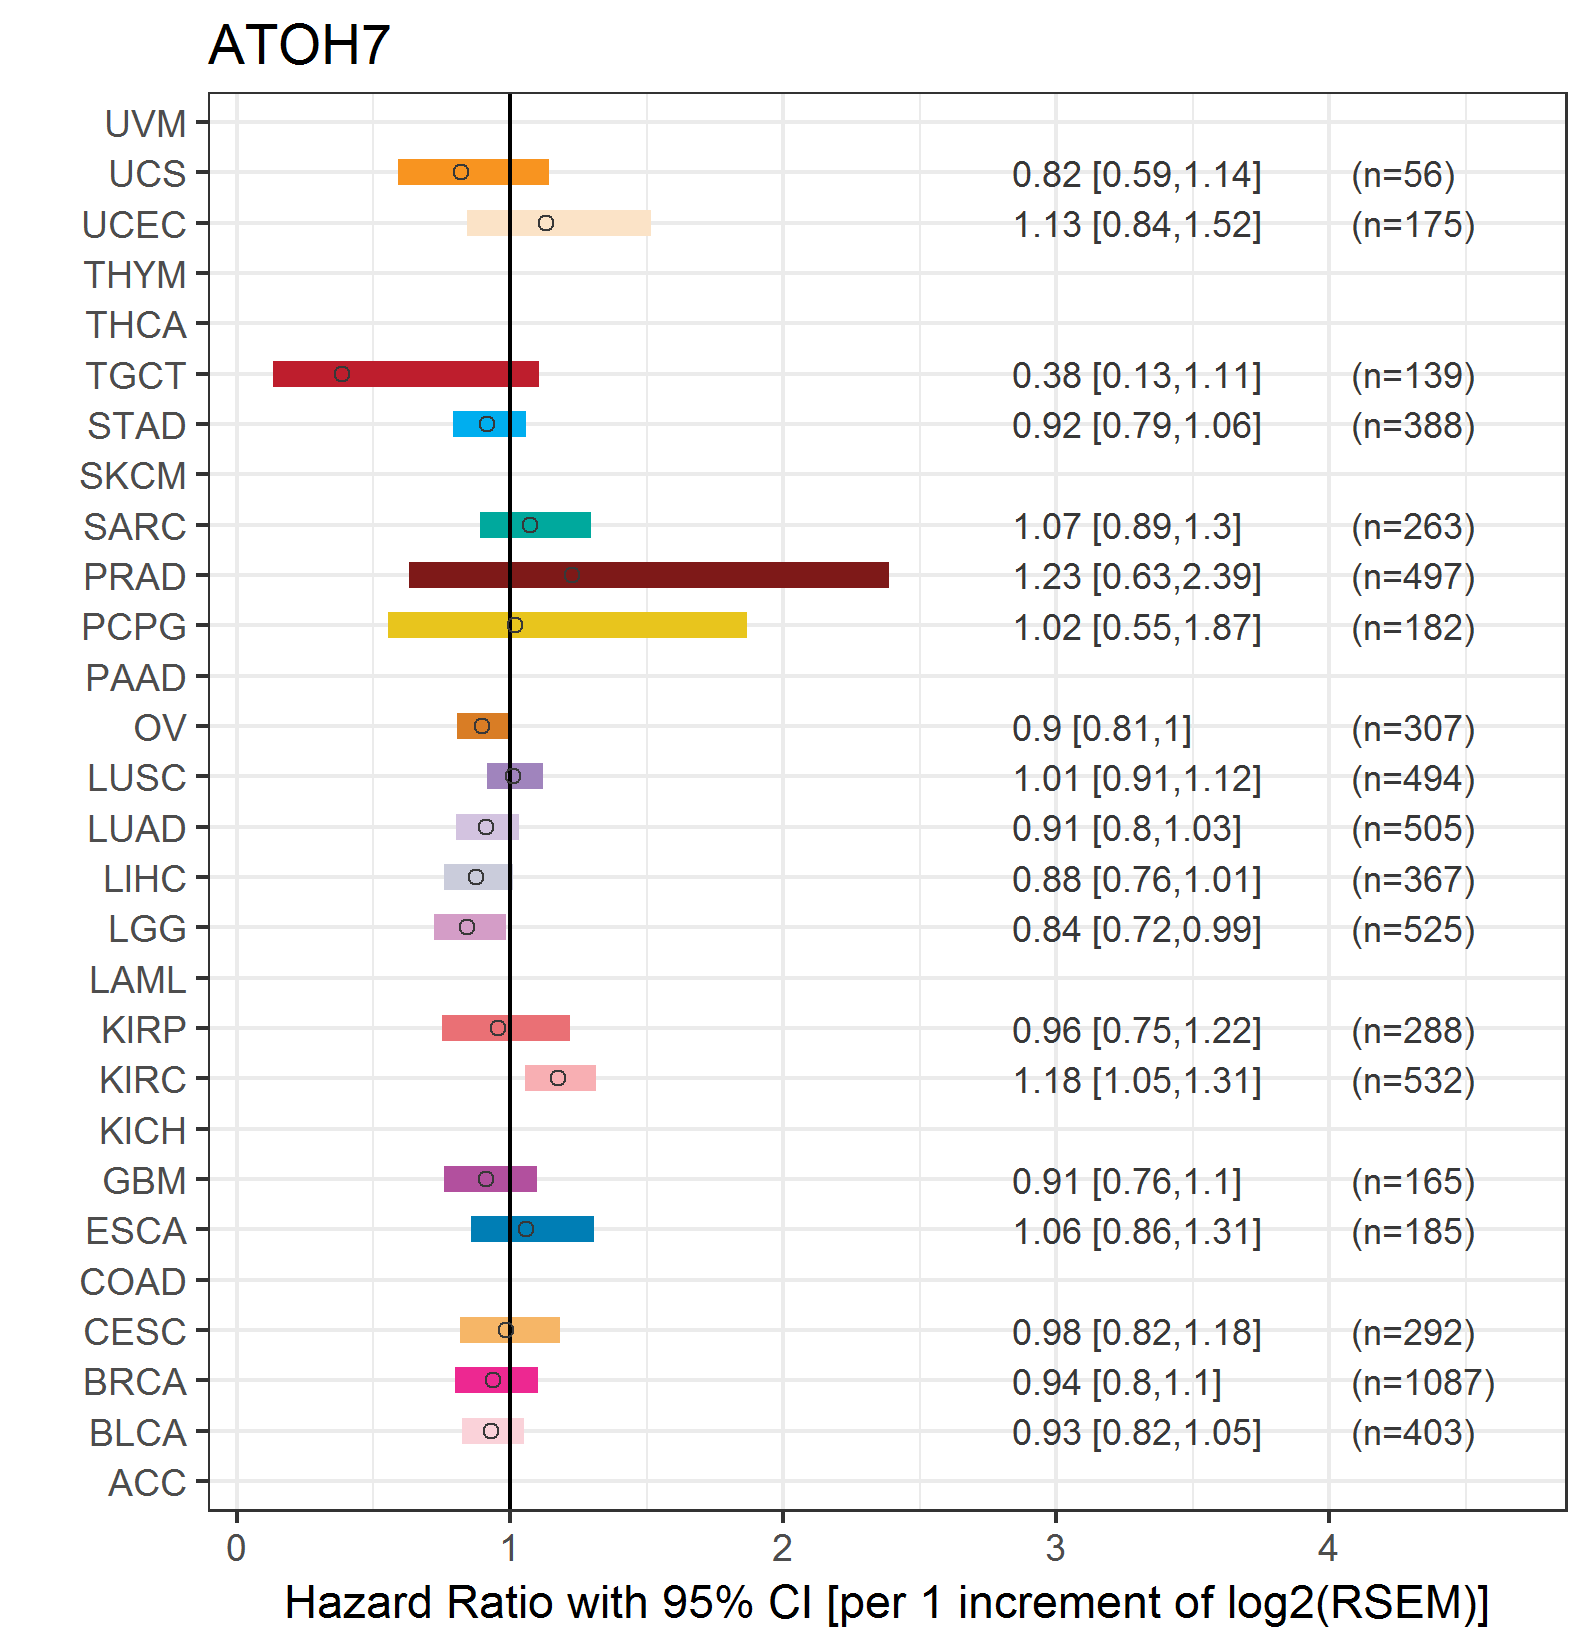 |
| Forest plot of Cox proportional hazard ratio (HR) and 95% CI of relapse free survival (RFS) using 28 cancer types (TCGA IlluminaHiSeq_RNASeqV2, pan-cancer normalized log2(norm_counts+1) data, version 2016-08-16) (TCGA clinicalMatrix, phenotype data, version 2016-04-27) * Click on the image enlarge it in a new window. |
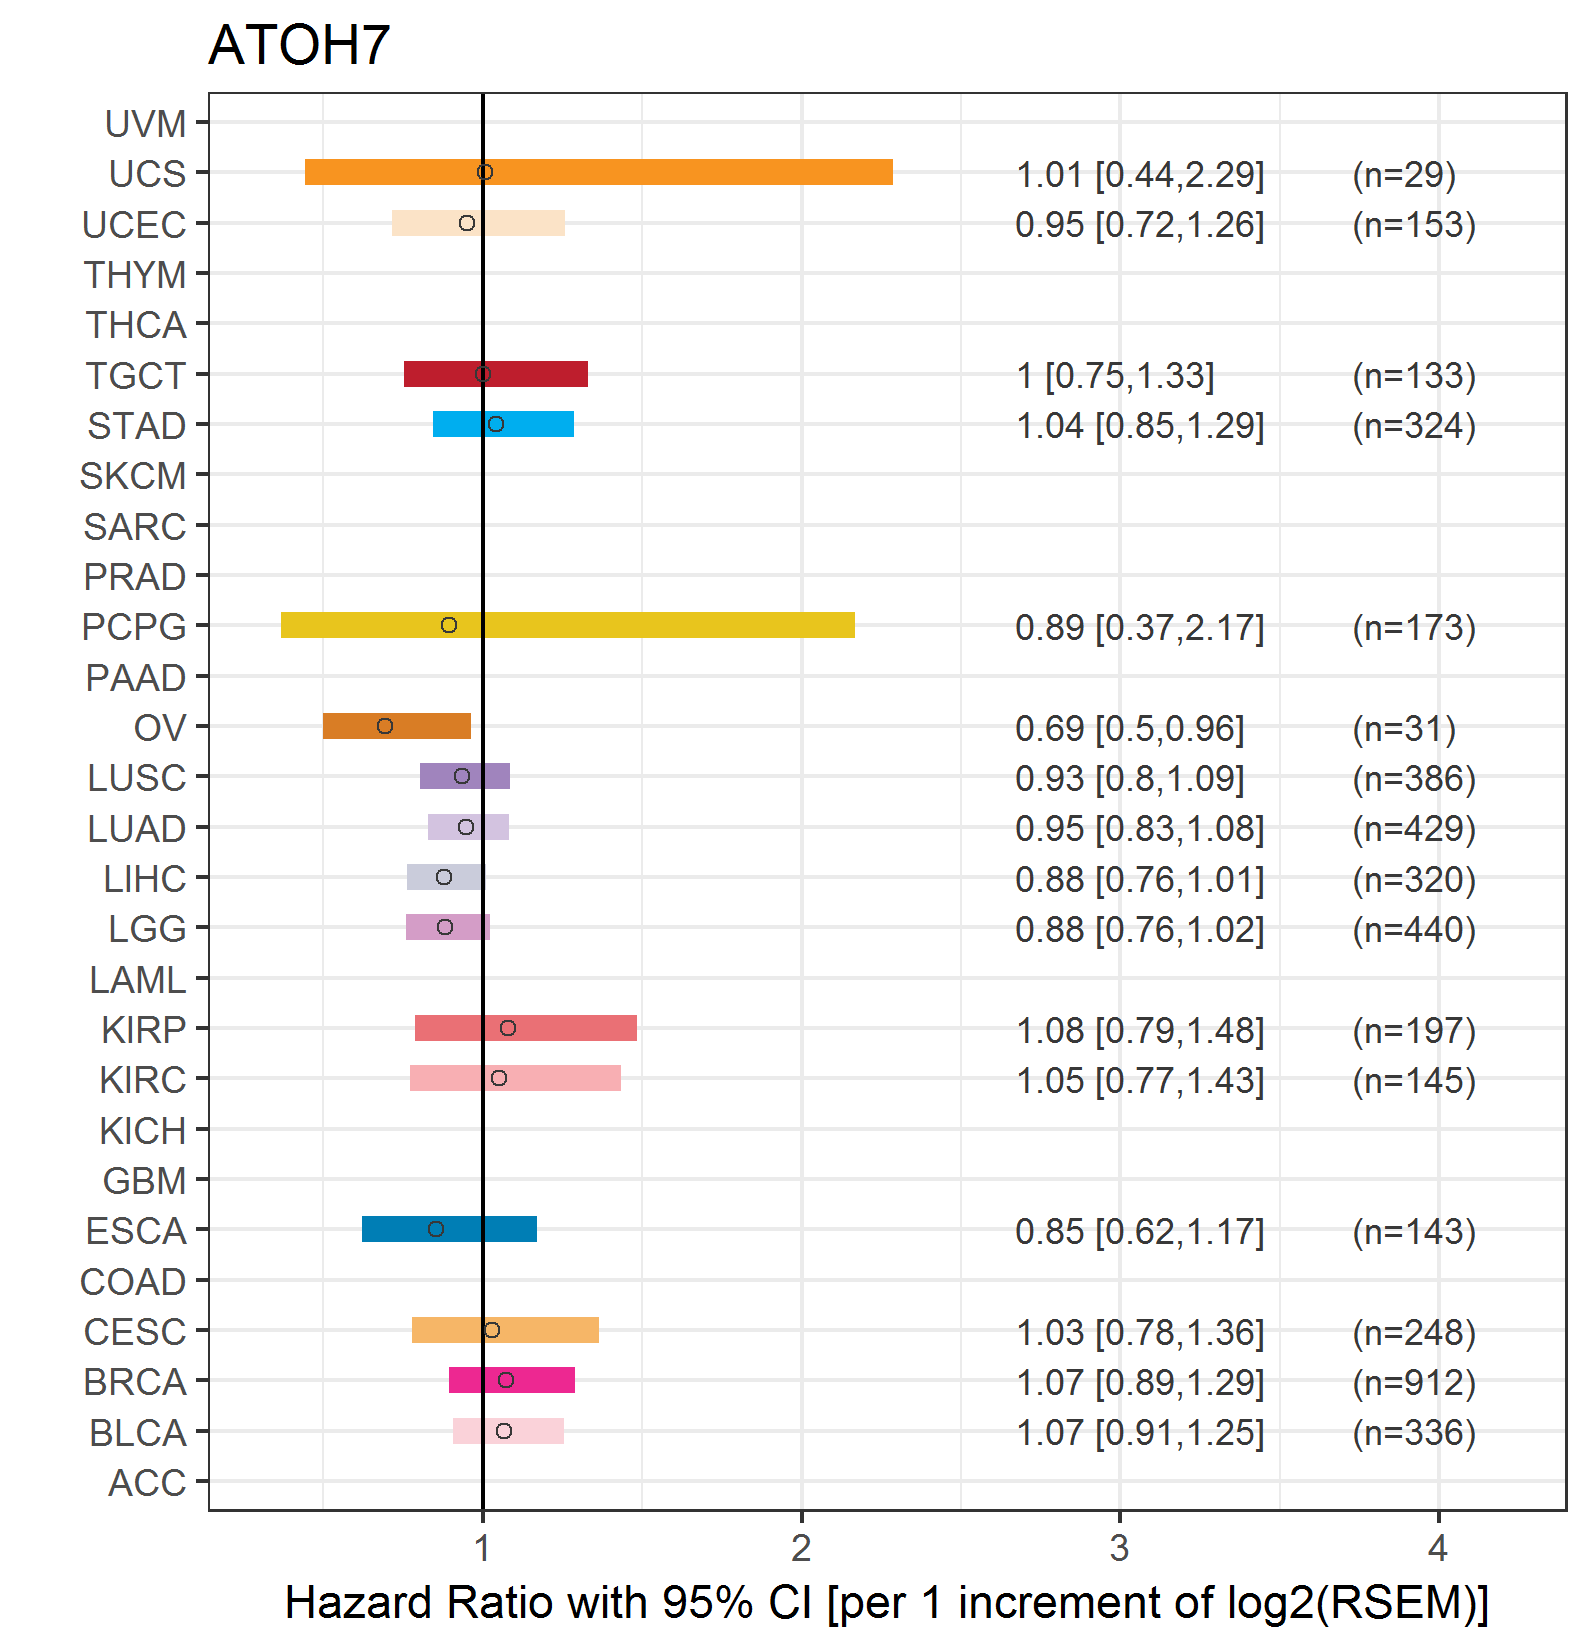 |
| Top |
| TissGeneClin for ATOH7 |
| TissGeneDrug for ATOH7 |
| Drug information targeting TissGene (DrugBank Version 5.0.6, 2017-04-01) |
| DrugBank ID | Drug name | Drug activity | Drug type | Drug status |
| Top |
| TissGeneDisease for ATOH7 |
| Disease information associated with TissGene (DisGeNet, 2016-06-01) |
| Disease ID | Disease name | # pubmeds | Source |
| umls:C0017601 | Glaucoma | 3 | BeFree |
| umls:C0085648 | Synovial Cyst | 3 | BeFree |
| umls:C0152136 | Low Tension Glaucoma | 3 | BeFree |
| umls:C0339573 | Glaucoma, Primary Open Angle | 3 | BeFree |
| umls:C1258666 | Myxoid cyst | 3 | BeFree |
| umls:C0338502 | Hypoplasia of the optic nerve | 2 | BeFree |
| umls:C1969783 | Persistent Hyperplastic Primary Vitreous, Autosomal Recessive | 2 | UNIPROT |
| umls:C0009363 | Congenital ocular coloboma (disorder) | 1 | BeFree |
| umls:C0015397 | Disorder of eye | 1 | GAD |
| umls:C0017606 | Primary angle-closure glaucoma | 1 | BeFree |
| umls:C0035309 | Retinal Diseases | 1 | BeFree |
| umls:C0154094 | Carcinoma in situ of eye | 1 | GAD |
| umls:C0266568 | Persistent Hyperplastic Primary Vitreous | 1 | BeFree,ORPHANET |
| umls:C0339539 | Familial Exudative Vitreoretinopathy | 1 | BeFree |
| umls:C0456909 | Blind Vision | 1 | GAD |
| umls:C0595921 | Intraocular pressure disorder | 1 | BeFree |
| umls:C1857299 | RETINAL NONATTACHMENT, NONSYNDROMIC CONGENITAL | 1 | BeFree,CLINVAR |
| umls:C3151617 | CORNEAL OPACIFICATION WITH OTHER OCULAR ANOMALIES | 0 | ORPHANET |
|
Copyright 2016-Present - The University of Texas Health Science Center at Houston (UTHealth) Web File Viewing | How to Report, Fraud, Waste and Abuse | State of Texas | Statewide Search | Texas Homeland Security | Site Policies |