 |
| |
| |
| |
| |
| |
| |
|

| TissGeneSummary for FAM181B |
 Gene summary Gene summary |
| Basic gene information | Gene symbol | FAM181B |
| Gene name | family with sequence similarity 181, member B | |
| Synonyms | - | |
| Cytomap | UCSC genome browser: 11q14.1 | |
| Type of gene | protein-coding | |
| RefGenes | NM_175885.3, | |
| Description | protein FAM181B | |
| Modification date | 20141207 | |
| dbXrefs | HGNC : HGNC | |
| HPRD : 14575 | ||
| Protein | UniProt: go to UniProt's Cross Reference DB Table | |
| Expression | CleanEX: HS_FAM181B | |
| BioGPS: 220382 | ||
| Pathway | NCI Pathway Interaction Database: FAM181B | |
| KEGG: FAM181B | ||
| REACTOME: FAM181B | ||
| Pathway Commons: FAM181B | ||
| Context | iHOP: FAM181B | |
| ligand binding site mutation search in PubMed: FAM181B | ||
| UCL Cancer Institute: FAM181B | ||
| Assigned class in TissGDB* | C | |
| Included tissue-specific gene expression resources | HPA,TiGER | |
| Specific-tissues in normal samples (assigned by TissGDB using HPA, TiGER, and GTEx) | Brain | |
| Cancer types related to the specific-tissues in cancer samples (assigned by TissGDB using TCGA) | GBM,LGG | |
| Reference showing the relevant tissue of FAM181B | ||
| Description by TissGene annotations | ||
| * Class A consists of genes with literature evidence and is part of the cTissGenes. Class B consists of only cTissGenes without additional evidence. The remaining genes belong to Class C. |
| Gene ontology having evidence of Inferred from Direct Assay (IDA) from Entrez |
| GO ID | GO term | PubMed ID |
| Top |
| TissGeneExp for FAM181B |
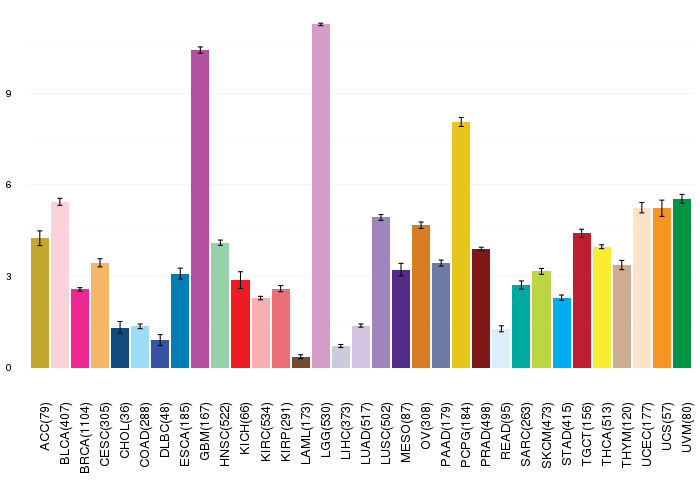
| Gene expressions across 28 cancer types (X-axis: cancer type and Y-axis: log2(norm_counts+1)) (TCGA IlluminaHiSeq_RNASeqV2, pan-cancer normalized log2(norm_counts+1) data, version 2016-08-16) |
 |
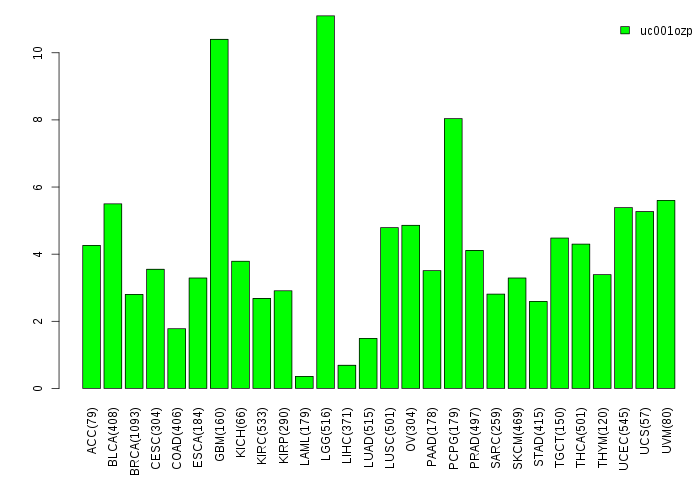
| Gene isoform expressions across 28 cancer types (X-axis: cancer type and Y-axis: log2(norm_counts+1)) (TCGA pan-cancer tcga_rsem_isoform_tpm, version 2016-09-01) |
 |
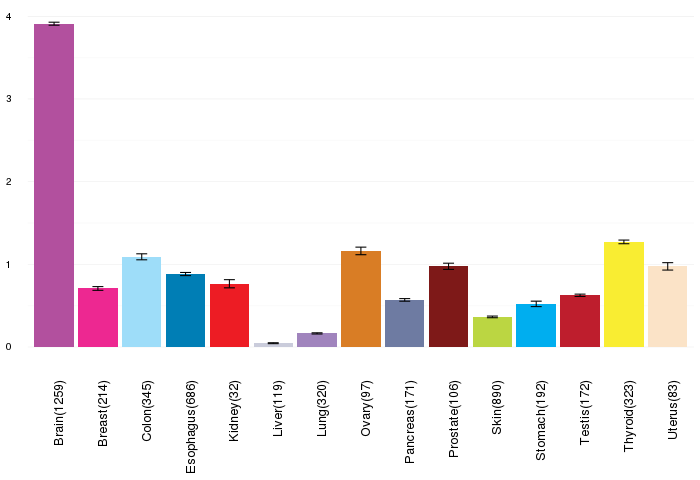
| Gene expressions across normal tissues of GTEx data (GTEx GTEx_Analysis_v6_RNA-seq_RNA-SeQCv1.1.8_gene_rpkm.gct) - Here, we shows the matched tissue types only among our 28 cancer types. |
 |
| Different expressions across 14 cancer types with more than 10 samples between matched tumors and normals (X-axis: cancer type and Y-axis: log2(norm_counts+1)) (TCGA IlluminaHiSeq_RNASeqV2, pan-cancer normalized log2(norm_counts+1) data, version 2016-08-16) |
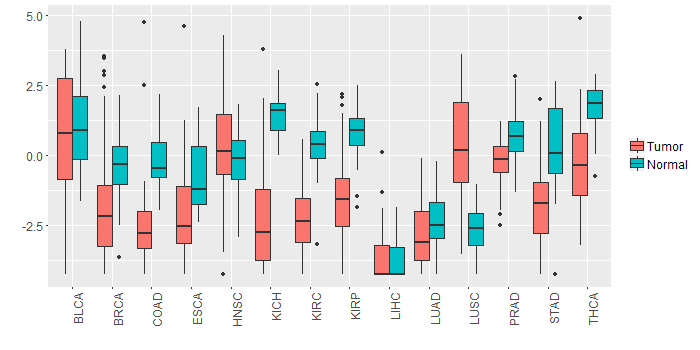 |
| - Significantly differentially expressed cancer types and information. (|Fold change|>1 and FDR<0.05) |
| Cancer type | Mean(exp) in tumor | Mean(exp) in matched normal | Log2FC | P-val. | FDR |
| BRCA | -1.929539352 | -0.33879023 | -1.590749123 | 1.81E-13 | 8.46E-13 |
| COAD | -2.274121066 | -0.194674913 | -2.079446154 | 1.73E-05 | 7.51E-05 |
| LUSC | 0.282243413 | -2.632158548 | 2.914401961 | 1.18E-14 | 6.94E-14 |
| THCA | -0.239063765 | 1.777207421 | -2.016271186 | 4.31E-14 | 4.65E-13 |
| STAD | -1.678500153 | 0.264277972 | -1.942778125 | 3.13E-06 | 4.37E-05 |
| KIRC | -2.307590083 | 0.417989083 | -2.725579167 | 1.74E-33 | 4.24E-32 |
| KIRP | -1.337925153 | 0.829721722 | -2.167646875 | 5.10E-08 | 3.31E-07 |
| KICH | -2.094829528 | 1.412298472 | -3.507128 | 2.60E-08 | 1.29E-07 |
| Top |
| TissGene-miRNA for FAM181B |
| Significantly anti-correlated miRNAs of TissGene across 28 cancer types (Gene-miRNA relations from TargetScanHuman Relsease 7.1, Conserved_Site_Context_Scores.txt.zip, 06.01.2016) (TCGA IlluminaHiSeq_miRNASeq, log2(RPM+1) data, version 2016-11-21) (TCGA IlluminaHiSeq_RNASeqV2, log2(normalized_count+1) data, version 2016-08-16) (Spearman’s Rank Correlation (p-value<0.05 and coefficient<-0.25)) |
| Cancer type | miRNA id | miRNA accession | P-val. | Coeff. | # samples |
| Top |
| TissGeneMut for FAM181B |
| TissGeneSNV for FAM181B |
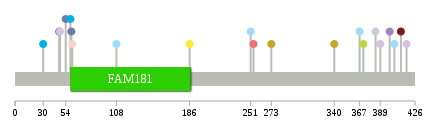
| nsSNV counts per each loci. Different colors of circles represent different cancer types. Circle size denotes number of samples. (TCGA somatic mutation (SNPs and small INDELs) data, version 2016-04-25) * Click on the image to enlarge it in a new window. |
 |
 |
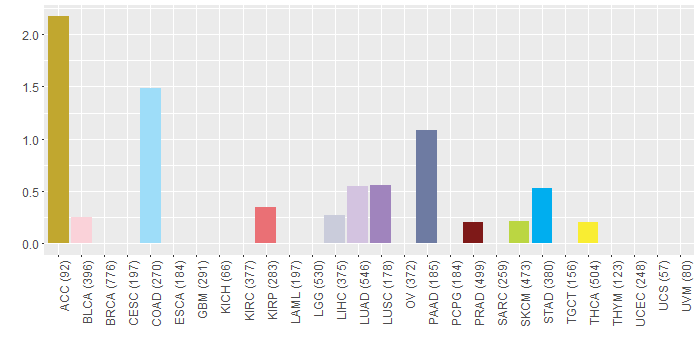
| Somatic nucleotide variants of TissGene across 28 cancer types (X-axis: cancer type and Y-axis: % of mutated samples) The numbers in parentheses are numbers of samples with mutation (nsSNVs). (TCGA somatic mutation (SNPs and small INDELs) data, version 2016-04-25) |
 |
| - nsSNVs sorted by frequency. |
| AAchange | Cancer type | # samples |
| p.E61K | DLBC | 1 |
| p.V186L | THCA | 1 |
| p.H389Y | LUAD | 1 |
| p.D411N | PRAD | 1 |
| p.S251R | READ | 1 |
| p.S251R | COAD | 1 |
| p.P340S | ACC | 1 |
| p.G48S | LUAD | 1 |
| p.I101M | HNSC | 1 |
| p.G30R | STAD | 1 |
| p.A47T | PAAD | 1 |
| p.A371V | SKCM | 1 |
| p.G273S | ACC | 1 |
| p.E61K | BLCA | 1 |
| p.A417S | LUAD | 1 |
| p.R367P | COAD | 1 |
| p.D254N | KIRP | 1 |
| p.R60C | PAAD | 1 |
| p.V59M | STAD | 1 |
| p.Y399* | LUSC | 1 |
| p.G35A | DLBC | 1 |
| p.A54T | PAAD | 1 |
| p.Y404X | COAD | 1 |
| p.P384L | LIHC | 1 |
| p.M108I | COAD | 1 |
| Top |
| TissGeneCNV for FAM181B |
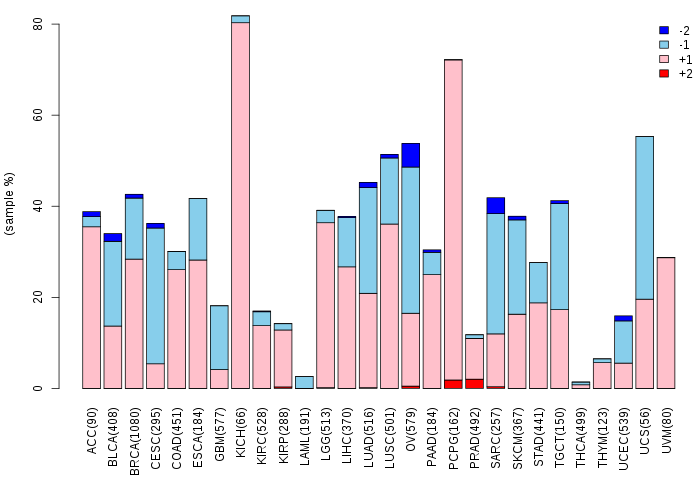
| Copy number variations of TissGene across 28 cancer types (X-axis: cancer type and Y-axis: % of CNV samples) (TCGA Gistic2_CopyNumber_Gistic2_all_data_by_genes, Gistic2 copy number data, version 2016-08-16) |
 |
| Top |
| TissGeneFusions for FAM181B |
| Fusion genes including TissGene (ChimerDB 3.0, 2016-12-01 and TCGA fusion Portal 2015-12-01) |
| Database | Src | Cancer type | Sample | Fusion gene | ORF | 5'-gene BP | 3'-gene BP |
| Top |
| TissGeneNet for FAM181B |
| Co-expressed gene networks based on protein-protein interaction data (CePIN) (TCGA IlluminaHiSeq_RNASeqV2, pan-cancer normalized log2(norm_counts+1) data, version 2016-08-16) (PINA2 ppi data) |
| Top |
| TissGeneProg for FAM181B |
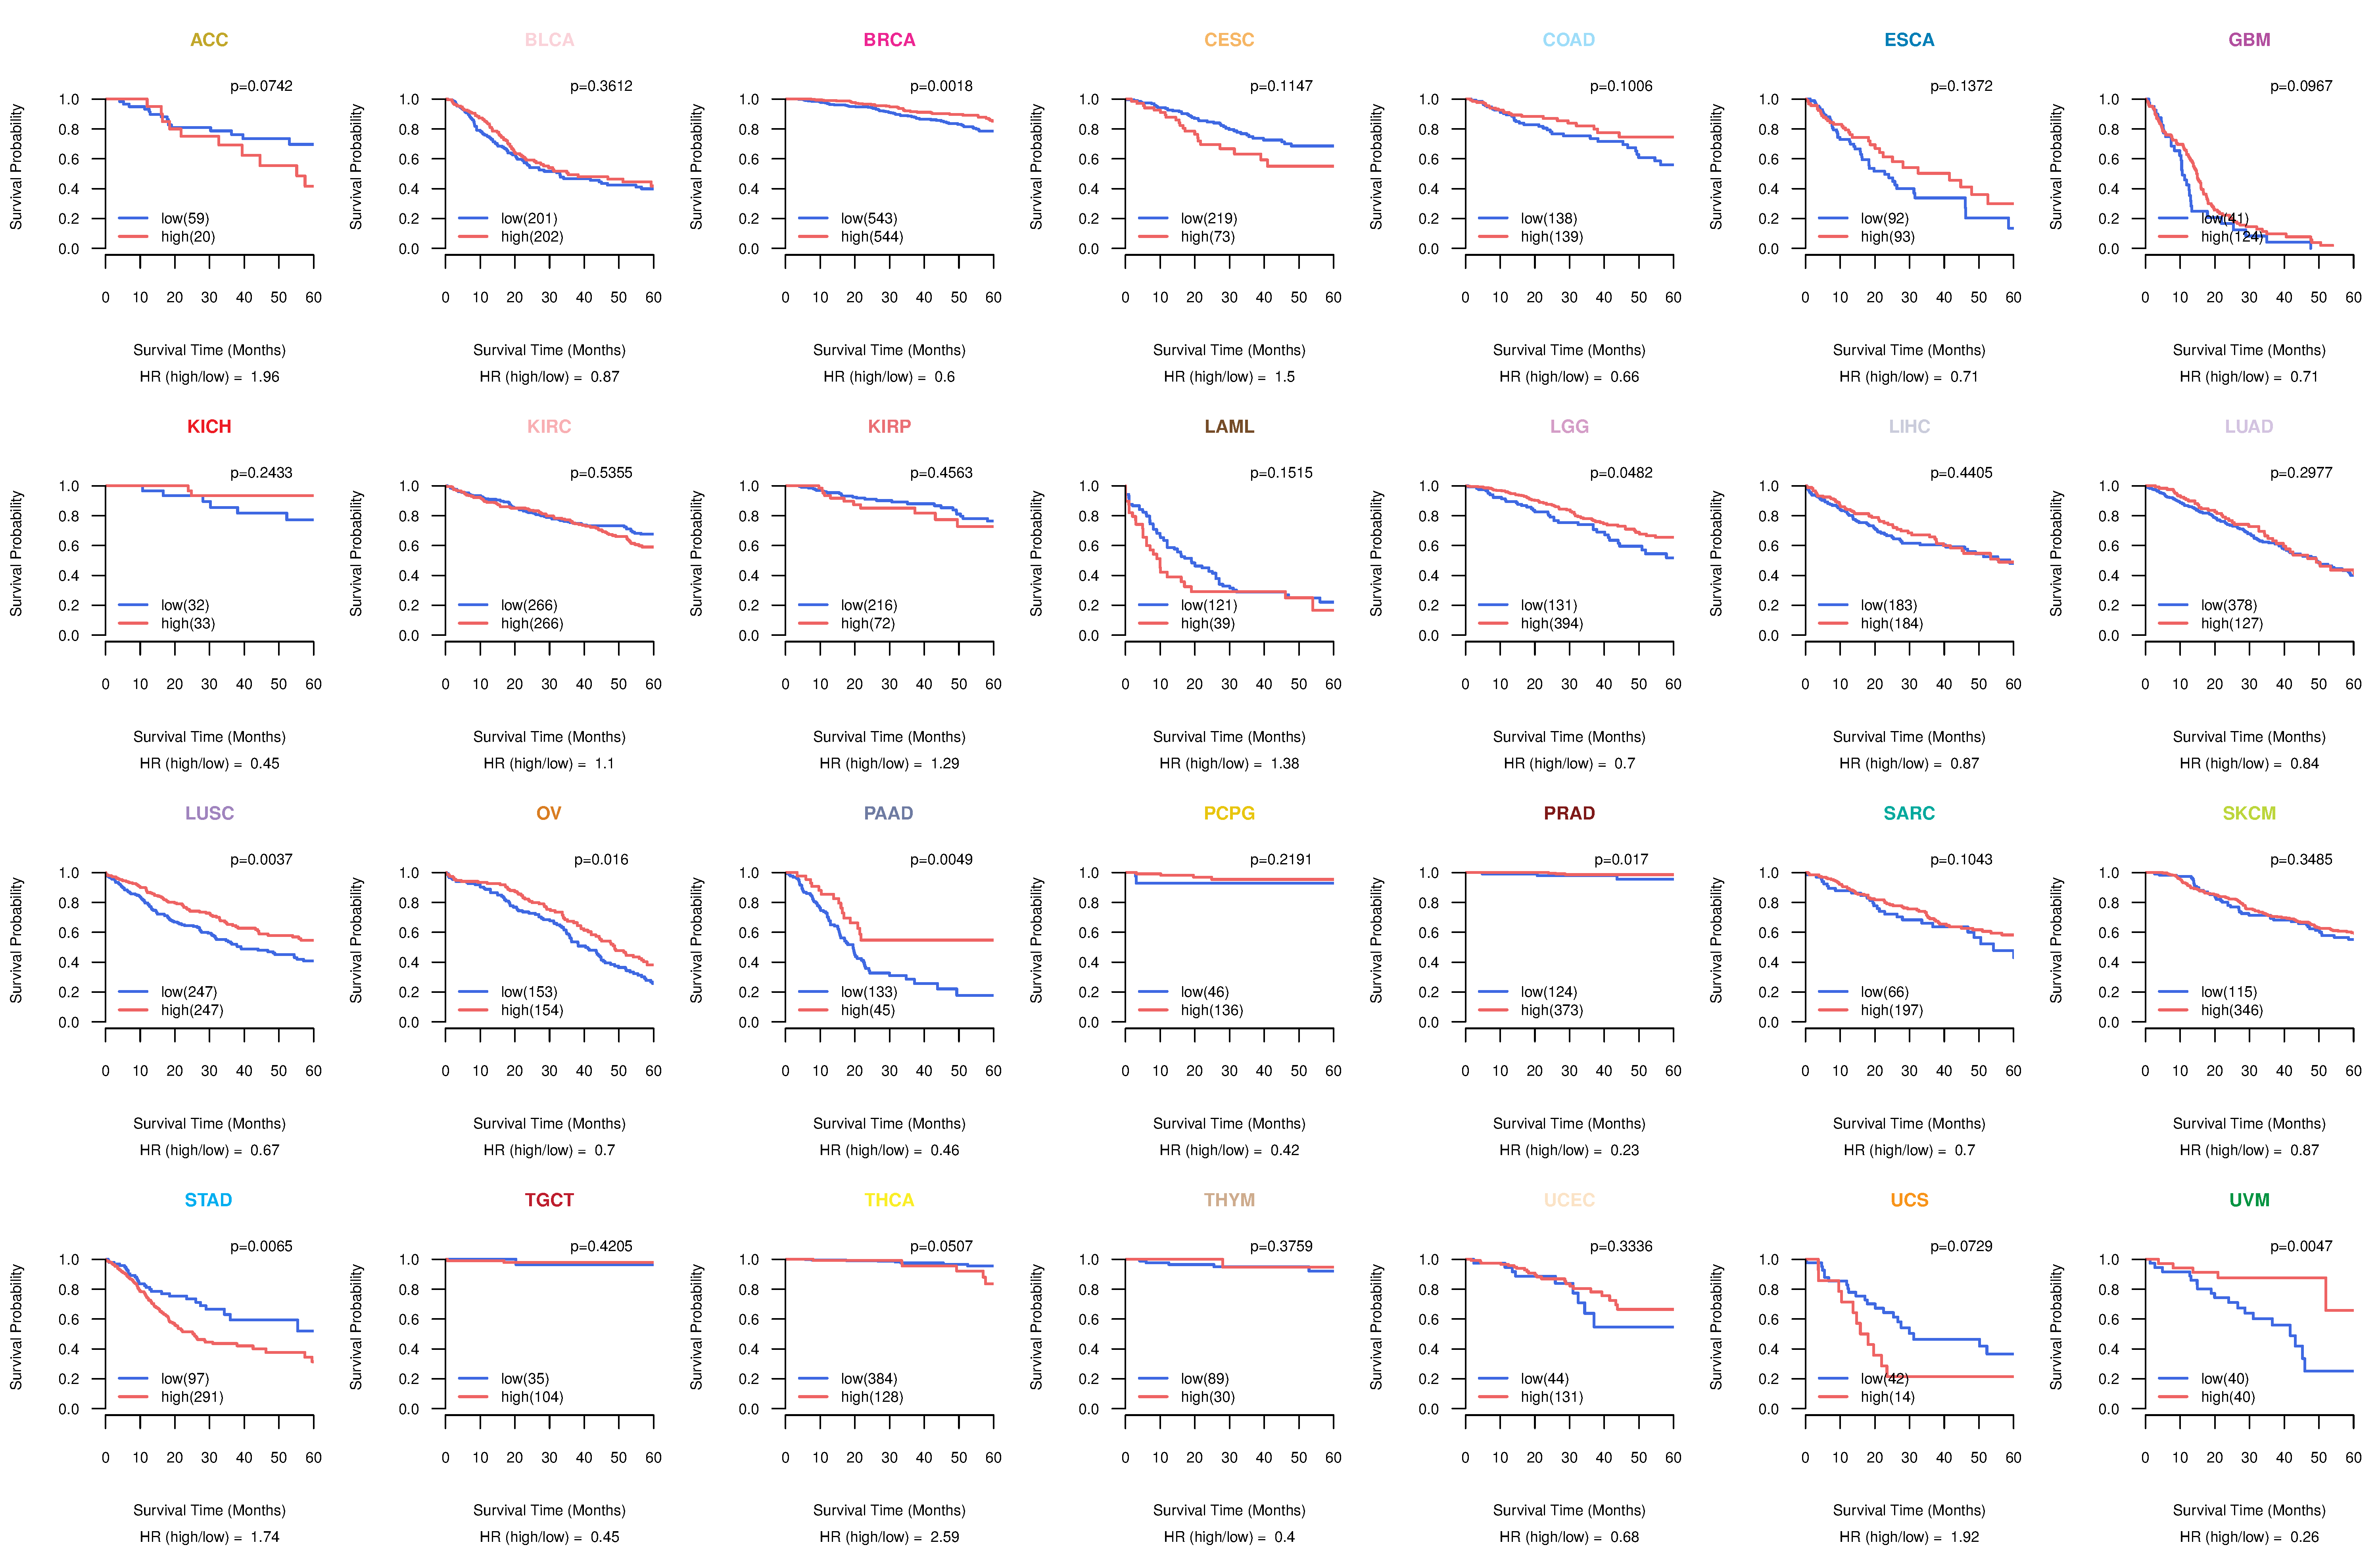
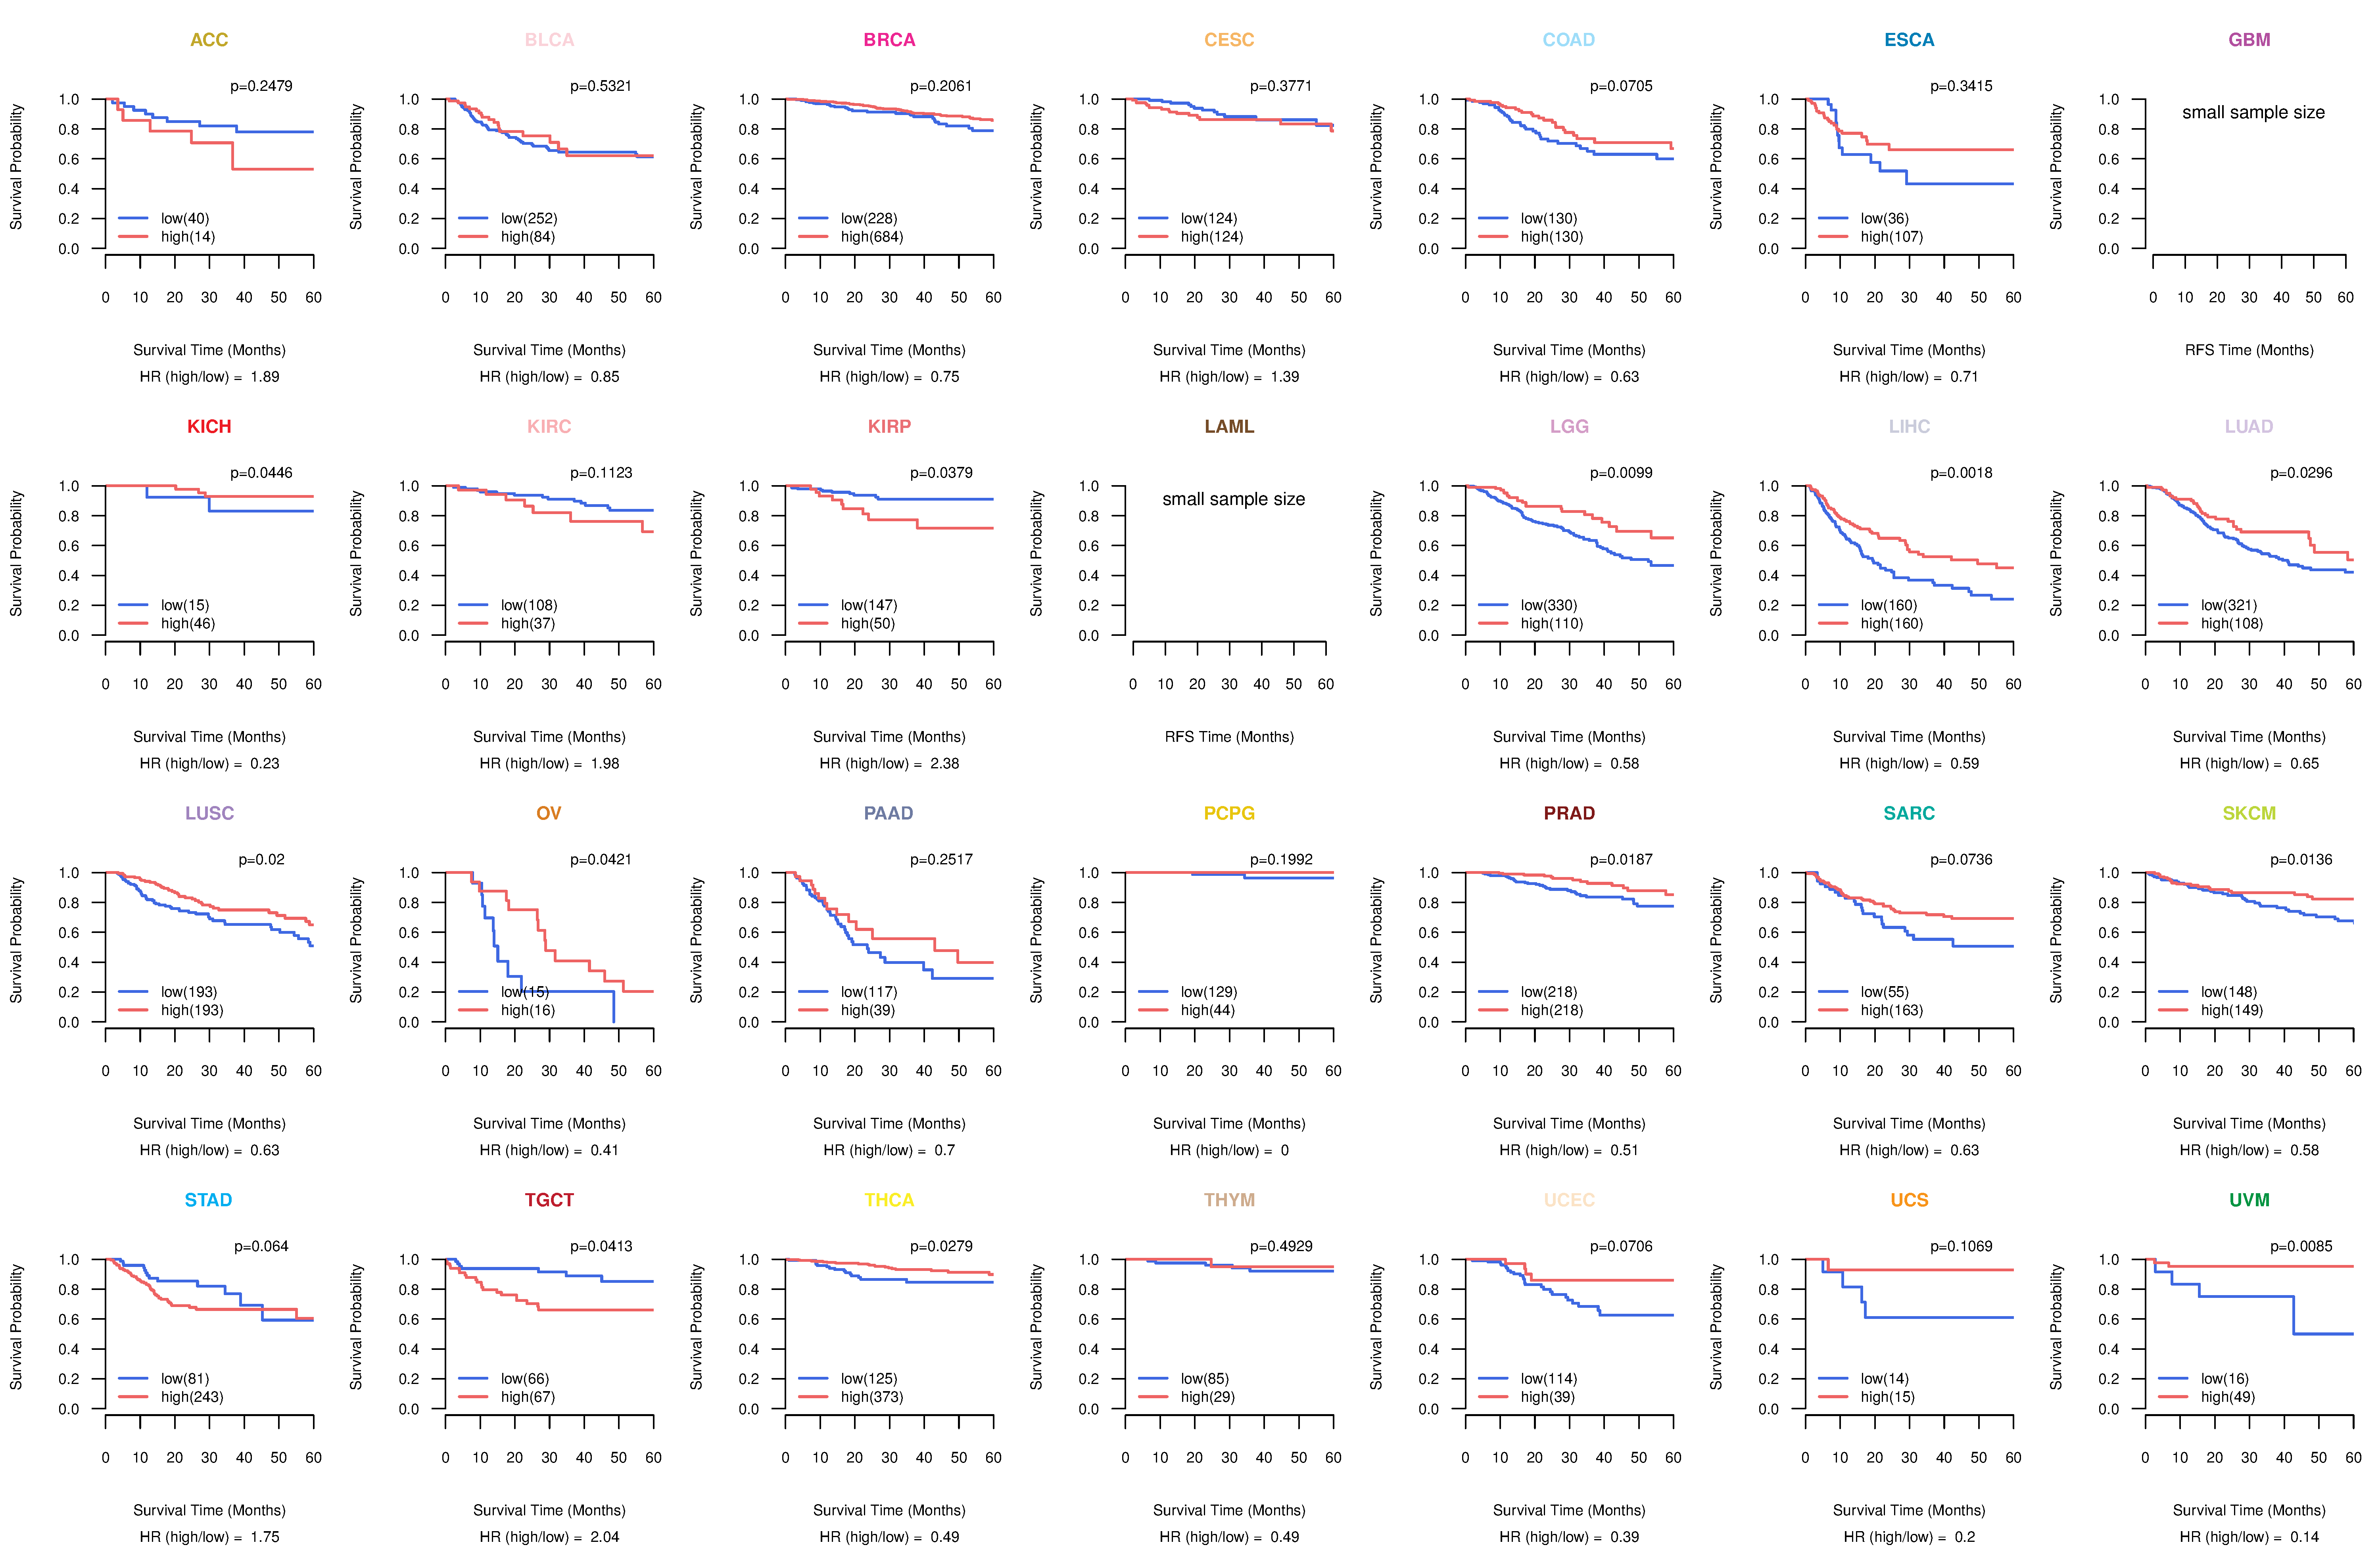
| Kaplan-Meier plots with logrank tests of overall survival (OS) using 28 cancer types (TCGA IlluminaHiSeq_RNASeqV2, pan-cancer normalized log2(norm_counts+1) data, version 2016-08-16) (TCGA clinicalMatrix, phenotype data, version 2016-04-27) * Click on the image to enlarge it in a new window. |
 |
| Kaplan-Meier plots with logrank test of relapse free survival (RFS) using 28 cancer types (TCGA IlluminaHiSeq_RNASeqV2, pan-cancer normalized log2(norm_counts+1) data, version 2016-08-16) (TCGA clinicalMatrix, phenotype data, version 2016-04-27) * Click on the image enlarge it in a new window. |
 |
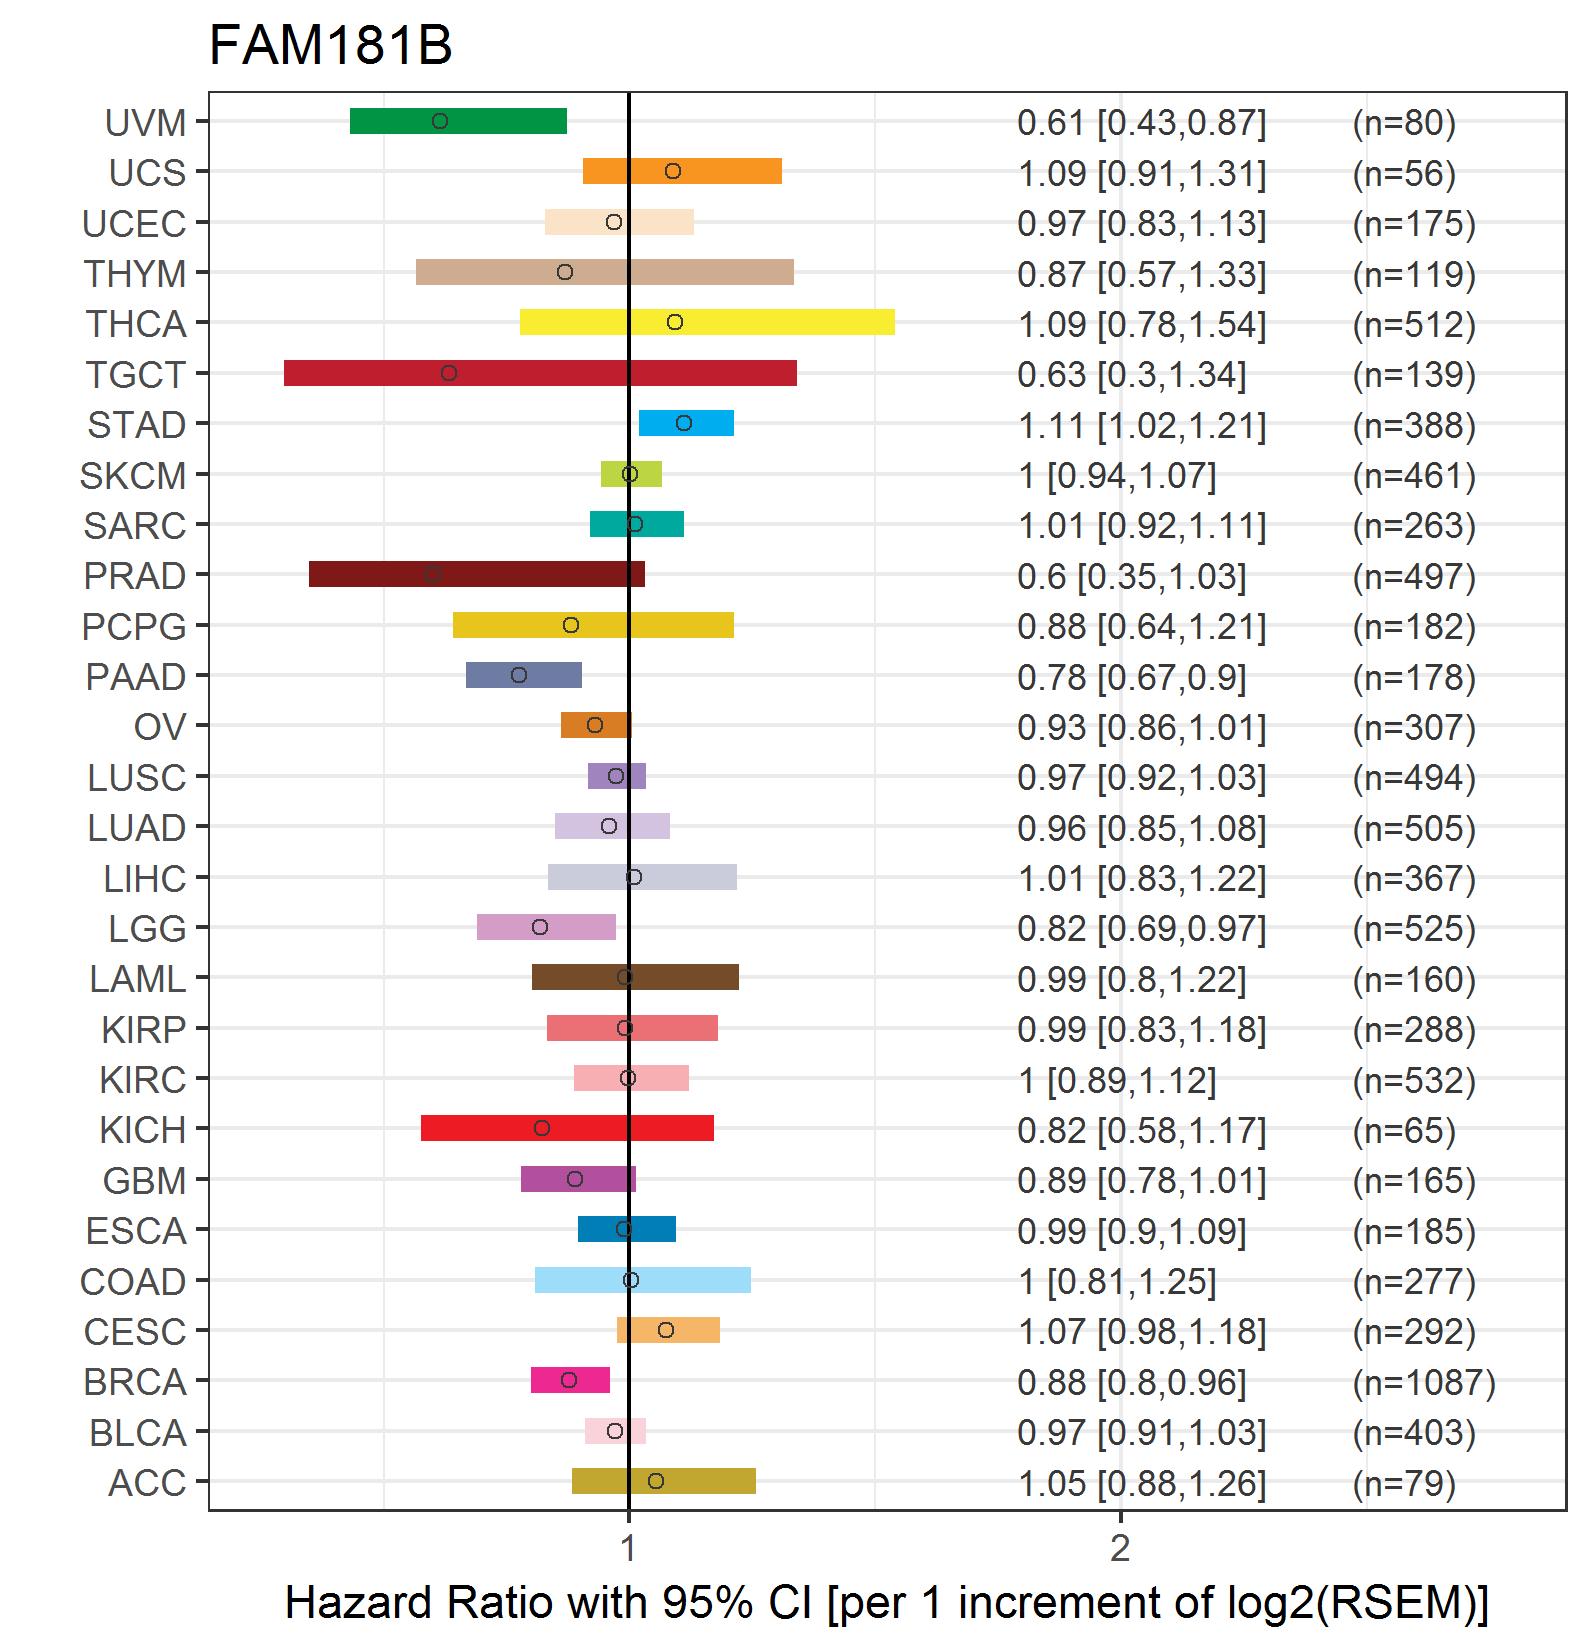
| Forest plot of Cox proportional hazard ratio (HR) and 95% CI of overall survival (OS) using 28 cancer types (TCGA IlluminaHiSeq_RNASeqV2, pan-cancer normalized log2(norm_counts+1) data, version 2016-08-16) (TCGA clinicalMatrix, phenotype data, version 2016-04-27) * Click on the image enlarge it in a new window. |
 |
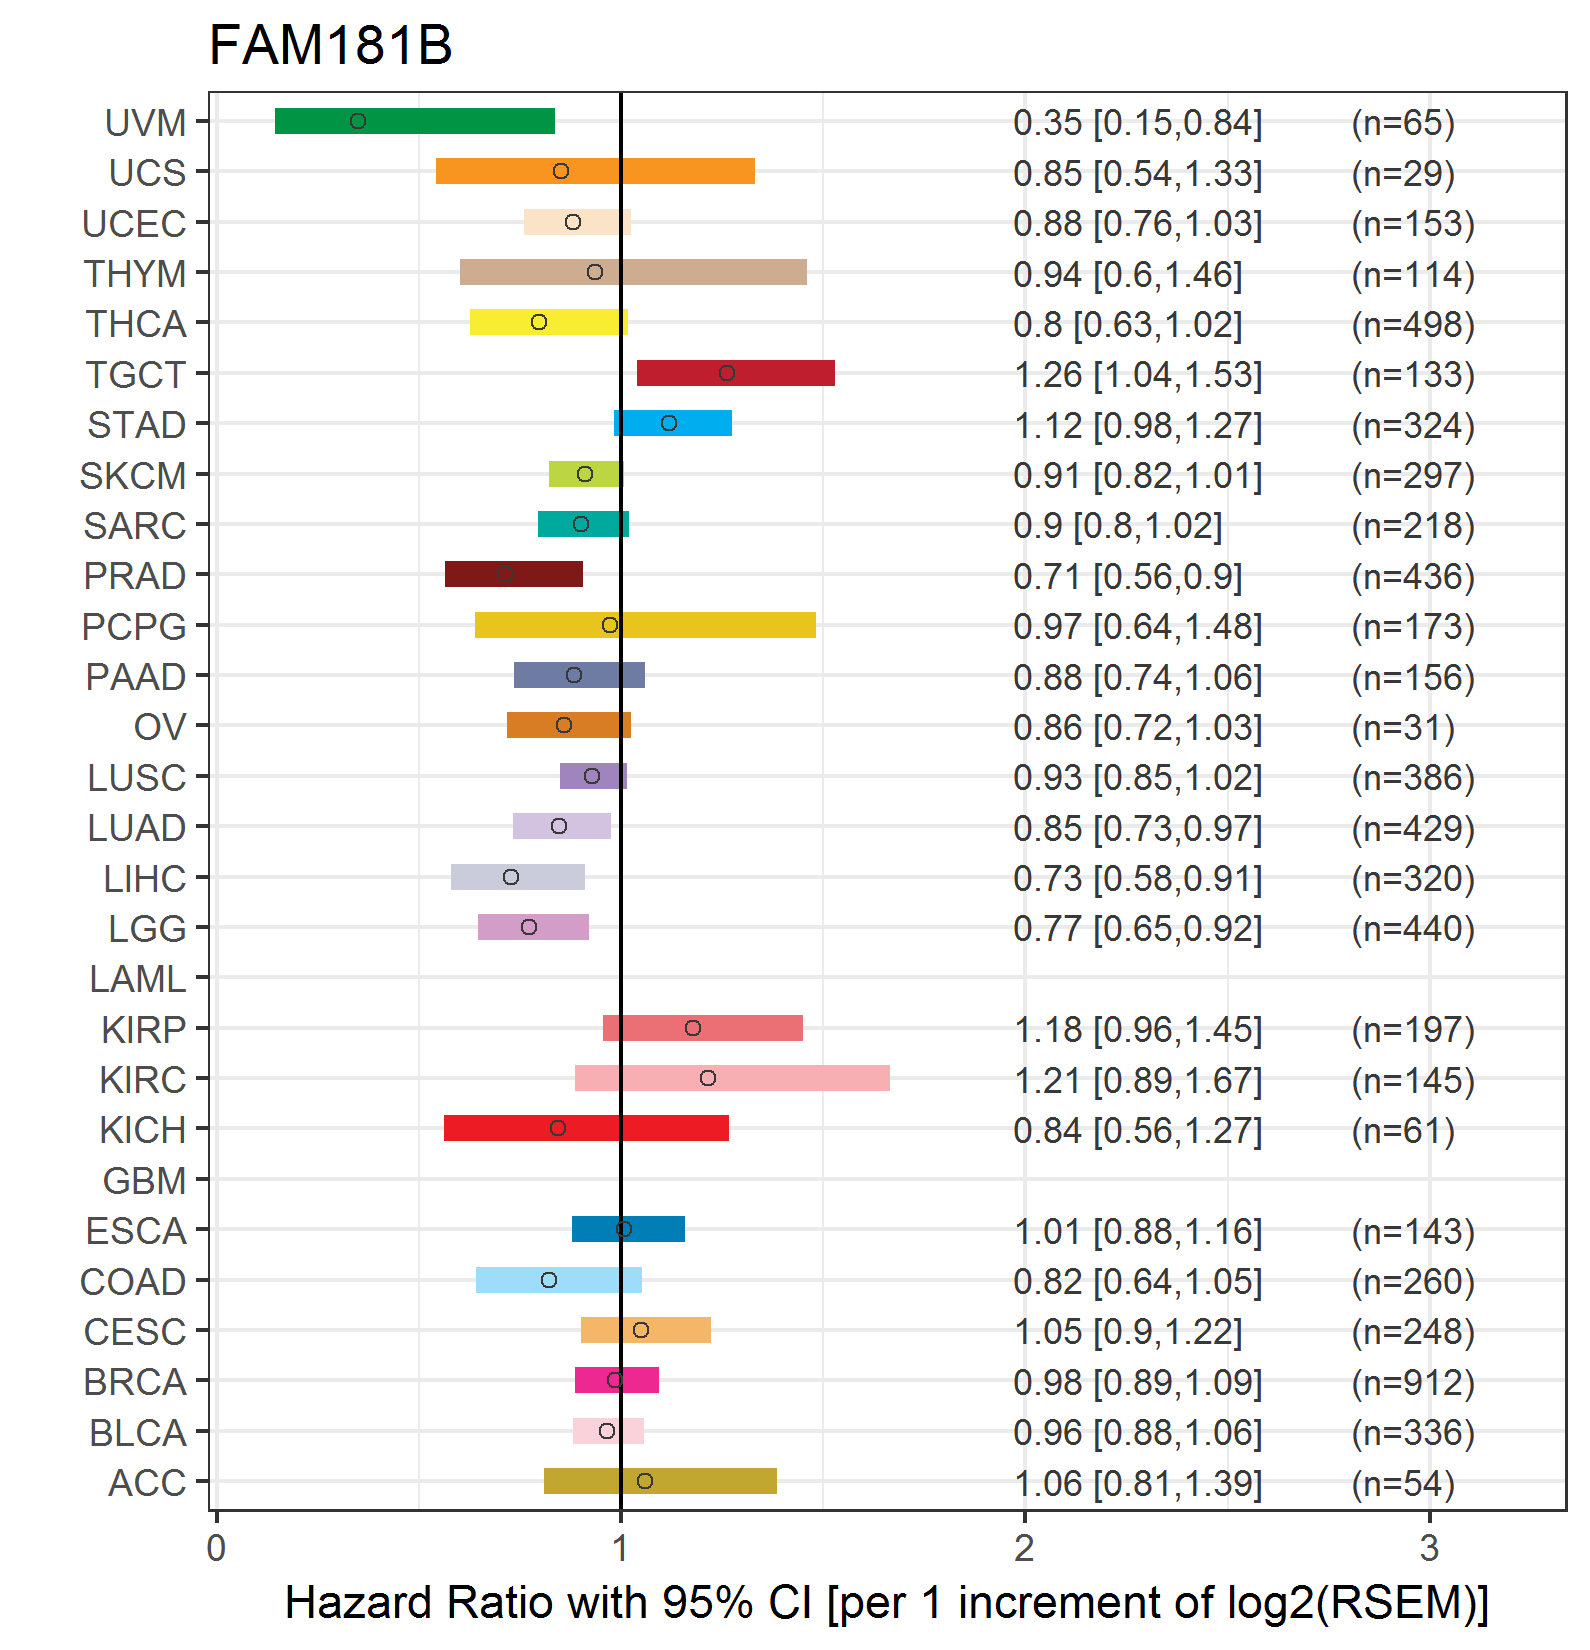
| Forest plot of Cox proportional hazard ratio (HR) and 95% CI of relapse free survival (RFS) using 28 cancer types (TCGA IlluminaHiSeq_RNASeqV2, pan-cancer normalized log2(norm_counts+1) data, version 2016-08-16) (TCGA clinicalMatrix, phenotype data, version 2016-04-27) * Click on the image enlarge it in a new window. |
 |
| Top |
| TissGeneClin for FAM181B |
| TissGeneDrug for FAM181B |
| Drug information targeting TissGene (DrugBank Version 5.0.6, 2017-04-01) |
| DrugBank ID | Drug name | Drug activity | Drug type | Drug status |
| Top |
| TissGeneDisease for FAM181B |
| Disease information associated with TissGene (DisGeNet, 2016-06-01) |
| Disease ID | Disease name | # pubmeds | Source |
|
Copyright 2016-Present - The University of Texas Health Science Center at Houston (UTHealth) Web File Viewing | How to Report, Fraud, Waste and Abuse | State of Texas | Statewide Search | Texas Homeland Security | Site Policies |